PCOS occurs when chronic anovulation leads to polycystic morphology of the ovaries. The disease is reflected as an endocrine derangement due to chronic anovulation when normal cyclical pattern of hormonal changes is not followed, rather there is a steady state in which gonadotropin and sex steroid concentration vary throughout menstrual cycle [1].
Its incidence varies from 2-26% in India with approximately 3.7% in northern India [2]. It not only disturbs the menstrual cycle but also affects the fertility of woman. In the long run, women with PCOS are prone to GDM, Type 2 diabetes mellitus, dyslipidemia, hypertension and Cardiovascular Disorder (CVD) and poor quality of life [1,3].
In 1935, Stein and Leventhal were the first to describe association of amenorrhea and obesity with bilateral polycystic ovary. Various controversies regarding its diagnosis and treatment came up with time. In 2003, Rotterdam European Society of Reproduction and Embryology (ESHRE) and the American Society for Reproductive Medicine (ASRM) proposed the presence of any two of the three criteria for diagnosis of polycystic ovary syndrome based on history, clinical or sonological or biochemical findings [4].
Hormonal imbalance in PCOS manifests as hyperandrogenism and hyperinsulinemia. Hyperinsulinemia though not a criteria for diagnosing PCOS but is uniquely associated with it. Approximately, 50-70% of patients with PCOS demonstrate profound insulin resistance and secondary hyperinsulinaemia, independent of body weight. Insulin resistance refers to the impaired action of insulin in stimulating glucose transport and in inhibiting lipolysis in adipocytes. Hyperinsulinemia exacerbates ovarian hyperandrogenism by increasing 17 a-hydroxylase activities in the cells and thus promoting androstenedione and testosterone production. Hyperinsulinemia also promotes androgen production by stimulating Luteinising Hormone (LH) and Insulin like Growth Factor 1 (IGF 1) and elevates free testosterone by decreasing the production of Sex Hormone Binding Globulin Thus hyperandrogenemia as a result of hyperinsulinaemia leads to increased facial and body hair, loss of scalp hair, acne and menstrual irregularity. The high insulin level also causes weight gain by increasing food cravings, decreasing satiety and by increasing adipose deposition [3]. AMH is a dimeric glycoprotein member of the Transforming Growth Factor-beta (TGF-beta) protein superfamily and is produced exclusively by the gonads [5]. In male embryo, AMH produced by fetal sertoli cells at the time of testicular differentiation induces regression of the Müllerian ducts and development of Wolffian ducts into male genitalia. In the absence of AMH, the Müllerian ducts develop into female genitalia [6]. AMH expression has been observed in female fetus as early as 32 weeks gestation in granulose cells of ovaries by immunostaining [6] and expressed until menopause. It has recently been demonstrated that oocytes from early pre-antral, late pre-antral and pre-ovulatory follicles up-regulate AMH mRNA levels in granulose cells, in a fashion that is dependent upon the developmental stage of the oocyte. Due to anovulation in PCOS there is accumulation of preantral and small antral follicles which may contribute significantly to the production of high level of AMH [7].
Some studies have concluded that obesity, insulin resistance, and hyperandrogenism may play a major role in the increasing level of AMH [8-10]. Insulin has also been studied as cause of increase in AMH as insulin enhances the gonadotropin stimulated steroid production in granulose cells. A significant positive correlation between AMH and HOMA-IR was observed in few studies [11,12] while a negative correlation between AMH and HOMA-IR has also been reported [13], so further studies need to be conducted in future to determine correlation between AMH and insulin resistance in PCOS patients. Hence the present study was undertaken in order to find correlation of AMH with HOMA-IR in PCOS and normally ovulating women.
Materials and Methods
This was a hospital based observational study conducted at Department of Gynaecology from July 2017 to June 2018. In this study 40 women with PCOS and 40 normally ovulating women were included who consented and fulfilled the inclusion and exclusion criteria. The study was ethically and scientifically approved by the institution with number No./HRH/ 2017/6972. Informed consent was obtained from the subjectes prior to the study.
Anthropometric evaluation was done for all the women, followed by sonological evaluation of the ovaries for follicle number and volume in the follicular phase (day 3). Women with regular ovulatory cycle (21-35 days) and with normal morphology of ovaries on ultrasound were included in the study as normally ovulating women while PCOS patients were defined on the basis of Rotterdam ESHRE/ASRM- Sponsored consensus [4] with presence of atleast two of the following three criteria: 1) Anovulation and/or Oligo-ovulation (women with secondary amenorrhea or with less than 8 cycles in a year); 2) Polycystic ovarian morphology (≥12 follicle measuring 2-9 mm in diameter and/or volume >10 cc in each ovary); and 3) Hyperandrogenism (Clinical/Biochemical) with exclusion of other aetiologies (congenital adrenal hyperplasia, androgen secreting tumours, Cushing’s syndrome).
Pregnant women or women with history of hyperprolactinemia or thyroid disorders or ovarian cyst/endometrioma or who had surgery on ovaries or using oral contraceptives were also excluded. Biochemical hyperandrogenism was identified by tests for testosterone and Dihydroepiandrostenedione-sulphate) (DHEA-S). All the women were evaluated for serum hormonal levels of AMH, FSH and LH along with fasting glucose, insulin and triglyceride levels. HOMA-IR was calculated by multiplying fasting insulin (micU/L) and fasting glucose and dividing by 22.5 i.e., HOMA-IR=Fasting insulin×Fasting glucose/22.5 [14].
All the hormone tests were done by Electro-Chemiluminescence Immunoassay (ECLIA) technique using Elecsysimmunoassay analyser 2010 from the company Roche Diagnostics.
Statistical Analysis
Statistical analysis was done by using IBM SPSS version 25.0 and the obtained data were expressed as mean with standard deviation. The Independent sample Mann-Whitney U Test and Spearman’s rho test were used and p-value of <0.05 was taken as statistically significant.
Results
The study was conducted on 40 normally ovulating and 40 PCOS women. [Table/Fig-1] shows the distribution of women according to age and anthropometric measures. Mean serum AMH, LH, LH/FSH ratio, total testosterone and DHA-S levels were higher in PCOS women and the difference was statistically significant [Table/Fig-2]. Mean Fasting plasma glucose, fasting serum Insulin, HOMA-IR and Triglyceride levels were high in PCOS women as compared to normally ovulating women [Table/Fig-3].
Distribution of women according to age and anthropometric measures.
| PCOS women (n=40) | Normally ovulating women (n=40) | p-value1 |
|---|
| Mean age (in years) | 23.28±4.8 | 24.09±4.4 | 0.112 |
| Height | 153±8.14 cm | 152.87±2.94 | 0.845 |
| Weight | 59.92±9.90 | 55.05±3.90 | <0.001 |
| BMI (kg/sq cm) | 25.6±3.8 | 23.78±3.4 | <0.001 |
1Independent sample Mann-Whitney U Test
Distribution of mean hormonal levels in PCOS and normally ovulating women.
| Mean of serum hormonal level | PCOS women (n=40) | Normally ovulating women (n=40) | p-value1 |
|---|
| AMH (ng/mL) | 9.43±9.50 | 2.16±3.26 | <0.001 |
| LH (mIU/mL) | 15.28±26.6 | 6.77±3.22 | <0.001 |
| FSH (value) | 7.4±3.4 | 9.66±7.2 | 0.001 |
| LH/FSH ratio | 2.04±2.86 | 0.74±0.42 | <0.001 |
| Total testosterone (ng/mL) | 0.40033±0.66 | 0.16±0.24 | <0.001 |
| DHEA-S (nmol/L) | 149.49±85.19 | 99.31±76.22 | 0.011 |
1Independent sample Mann-Whitney U Test
Distribution of mean fasting plasma glucose, Serum fasting Insulin and triglyceride levels in PCOS and normally ovulating women.
| PCOS women (n=40) | Normally ovulating women (n=40) | p-value1 |
|---|
| Mean fasting plasma glucose (mg %) | 92.23±11.9 | 85.94±11.1 | <0.001 |
| Mean serum triglyceride level (mg/dL) | 167±198.4 | 111.02±188.6 | <0.001 |
| Mean fasting serum insulin (micIU/mL) | 20.11±30.96 | 11.64±18.08 | 0.009 |
| Mean HOMA-IR (Fasting insulin×Fasting glucose/22.5) | 4.72±7.58 | 2.50±4.02 | 0.005 |
1Independent sample Mann-Whitney U Test
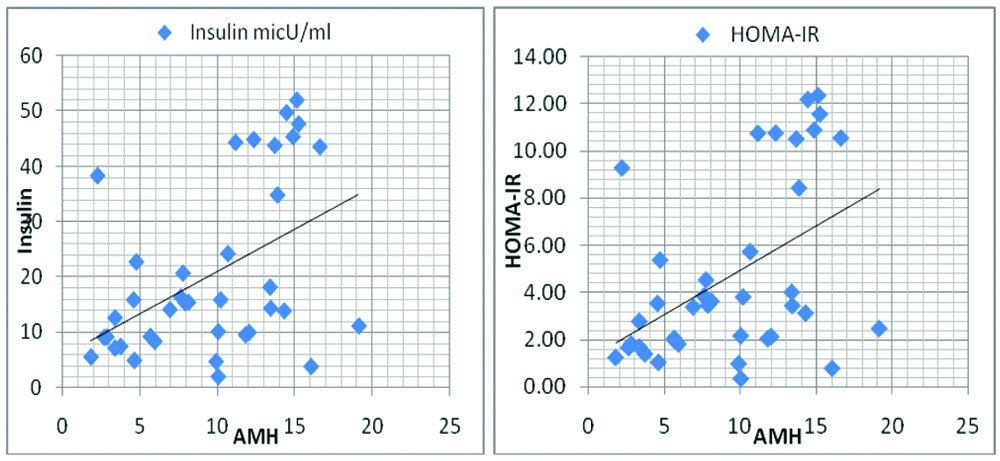
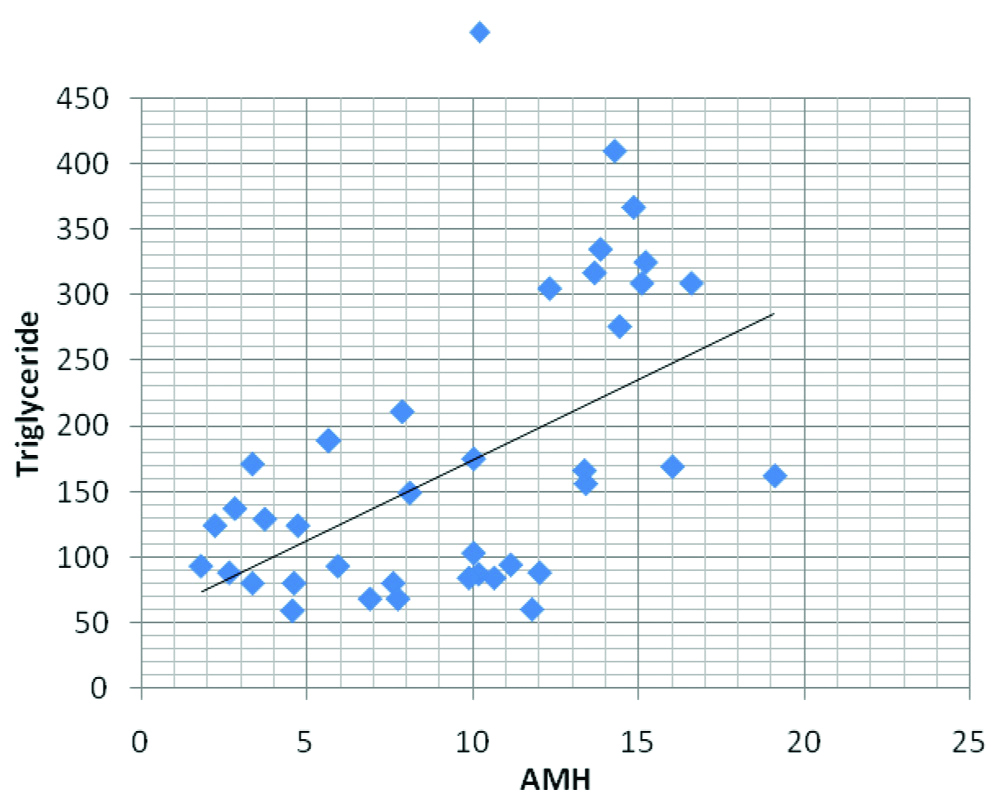
AMH was then correlated with other parameters and there was a significant positive correlation between AMH and Fasting insulin, HOMA-IR and Triglycerides in PCOS group (p-value 0.003, 0.002 and <0.001, respectively) [Table/Fig-4,5 and 6], but the correlation between AMH and fasting plasma glucose was not statistically significant (0.059).
Correlation of AMH with parameters-BMI, lipids, insulin and HOMA-IR in PCOS and normally ovulating women.
| Parameters | Coefficient of correlation PCOS women | p-value | Coefficient of correlation in normally ovulating women | p-value1 |
|---|
| AMH, weight | 0.178 | 0.278 | -0.045 | 0.799 |
| AMH, BMI | 0.255 | 0.117 | -0.091 | 0.603 |
| AMH, fasting plasma glucose | 0.306 | 0.059 | 0.300 | 0.080 |
| AMH, triglyceride | 0.545 | <0.001 | -0.125 | 0.474 |
| AMH, insulin level | 0.470 | 0.003 | 0.078 | 0.656 |
| AMH, HOMA-IR | 0.474 | 0.002 | 0.078 | 0.654 |
1Spearman’s rho
Correlation of serum AMH level with Insulin and HOMA-IR.
Correlation of serum AMH level with Triglyceride level in women having PCOS.
Discussion
Polycystic ovarian syndrome is the most frequent endocrine disorder of women in the reproductive age group.
The mean age of the women was 23.28±4.8 years in PCOS group and 24.09±4.4 years in normally ovulating group in the present study. The women were of similar age in both the groups as the difference was not statistically significant Significantly high BMI was observed in PCOS women as compared to normally ovulating women but the correlation of AMH with BMI was not statistically significant in PCOS and in normally ovulating women Pigny P et al., Woo HY et al., Begawy AF et al., also found no correlation between serum AMH levels and BMI in PCOS women [15-17].
Mean serum AMH was 9.43±9.50 ng/mL in PCOS women and was 2.16±3.26 ng/mL in normally ovulating women with statistically significant difference (p-value <0.001). The LH levels were higher and FSH levels were lower in PCOS women compared to normally ovulating women in the present study Begawy AF et al., Pigny P et al., and Wiweko B et al., also found significantly elevated levels of LH (p-value 0.001, 0.0001, and 0.001) and lower amount of FSH in PCOS women in their study [17-19]. Androgens (Testosterone, DHEA-S) were also raised significantly in PCOS women compared to normally ovulating women in the present study. Woo HY et al., Begawy AF et al., and Pigny P et al., also found significant higher level of androgens in PCOS group compared to normal controls in their study (p-value 0.001, 0.001, and 0.0001, respectively) [16-18].
The fasting plasma glucose was high in PCOS women compared to ovulating women in the present study and the difference was statistically significant (p-value <0.001) but the fasting plasma glucose remained within normal range in both the groups. The mean fasting insulin and HOMA-IR was also significantly high in PCOS group as compared to normally ovulating women (p-value 0.009 and 0.005, respectively). Woo HY et al., Begawy AF et al., and Nardo LG et al., also found significantly raised Fasting Insulin and HOMA-IR levels in PCOS women [Table/Fig-7] [16,17,20]. Piouka A et al., also found higher proportion of insulin and HOMA-IR among PCOS women in their study though it was not statistically significant [8]. A substantial proportion of PCOS women are obese and exhibit insulin resistance and compensatory hyperinsulinemia. The increased insulin levels in some PCOS women can account for the hyperandrogenism, because insulin acts synergistically with LH to enhance androgen production by the cells.
Comparison of fasting insulin and HOMA-IR in PCOS and normally ovulating women with other studies.
| Studies | Fasting insulin in PCOS women | Fasting insulin in normally ovulating women | p-value | HOMA-IR in PCOS women | HOMA-IR in normally ovulating women | p-value |
| Woo HY et al., [16] | 91.3±76.4 | 68.1±18.8 | 0.009 | 3.34±3.51 | 2.2.±0.66 | 0.004 |
| Begawy AF et al., [17] | 8.1±4.3 mIU/L | 4.6±2.4 | 0.001 | - | - | - |
| Nardo LG et al., [20] | 8.4 (6.6-11.3) | 7.2 (5.7-9.9) | 0.037 | 1.08 (0.86-1.43) | 0.93 (0.75-1.26 | 0.033 |
| Piouka A et al., [8] | 8.8±5.3 | 6.9±3.5 | 0.093 | 2.1±1.6 | 1.6±0.9 | 0.093 |
| Present study | 20.11±30.96 | 11.64±18.08 | 0.009 | 4.72±7.58 | 2.50±4.02 | 0.005 |
There was a statistically significant positive correlation seen between AMH and insulin level in women having PCOS (p-value 0.003). Nardo LG et al., and Crisosto N et al., also statistically found positive correlation between the two [20,21]. However, Woo HY et al., and Begawy AF et al., did not found statistically significant [16,17].
Correlation between serum AMH levels and insulin levels [Table/Fig-8]. Increased level of AMH was associated with increased insulin production or increased production to cope up with the insulin resistance in PCOS population.
Correlation of AMH with insulin in PCOS and normally ovulating women.
| Studies | Correlation of AMH with insulin in PCOS women | p-value | Correlation of AMH with Insulin in normal ovulating women | p-value |
|---|
| Crisosto N et al., [21] | 0.530, | 0.007 | 0.561 | 0.008 |
| Nardo LG et al., [20] | 0.03 | 0.004 | 0.28 | 0.004 |
| Begawy AF et al., [17] | -0.062 | 0.723 | -0.179 | 0.607 |
| Woo HY et al., [16] | 0.070 | 0.517 | -0.069 | 0.621 |
| Present study | 0.470 | 0.003 | 0.078 | 0.656 |
In this study there was statistically significant positive correlation between AMH level and HOMA-IR (r=0.474, p-value 0.002) though causative factor could not be found. Skalba P et al., (r=0.62, p<0.001) and Wiweko B et al., (r=0.52, p<0.001) also found statistically significant positive correlation in their study [11,12], while Woo HY et al., and Nardol LG et al., did not find significant correlation between the AMH and HOMA-IR in PCOS women in their study (p-value 0.396 and 0.40, respectively) [16,20]. Park HT et al., concluded that an independent relationship exists between HOMA-IR and AMH in women without PCOS, which could be due to the effect of abnormal insulin action on AMH secretion by granulosa cells [22]. However, a negative correlation between AMH and HOMA-IR has been reported by Chen MJ et al., [13].
The mean Triglyceride level was significantly higher in PCOS women in the present study. Woo HY et al., and Paneri S et al., also found significantly raised triglyceride levels in PCOS women as shown in [Table/Fig-9] [16,23]. Dyslipidemia is the main cause behind increased cardiovascular risk in PCOS women later in life, so dietary changes and lifestyle modification would decrease the risk in PCOS women.
Comparison of triglyceride in PCOS and normally ovulating women with other studies.
| Studies | Triglycerides levels in PCOS women | Triglycerides levels in normally ovulating women | p-value |
|---|
| Woo HY et al., [16] | 0.10±0.51 mmol/L | 0.75±0.26 mmol/L | <0.001 |
| Paneri S et al., [23] | 89±20 mg/dL | 134±27 mg/dL | 0.001 |
| Present study | 167±198.4 mg/dL | 111.02±188.6 mg/dL | <0.001 |
In this study, the present authors found significant positive correlation between AMH and triglyceride level (p-value <0.001) and may conclude that raised AMH level also predicts cardiovascular risk in women with PCOS and maybe used for cardiovascular disease risk assessment in PCOS women.
Limitation
This study has some limitations as the causative relationship between AMH and insulin resistance could not be explored. The study was conducted in a single centre which might not be a representative of whole population. Also, most women in both the group were mostly from urban population, so clinical picture might differ from rural due to different lifestyle, physical activity and dietary habits.
Conclusion
Polycystic Ovarian Syndrome (PCOS) is associated with spectrum of metabolic abnormality like hyperandrogenism, insulin resistance, hyperlipidemia. Significantly increased weight and BMI in PCOS women as compared to normally ovulating women indicates increased risk of disease in overweight and obese women. The raised fasting serum insulin and HOMA-IR levels in PCOS women compared to normally ovulating women and positive correlation of AMH with insulin and HOMA-IR concludes insulin resistance and predisposition of PCOS women with raised AMH level for GDM and Type 2 DM. The increased triglyceride levels in PCOS and positive correlation of AMH with triglyceride in PCOS women compared to normally ovulating women concludes that increased AMH is associated with risk of hyperlipidemia and its complications like risk of cardiovascular diseases.
1Independent sample Mann-Whitney U Test
1Independent sample Mann-Whitney U Test
1Independent sample Mann-Whitney U Test
1Spearman’s rho