Introduction
Early recognition of atherosclerosis is important, considering the epidemic proportion of Cardiovascular Disease (CVD) across the world. Non invasive methods of estimation of central blood pressure and other parameters help in early recognition of atherosclerosis.
Aim
To measure the Central Haemodynamic Indices (CHIs) by a non-invasive brachial cuff based oscillometric method- Central Blood Pressure (CBP), Central Pulse Pressure (CPP), Pulse Pressure Amplification (PPA), Augmentation Index (AIx), Augmentation index @ 75, Reflection coefficient, Pulse Wave Velocity (PWV), Total Peripheral Resistance (TPR). To evaluate the Angiographic severity of patients by Syntax Score (SS) and correlate with the CHIs.
Materials and Methods
The present study was a hospital based observational study. A total of 120 patients presenting with symptoms suggestive of Coronary Artery Disease (CAD) with age >18 years and those willing to undergo conventional coronary angiography were included. Patients with cardiogenic shock, Chronic kidney disease (eGFR <30 mL/min), malignancy, hepatic dysfunction, pregnancy, and contraindications to angiography were excluded. All the patients underwent coronary angiography and the SS was calculated. Patients were grouped into low, intermediate and high SS based on the scores. The CHIs obtained were then compared among the groups of low, intermediate and high SS to identify the parameters which correlate with severity of CAD. Pearson correlation coefficient (r) for the correlation of the CHIs with SS and the Receiver Operating Characteristic (ROC) curve analysis with Area Under Curve (AUC) was done for the cut-off values to predict significant CAD.
Results
Males were predominant than females with ratio of 4:1. Most patients, 54 (45%) were between 51 and 60 years. Most of the patients were having dyslipidemia 70 (58.33%), followed by hypertension 58 (48.33%). High SS patients were found to be having diabetes (26 vs. 2 vs. 10), dyslipidemia (45 vs. 17 vs. 8), and increased BMI (27.16±2.55 vs. 22.65±2.12 vs. 21.80±1.73, p=0.001) compared with intermediate and low SS patients respectively. There was no significant difference between males and females, when the various CHIs measured by the oscillometric device were compared but were statistically significant when compared among the groups according to SS. The cut-off points for AP, AI, PWV in predicting the patients with CAD (SS >23) according to ROC curves are 9.5 mmHg, 23.7, 9.35 m/sec respectively.
Conclusion
CHIs assessed noninvasively have a significant role in the clinical evaluation and an incremental value in the risk stratification of the CAD patients.
Introduction
Atherosclerosis, a chronic disease with slow progression and delayed recognition can affect both large and medium arteries [1]. With increasing population awareness regarding the factors causing atherosclerosis, measures to prevent them and progression to disease is an important step in reducing the burden of CVD. Identification of high-risk individuals has been traditionally achieved using many global risk assessment algorithms [2]. Many of these algorithms predict only the 10-year risk which is relatively not useful in young individuals, obese persons, and those with metabolic syndrome. Proper individual risk assessment is yet an unmet need. Tools that can directly detect vascular disease at a subclinical stage rather relying on indirect risk prediction through these risk factors, are necessary.
Several non-invasive tools have been detected over the past three decades to identify preclinical atherosclerosis like Carotid Intima Medial Thickness (CIMT), brachial artery flow-mediated dilation, Coronary Artery Calcium (CAC) score, Pulse wave analysis, etc. [2,3]. Various CHIs such as Aortic pulsatility, PP, PPA, and AIx, have been proposed as novel predictors for CAD. Invasive assessment of these parameters have found to be significant in the prediction of arterial stiffness and CAD in general population [3].
Presently, simple validated non-invasive methods are available now for the estimation of CHIs with good validation. One such method is the brachial cuff based oscillometric device AGEDIO B900 Pulse Wave Analysis (PWA) system [Ingrid Prkacin, Gordana, Cavrin 2018]. The present study utilises the above non-invasive method to estimate the CHIs and correlate them with the SS. This device evaluates the interaction between the wave propagation/reflection phenomena in the arterial system with central haemodynamics, and helps in analysing the arterial pressure waves under various conditions [4].
Among the arterial stiff indices, there was inconsistent association of the Carotid-Femoral Pulse Wave Velocity (CFPWV) and AIx with angiographic CAD in patients with increased obesity and abnormal waist circumference [5]. The cut-off values for theses indices were not defined in young patients, despite majority having angiographic CAD [6]. The methods to define the severity of CAD was also not consistent in the previous studies [6-8].
Monitoring the arterial pulse and its interpretation plays an important role in the medical examination. The pulse wave changes in its shape and amplitude as a consequence of wave reflection and superimposition when traveling from the heart towards the periphery, resulting in increased systolic pressure and augmented Pulse Pressure (PP) in the periphery [5].
Arterial stiffness, a reduction in arterial distensibility has various molecular, cellular and genetic causes underlying the mechanism. The distensibility of the arteries is decreased if intra-luminal pressure is increased or when there is an increase in arterial stiffness due to aging or any pathological changes [6]. It has been suggested that central aortic pressures are more relevant to cardiovascular pathogenesis than peripheral pressures since it is the central aortic systolic pressure that determines the systolic load on the heart and the aortic PP that distends the large elastic arteries [7,8].
Aortic PWV, a marker of arterial stiffness was found to be a strong and independent predictor of CVD and has additive predictive value for risk estimation [6]. As per the European Society of Cardiology guidelines (2007) for the management of arterial hypertension, measurement of aortic PWV is considered the gold standard method for assessing aortic stiffness [7].
Non-invasive assessment of CBP can be done by measuring the peripheral pressures. The Generalised Transfer Function (GTF) method is one of the most classical methods, in which an aortic pressure wave is reconstructed [9].
The present study was aimed to measure these indices and have a standard measurement of severity of CAD by SS and compare the correlation between them.
Materials and Methods
The present study was a hospital based observational study conducted between June 2017 to October 2018 in the Department of Cardiology. One hundred and twenty consecutive patients presenting with symptoms suggestive of CAD with age >18 years and those willing to undergo conventional coronary angiography were included. Patients with cardiogenic shock, Chronic kidney disease (eGFR <30 mL/min), malignancy, hepatic dysfunction, pregnancy, and contraindications to angiography were excluded. Institutional ethical committee approved the study.
Informed consent has been taken from all the patients included in the study. Each patient underwent clinical examination, electrocardiography, 2D Echo and laboratory profile. All patients underwent coronary angiography and SS was calculated. The SS was calculated by a computer program consisting of sequential and interactive self-guided questions. The algorithm consists of 12 questions. After the assessment, based on the final score, patients were divided into low (0-22), intermediate (23-32) and high (≥33) SS [10]. The CHIs that includes CBP- Central Systolic Blood Pressure (CSBP), Central Diastolic Blood Pressure (CDBP), Central Pulse Pressure (CPP), PPA, PWV, AP, AIx corrected for heart rate at 75 bpm (AIx@HR75), Reflection Coefficient and Total peripheral resistance were measured. The CHIs obtained were then compared among the groups of low, intermediate and high SS to identify the parameters which correlate with severity of CAD.
Measurement of CHIs: PWA measurements were performed while subjects were in a quiet environment and after at least 10 min of rest in the supine position. PWA was assessed with AGEDIO B900 machine. The oscillometric wave obtained after applying brachial cuff with suprasystolic pressure resembles that of the blood pressure in the brachial artery proximal to the cuff with complete occlusion of the brachial artery under the cuff. A high fidelity pressure sensor was used which was connected to a conventional blood pressure cuff. The blood pressure is measured using an oscillometric method. The cuff pressure applied about 35 mmHg more than the measured systolic blood pressure and the pulse wave reflections are recorded by detecting the oscillations in the pressure [11].
Statistical Analysis
The statistical analysis SPSS software 21.0 version was used for all statistical calculations. Continuous variables were given as mean±standard deviation and medians (range); categorical variables were described as percentages. Continuous variables were compared with ANOVA for normally distributed variables. Pearson’s correlation test (r) was used to assess the correlation between the two parameters. An optimal cut-off value to predict the presence of moderate to severe CAD (SS ≥23) by CHIs were determined using ROC analysis and AUC values. Statistical significance was defined as p<0.05.
Results
Demographics and Baseline Characteristics
One hundred twenty patients were recruited in the study. The mean age of presentation was 56.98±10.43 years. Most common age of presentation was between 51 and 60 years (N=54, 45%) followed by 41-50 years (N=28, 23.3%). The age range was between 21 to 72 years. [Table/Fig-1] shows the baseline characteristics of the whole study group.
Baseline characteristics of the whole study group, N=120.
| Characteristics | Number, n (%) |
|---|
| Males, M | 96 (80) |
| Females, F | 24 (20) |
| Male: Female | 4:1 |
| Age |
| 21-30 years | 2 (1.6) |
| 31-40 years | 6 (5) |
| 41-50 years | 28 (23.3) |
| 51-60 years | 54 (45) |
| 61-70 years | 16 (13.3) |
| >70 years | 14 (11.67) |
| Risk factors |
| Hypertension, HTN | 58 (48.33) |
| Smoking | 44 (36.67) |
| Diabetes mellitus, DM | 38 (31.67) |
| Dyslipidemia | 70 (58.33) |
| Positive family history of CAD | 6 (5) |
| Syntax Score (SS) |
| Low | 34 (28.3) |
| Intermediate | 36 (30) |
| High | 50 (41.6) |
CAD: Coronary artery disease
Males were predominant than females with ratio of 4:1. Most of the patients were having dyslipidemia 70 (58.33%), followed by hypertension 58 (48.33%). Low SS was seen in 34 patients, intermediate in 36 patients and high SS in 50 patients [Table/Fig-1].
When the characteristics among the patients according to the SS were compared, high SS patients were found to be having diabetes (26 vs. 2 vs. 10), dyslipidemia (45 vs 17 vs 8), and increased BMI (27.16±2.55 vs. 22.65±2.12 vs. 21.80±1.73, p=0.001) compared to intermediate and low SS patients respectively [Table/Fig-2].
Patient Characteristics Based on SYNTAX score (SS).
| Patient characteristics | Syntax score, SS | p-value |
|---|
| High (50) | Intermediate (36) | Low (34) |
|---|
| Age (Mean±SD), yrs | 55.98±10.42 | 54.47±10.77 | 59.23±12.92 | 0.200 |
| Male | 35 | 30 | 31 | 0.049 |
| Family history of CAD | 3 | 0 | 3 | 0.218 |
| Smoking | 18 | 16 | 10 | 0.424 |
| Diabetes | 26 | 2 | 10 | 0.001 |
| Hypertension | 25 | 21 | 12 | 0.149 |
| Dyslipidemia | 45 | 17 | 8 | 0.001 |
| BMI (Mean±SD), kg/m2 | 27.16±2.55 | 22.65±2.12 | 21.80±1.73 | 0.001 |
SD: Standard deviation; CAD: Coronary artery disease; SS: Syntax score
Stratification of Study Patients According to SS
CHIs and their correlation with SS
There was no significant difference between males and females when compared the various CHIs measured by the oscillometric device [Table/Fig-3]. The same parameters were significant when compared among the groups according to SS [Table/Fig-4].
Comparison of CHIs between male and females.
| Variable | Male (N=96) Mean±SD | Female (N=24) Mean±SD | T test | p-value |
|---|
| CSBP, mmHg | 124.62±14.8 | 127.29±15.63 | 0.803 | 0.424 |
| CDBP, mmHg | 82.46±10.17 | 86.16±13.81 | 1.476 | 0.143 |
| PP | 42.19±7.07 | 41.12±6.40 | 0.676 | 0.500 |
| PPA, mmHg | 1.28±0.22 | 1.24±0.21 | 0.673 | 0.502 |
| AP, mmHg | 11.60±3.05 | 12.45±2.78 | 1.245 | 0.216 |
| AI, % | 27.83±7.41 | 30.71±7.86 | 1.682 | 0.095 |
| AI 75, % | 10.83±3.26 | 11.62±3.38 | 1.054 | 0.294 |
| PWV, m/sec | 9.88±2.01 | 10.24±2.00 | 0.782 | 0.435 |
| TPR, dynes/cm2 | 1746.26±285.05 | 1703.25±243.53 | 0.679 | 0.498 |
| RC | 59.96±9.57 | 61.83±9.70 | 0.851 | 0.397 |
CSBP: Central systolic blood pressure; CDBP: Central diastolic blood pressure; PP: Pulse pressure; PPA: Pulse pressure amplification; AP: Augmented pressure; AI: Augmentation index; AI: Augmentation index 75%; PWV: Pulse wave velocity, TPR: Total peripheral resistance; RC: Reflection coefficient
Comparison of CHIs among groups based on SS.
| CHI | Whole study group (N=120) | Syntax score | F | p-value |
|---|
| High (N=50) | Intermediate (N=36) | Low (N=34) |
|---|
| CSBP, mmHg | 125.15±14.53 | 127.96±16.14 | 125.55±12.15 | 120.61±13.58 | 2.67 | 0.073 |
| CDBP, mmHg | 83.20±11.03 | 83.96±12.87 | 83.69±8.27 | 81.58±10.78 | 0.51 | 0.600 |
| CPP, mmHg | 41.98±6.93 | 44.00±7.79 | 41.86±5.42 | 39.14±6.12 | 5.32 | 0.006 |
| PPA, mmHg | 1.27±0.23 | 1.20±0.20 | 1.31±0.22 | 1.32±0.23 | 3.84 | 0.024 |
| AP, mmHg | 11.77±3.01 | 13.96±2.12 | 12.03±2.10 | 8.29±1.27 | 89.26 | 0.0001 |
| AI, % | 28.40±7.56 | 32.74±7.67 | 28.94±4.98 | 21.47±3.75 | 35.858 | 0.0001 |
| AI 75, % | 10.99±3.29 | 12.42±3.47 | 10.14±2.39 | 9.79±3.13 | 9.29 | 0.0001 |
| TPR, dynes/cm2 | 1737.6±278.8 | 1717.38±284.02 | 1731.55±266.56 | 1773.94±281.36 | 0.43 | 0.651 |
CSBP: Central systolic blood pressure; CDBP: Central diastolic blood pressure, PP: Pulse pressure; PPA: Pulse pressure amplification; AP: Augmented pressure; AI: Augmentation index; AI: Augmentation index 75%; PWV: Pulse wave velocity; TPR: Total peripheral resistance
The correlation of the CHI variables with SS was assessed by the pearson correlation coefficient, and among the variables significant positive correlation with SS was seen with AIx (r=0.568, p=0.0001) and PWV (r=0.660, =0.0001) and negative correlation with PPA (r=-0.210, p=0.021) [Table/Fig-5].
Correlation of syntax score with the central haemodynamic indices.
| Correlated CHI variable | Pearson correlation coefficient (r) (N=120) | p-value |
|---|
| Central Systolic Blood Pressure (CSBP, mmHg) | 0.234 | 0.010 |
| Central Diastolic Blood Pressure (CDBP, mmHg) | 0.126 | 0.170 |
| Central Pulse Pressure (PP, mmHg) | 0.284 | 0.002 |
| Pulse Pressure Amplification (PPA, mmHg) | -0.210 | 0.021 |
| Augmentation Index (AIx) | 0.568 | 0.0001 |
| Augmentation Index corrected at 75 bpm (AI 75, %) | 0.332 | 0.0001 |
| Pulse wave velocity (PWV, m/sec) | 0.660 | 0.0001 |
| Total Peripheral Resistance (TPR, dynes/cm2) | -0.147 | 0.110 |
| Reflection Coefficient (RC) | -0.085 | 0.358 |
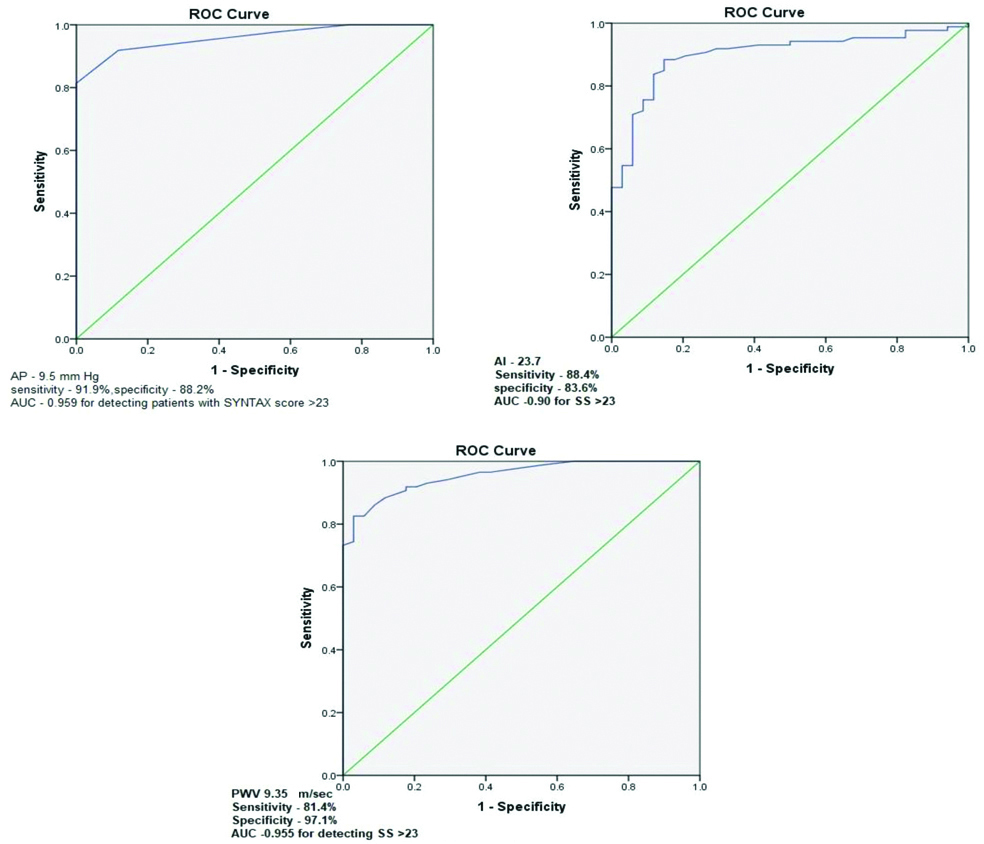
On ROC curve analysis for detection of significant CAD, Augmentation Pressure cut-off value was 9.5 mm Hg (AUC 0.959, sensitivity 91.9%, specificity 88.2%), Augmentation Index cut-off value was 23.7 (AUC 0.90, sensitivity 88.4%, specificity 83.6%) and pulse wave velocity was 9.35 m/sec (AUC 0.955, sensitivity 81.4%, specificity 97.1%) [Table/Fig-6].
Receiver Operating Characteristic (ROC) curves of Augmentation Pressure, Augmentation Index and Pulse wave velocity, AUC-Area under curve.
Discussion
The organs in the body are exposed to the aortic rather than brachial pressure, so assessment of the brachial blood pressure does not adequately risk stratify the patient compared to the central aortic pressure. It is more closely correlated with widely accepted surrogate measures of cardiovascular risk such as CIMT and LVM compared to the brachial pressure in cross-sectional studies. [8,9,11,12].
The present study have assessed the CHIs in patients with CAD and their correlation with SS. On analysis, males were predominant with most common age of presentation in between 51-60 years. Most common risk factor was dyslipidemia and hypertension. CAD severity by SS was high in 50 patients. When stratified according to SS, patients with high SS were having more risk factors compared to other groups. As the SS increased, there is increase in CSBP, CDBP, PP, Augmentation and decreased amplification with no change in TPR which is distinct compared to the previous studies.
The previous studies on CHIs were relatively underpowered regarding the significance of central pressure over the brachial values. CPP was found to be having independent predictor value on a meta analysis based on summary statistics rather than assessing the individual patient data (p=0.05) [8].
Comparison of the present study with previous studies is shown in [Table/Fig-7] [12,13].
Comparison of CHIs of previous studies with present study.
| Tanindi A et al., [13]N=145 | Strong heart study [12]N=3590 | Present studyN=120 |
|---|
| High SS | Low SS | With CVD | Without CVD | |
|---|
| CSBP, mmHg | 127±22 | 121±17 | High SS (50) –127.96±16.14Intermediate SS (36) -125.55±12.15Low SS (34) -120.61±13.58 |
| Male | 127.9±12.8 | 122.0±12 |
| Female | 127.7±12.7 | 122.9±9.4 |
| CDBP, mmHg | Not available | High SS (50)–83.96±12.87Intermediate SS (36)–83.69±8.27Low SS (34)–81.58±10.78 |
| Male | 86.6±9.9 | 85.5±9.4 |
| Female | 88.4±11.9 | 83.6±7.8 |
| CPP, mmHg | 48±18 | 41±13 | High SS (50)-44.0±7.79Intermediate SS (36)41.86±5.42Low SS (34)39.14±6.12 |
| Male | 40.8±4.8 | 41.4±6.4 |
| Female | 38.6±5.4 | 39.3±4.9 |
| AP, mmHg | Not available | High SS (50)13.96±2.12Intermediate SS (36)12.03±2.10Low SS (34) –8.29±1.27 |
| Male | 10.2±2.5 | 9.2±2.3 |
| Female | 10.1±1.9 | 8.2±1.7 |
| AIx, % | Not available | High SS (50)–32.74±7.67Intermediate SS (36)–28.94±4.98Low SS (34)–21.47±3.75 |
| Male | 21.9±2.6 | 27.1±0.9 |
| Female | 21.0±2.41 | 26.5±1.3 |
CSBP: Central systolic blood pressure; CDBP: Central diastolic blood pressure; CPP: Central pulse pressure; AP: Augmentation pressure; Aix: Augmentation index; CVD: Cardiovascular disease; SS: Syntax score
Nakagomi A et al., compared various CHI’s by Oscillometric method and identified CPP, FPP and PPA values to be significantly correlated with presence and severity of CAD by Gensini Score (mean CPP- 62.2 vs. 51.7 in patients with CAD and without CAD respectively) [3].
Increase in aortic stiffness markers such as aortic PWV and Alx act as potent indicators of survival in ESRD patients and the presence of CAD [13]. Covic A et al., studied 46 patients with ESRD who underwent coronary angiography [14]. The AIx correlated with the atherosclerotic burden score in the coronary angiogram. ROC analysis demonstrated an optimal AIx of 17% (sensitivity 0.87 and specificity 0.7). PWV of aorta compared to the extremity arteries was a significant predictor of mortality in hemodialysis patients [15].
Bechlioulis A et al., studied CHIs with applanation tonometry in 393 patients with suspected stable CAD who underwent angiography [16]. Increased PWV was associated with the presence of CAD. Mean PWV in the study was 9.1 m/s. The results of the Rotterdam Study indicated that aortic PWV predicted the occurrence of CAD and stroke [6].
Tautu O et al., studied arterial stiffness by the oscillometric method in young MI patients and identified PWV (mean of 9.1±1.77 m/s) correlated with the severity of CAD (p=0.003, r2-0.27) [17]. In the study done by Covic A et al., patients with normal angiograms had significantly less arterial stiffness compared with the 35 subjects with evidence of obstructive coronary disease at angiography. PWV showed a cut-off value of 8.35 m/sec on ROC curve analysis (sensitivity=0.77; specificity=0.60) [14].
Sharma KH et al., studied the impact of CAD on AIx as measured by CBP as a case-control study in 505 Asian Indians (308 CAD vs. 277 Controls) and concluded that parameters such as CSBP and AIx are effective predictors of CAD in Asian Indians [18].
Chirinos JA et al., studied whether aortic pressure augmentation predicts adverse cardiovascular events in patients with established CAD [19]. In the study, it was determined that Augmentation Pressure (AP) was a significant predictor of death. For every 10 mm Hg increase in AP, there was an 18% increase in the risk of death.
In the present study, positive significant correlation was seen with AIx, PWV and negative correlation with PPA. Cut-off value of AIx and PWV to diagnose a patient with significant CAD on ROC curve analysis are 23.7 (AUC 0.90, sensitivity 88.4% and specificity 83.6%) and 9.35 m/sec (AUC 0.955, sensitivity 81.4%, specificity 97.1%) respectively.
Limitation
As this was a small study further large scale studies are warranted to define the optimal values of CHIs for identifying patients with severe CAD in Indian population. Large number of patients to be assessed and followed-up with reference to change in the CHIs on management and symptom improvement.
Conclusion
Central Hemodynamic Indices (CHIs) assessed noninvasively had good correlation with severity of coronary lesion and were predictive of significant CAD. Their assessment can help in risk stratification of the CAD patients. Guidelines emphasising their assessment in evaluation of CAD patients is of high need and expected in the near future.
CSBP: Central systolic blood pressure; CDBP: Central diastolic blood pressure; CPP: Central pulse pressure; AP: Augmentation pressure; Aix: Augmentation index; CVD: Cardiovascular disease; SS: Syntax score
[1]. Prabhakaran D, Jeemon P, Roy A, Cardiovascular diseases in India: Current epidemiology and future directionsCirculation 2016 133(16):1605-20.10.1161/CIRCULATIONAHA.114.00872927142605 [Google Scholar] [CrossRef] [PubMed]
[2]. Ohnishi H, Saitoh S, Takagi S, Ohata JI, Isobe T, Kikuchi Y, Pulse wave velocity as an indicator of atherosclerosis in impaired fasting glucose: The Tano and Sobetsu studyDiabetes Care. American Diabetes Association 2003 26(2):437-40.10.2337/diacare.26.2.43712547876 [Google Scholar] [CrossRef] [PubMed]
[3]. Nakagomi A, Okada S, Shoji T, Comparison of central hemodynamic indices for predicting the presence and severity of coronary artery disease using a brachial cuff based oscillometric deviceJ Hypertens 2015 33(1):e3010.1097/01.hjh.0000467429.87677.d1 [Google Scholar] [CrossRef]
[4]. Liang F, Numerical validation of a supra systolic brachial cuff-based method for estimating aortic pressureBiomed Mater Eng 2014 24(1):1053-62. [Google Scholar]
[5]. Lacolley P, Challande P, Osborne-Pellegrin M, Regnault V, Genetics and pathophysiology of arterial stiffnessCardiovasc Res 2008 81(4):637-48.10.1093/cvr/cvn35319098299 [Google Scholar] [CrossRef] [PubMed]
[6]. Mattace-Raso FUS, Tischa , Van Der Cammen JM, Hofman A, Van Popele NM, Bos ML, Arterial stiffness and risk of coronary heart disease and stroke- The Rotterdam StudyCirculation 2006 113(5):657-63.10.1161/CIRCULATIONAHA.105.55523516461838 [Google Scholar] [CrossRef] [PubMed]
[7]. Ikonomidis I, Makavos G, Lekakis J, Arterial stiffness and coronary artery diseaseCurr Opin Cardiol 2015 30(4):110.1097/HCO.000000000000017926049393 [Google Scholar] [CrossRef] [PubMed]
[8]. Mansia G, De Backer G, Dominiczak A, Cifkova R, Fagard R, Germano G, 2007 ESH-ESC Guidelines for the management of arterial hypertensionBlood Press 2007 16(3):135-232.10.1080/0803705070146108417846925 [Google Scholar] [CrossRef] [PubMed]
[9]. Mc Eniery CM, Cockcroft JR, Roman MJ, Franklin SS, Wilkinson IB, Central blood pressure: Current evidence and clinical importanceEur Heart J 2014 35(26):1719-25.10.1093/eurheartj/eht56524459197 [Google Scholar] [CrossRef] [PubMed]
[10]. Sianos G, Morel MA, Kappetein AT, The SYNTAX score an angiographic tool grading the complexity of coronary artery diseaseEuro Interv 2005 1:219-27. [Google Scholar]
[11]. Shih YT, Cheng HM, Sung SH, Hu WC, Chen CH, Comparison of two generalized transfer functions for measuring central systolic blood pressure by an oscillometric blood pressure monitorJ Hum Hypertens 2013 27(3):204-10.10.1038/jhh.2012.1722551938 [Google Scholar] [CrossRef] [PubMed]
[12]. Roman MJ, Devereux RB, Kizer JR, Lee ET, Galloway JM, Ali T, Central pressure more strongly relates to vascular disease and outcome than does brachial pressure- The strong heart studyHypertension 2007 50:197-203.10.1161/HYPERTENSIONAHA.107.08907817485598 [Google Scholar] [CrossRef] [PubMed]
[13]. Tanindi A, Erkan AF, Alhan A, Tore HF, Central pulse pressure amplification is associated with more extensive and severe coronary artery diseaseScand Cardiovasc J 2014 48(3):167-75.10.3109/14017431.2014.89808324568590 [Google Scholar] [CrossRef] [PubMed]
[14]. Covic A, Haydar AA, Bhamra AP, Gusbeth TP, Goldsmith DJ, Aortic pulse wave velocity and arterial wave reflections predict the extent and severity of CAD in chronic kidney disease patientsJ Nephrol 2005 18(4):388-96. [Google Scholar]
[15]. Pannier B, Guerin AP, Marchais SJ, Safar ME, London GM, Stiffness of capacitive and conduit arteries: prognostic significance for end-stage renal disease patientsHypertension 2005 45:592-96.10.1161/01.HYP.0000159190.71253.c315753232 [Google Scholar] [CrossRef] [PubMed]
[16]. Bechlioulis A, VAkalis K, Naka KK, Bourantas CV, Papamichael ND, Kotsia A, Increased aortic pulse wave velocity is associated with the presence of angiographic coronary artery disease in overweight and obese patientsAm J Hypertens 2013 26(2):265-70.10.1093/ajh/hps03923382412 [Google Scholar] [CrossRef] [PubMed]
[17]. Tautu O, Chirila S, Dorabantu M, Young patients with Acute ST-elevation MI: How stiff are the arteries?J Hypertens 2015 33(1):e2910.1097/01.hjh.0000467425.34312.ce [Google Scholar] [CrossRef]
[18]. Sharma K H, Sharma N, Shah K, Patil S, Impact of coronary artery disease on augmentation index as measured by estimated central blood pressure: A case-control study in Asian IndiansIndian Heart J 2018 70(5):615-21.10.1016/j.ihj.2017.12.00130392497 [Google Scholar] [CrossRef] [PubMed]
[19]. Chirinos JA, Zambrano JP, Chakko S, Veerani A, Schob A, Willens HJ, Perez G, Mendez AJ, Aortic pressure augmentation predicts adverse cardiovascular events in patients with established coronary artery diseaseHypertension 2005 45(5):980-85.10.1161/01.HYP.0000165025.16381.4415837821 [Google Scholar] [CrossRef] [PubMed]