Essential hypertension is characterised by persistent high pressures on the walls of the arteries and is one of the leading causes of mortality and morbidity in India [1]. High prevalence of hypertension among north Indians warrants more detailed study of the disease [1,2]. Various medical guidelines have been issued for defining and classifying hypertension. Many studies done in India have followed Joint National Committee (JNC) guidelines for classifying hypertension [3-5]. Recently, American College of Cardiology/American Heart Association (ACC/AHA) has revised the guidelines for classification of hypertension in November 2017 [6]. However, these two classifications differ a lot in defining various stages of hypertension [Table/Fig-1] which will change the prevalence of the disease.
Obesity is one of the important risk factor for hypertension which is commonly assessed by calculating Body Mass Index (BMI) [7]. Nevertheless, other anthropometric parameters apart from BMI have gained importance in unhealthy obese [8]. While studies done in other countries do consider some anthropometric parameters important over others in hypertension, the scenario in India needs to be evaluated & improved. Yalcin BM et al., reported Waist Circumference (WC), a marker for android obesity, to be better marker associated with elevated blood pressure than BMI [9]. While, Hilal Y et al., suggests increasing age as well as WC to be important factors for screening elevated blood pressures [10]. In the study done in Saudi Arabia Waist to Height Ratio (WHtR) was found to be better predictor of elevated blood pressure and hypertension [11]. For individuals residing in India, central adiposity markers like WC were more important for predicting high Blood Pressure (BP) [12]. While another study done on Indian population states that WC and WHtR are better predictors [13]. Total skinfold thickness at triceps, biceps, subscapular and suprailiac was found to be associated with elevated blood pressure [14]. Yet the relationship between anthropometric parameters and blood pressure considering the two hypertension guidelines in urban Indian population is scarce. The primary objective of the present study was to study the relationship between two hypertension guidelines (viz., JNC 8 2014 and ACC/AHA 2017) and anthropometric parameters among urban young male adults. The second objective was to compare the prevalence of prehypertension and hypertension between two hypertension guidelines for urban young male adults in Moradabad.
Materials and Methods
Subjects
The study was approved in Institutional Ethical Meeting (CM/CRC/17/26A) and in accordance with the Code of Ethics of the World Medical Association (Declaration of Helsinki) [15]. Written informed consent was obtained from all subjects. This cross-sectional observational study was done in 2018 and data was collected over the duration of 6 months (February 2018 to July 2018). The inclusion criteria for this study were young male subject (18-25 years of age) who resided for atleast 5 years in Moradabad, Uttar Pradesh, India. Exclusion criteria were any history of diabetes or secondary causes of hypertension or subjects undergoing weight reduction program. Sample size was calculated using the formula Sample size (n)=Z2 * p(1-p)/d2 where, Z is statistic corresponding to level of confidence (1.96 for confidence interval of 95%), p is expected prevalence 13.06% based on national survey [16] and d is precision (0.04). Twenty subjects out of 470 recruited were excluded from the study because of history of diabetes and secondary causes of hypertension. Six subjects out of remaining 450 undergoing weight reduction program were also excluded from this study. Thus, total of 444 young male subjects were recruited in the study (more than the estimated sample size of 384).
Measurements
General anthropometric measurements (viz., weight, height, waist circumference, hip circumference) were recorded by using standard methodology [17]. BMI was calculated using quetelet formula in kg/m2. Subjects were classified according to the two BP classification [Table/Fig-1] [3,6]. Blood pressure was recorded in sitting posture by using mercury sphygmomanometer after 5 minutes of rest; an average of two reading was calculated. Measurements of Skinfold thickness at four sites Biceps (STB), Triceps (STT), Subscapular (STSS) and Suprailiac (STSI) regions were taken by using Harpenden calipers. The subjects were asked to stand in an erect posture with relaxed shoulders. A fold of skin was held between the thumb and index finger to grasp the skin along with subcutaneous adipose tissue. Jaws of Harpenden caliper were placed perpendicular to length of skin fold & two such measurements were taken and their mean value was calculated. The triceps skinfold thickness was measured over the triceps muscle at the midpoint (acromion process of scapula and olecranon process) of the posterior aspect of right upper arm. The skinfold thickness of biceps was measured at the midpoint of the anterior aspect of right upper arm circumference. For measuring sub scapular skinfold thickness a fold of skin was held between the thumb and fingers on right subscapular area so that the skin fold forms an angle of 45 degrees to the horizontal plane. The supra-iliac skin fold was measured in mid-axillary line immediately superior to iliac crest, so that the skin fold forms an angle of about 45 degree to the horizontal line. Body fat mass was calculated from skinfold thickness as shown below [18].
Fat mass=8.46+0.317 (weight)-15.161 (height)+9.536 (log of sum of 4 skinfold thickness)
Statistical Analysis
All data was stored as coded numbers to secure participant’s identity and prevent researcher’s bias. Data was visualised for distribution and categorised as parametric based on the normality test. Correlation studies were done using Pearson’s test. Comparison of various parameters between BP groups was done using ANOVA followed by post-hoc analysis with Tukey multiple comparison test. All statistical tests were done in Graph Pad Prism for Windows, Graph Pad Software, La Jolla California USA with significance level set to p<0.05.
Results
The data was collected from 444 male subjects who were living in urban areas in Moradabad for more than 5 years, with mean age 20.62±1.8 years. Summary of the parameters is depicted in [Table/Fig-2].
Summary of all the parameters across all subjects and in various BP categories.
| BP groups ↓ | Age (years) | WC (cm) | Weight (kg) | WHR | WHtR | STB (mm) | STT (mm) | STSS (mm) | STSI (mm) | BMI (kg/m2) | FM (kg) |
|---|
| All subjects (n=444) | 20.62±1.8 | 78.71±10.52 | 63.11±12.04 | 0.86±0.06 | 0.47±0.06 | 16.84±5.78 | 27.76±9.57 | 36.5±13.59 | 38.23±16.36 | 22.4±3.85 | 22.61±4.64 |
| JNC normal (n=239) | 20.5±1.6 | 74.66±7.98 | 58.74±8.92 | 0.85±0.05 | 0.45±0.04 | 16.45±5.71 | 25.25±7.91 | 35.45±13.92 | 34.09±14.12 | 21.16±2.88 | 21.14±3.6 |
| ACC/AHA Normal (n=239) | 20.89±1.94 | 83.68±11.05 | 68.18±13.26 | 0.85±0.06 | 0.49±0.06 | 16.72±5.34 | 30.1±10.63 | 37.13±13.25 | 44.01±17.69 | 23.54±4.21 | 24.12±5.13 |
| JNC prehypertension (n=147) | 20.62±2.2 | 81.02±11.06 | 67.14±13.57 | 0.86±0.06 | 0.49±0.07 | 17.63±5.49 | 30.48±9.2 | 37.8±12.53 | 39.43±15.57 | 24.33±4.7 | 24.38±5.25 |
| ACC/AHA prehypertension (n=44) | 19.25±1.28 | 93.88±7.95 | 75.5±5.13 | 0.92±0.06 | 0.56±0.07 | 25.75±9.89 | 42.63±8.84 | 48.63±11.2 | 48.38±22.9 | 26.31±3.19 | 27.69±3.02 |
| JNC Stage 1 (n=50) | 20.5±1.6 | 74.66±7.98 | 58.74±8.92 | 0.85±0.05 | 0.45±0.04 | 16.45±5.71 | 25.25±7.91 | 35.45±13.92 | 34.09±14.12 | 21.16±2.88 | 21.14±3.6 |
| ACC/AHA Stage 1 (n=103) | 20.89±1.92 | 81.55±9.11 | 67.23±11.53 | 0.87±0.05 | 0.48±0.05 | 15.91±4.67 | 27.66±9.97 | 34.48±10.28 | 40.19±16.72 | 23.32±3.34 | 23.61±4.22 |
| JNC Stage 2 (n=8) | 20.89±1.96 | 84.59±11.7 | 68.58±13.96 | 0.88±0.06 | 0.5±0.07 | 17.06±5.59 | 31.14±10.78 | 38.26±14.22 | 45.64±17.91 | 23.63±4.54 | 24.34±5.47 |
| ACC/AHA Stage 2 (n=58) | 20.43±2.14 | 82.79±11.53 | 68.29±13.03 | 0.87±0.06 | 0.5±0.07 | 18.75±6.77 | 32.16±10.01 | 39.29±12.83 | 40.66±16.81 | 24.6±4.55 | 24.83±5.11 |
n=444, WC: Waist circumference; BMI: Body mass index; WHR: Waist Hip Ratio; WHtR: Waist Height Ratio; STB: Skinfold thickness at biceps; STT: Skinfold thickness at triceps; STSS: Skinfold thickness at subscapular; STSI: Skinfold thickness at suprailiac; FM: Fat Mass
All anthropometric parameters Weight, WC, WHR, WHtR, STT, STSS, STSI, BMI and FM except STB had a significant positive correlation with SBP. Also, all anthropometric parameters Weight, WC, WHtR, STB, STT, STSS, STSI, BMI and FM except WHR had a significant positive correlation with DBP [Table/Fig-3].
Correlation analysis: Scatterplot between anthropometric parameters and SBP & DBP. Pearson coefficient and p value are shown at the bottom of each plot.
WC: Waist circumference; BMI: Body mass index; WHR: Waist hip ratio; WHtR: Waist height ratio; STB: Skinfold thickness at biceps; STT: Skinfold thickness at triceps; STSS: Skinfold thickness at subscapular; STSI: Skinfold thickness at suprailiac; FM: Fat mass

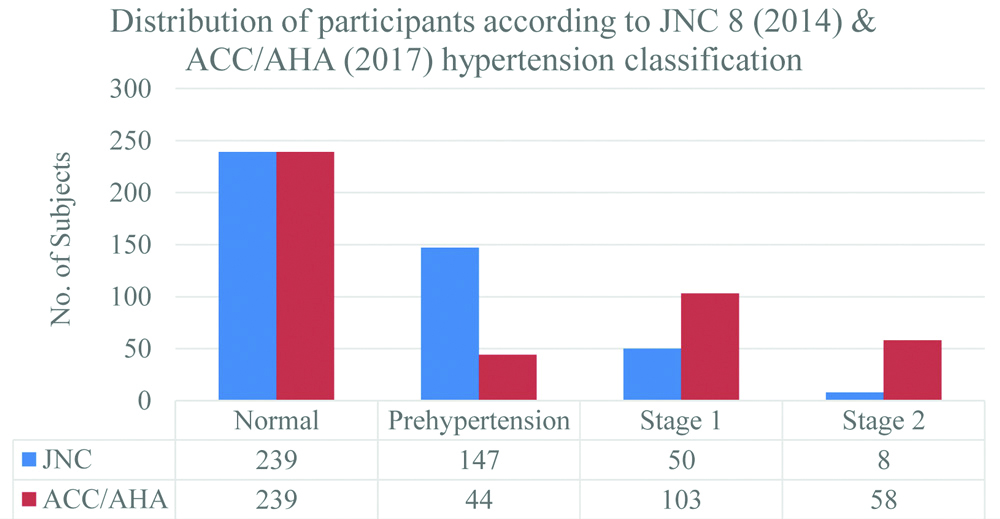
The prevalence of prehypertension and hypertension (stage 1 and stage 2) was 33.11% (n=147) and 13.06% (n=58) according to JNC 8 2014, respectively. While, it was 9.91% (n=44) and 36.26% (n=161) according to AHA/ACC 2017 guidelines, respectively [Table/Fig-4].
Distribution of subjects according to JNC 8 (2014) & ACC/AHA (2017) hypertension classification guidelines.
Comparing Prehypertensives, Hypertensives and Normal Subjects
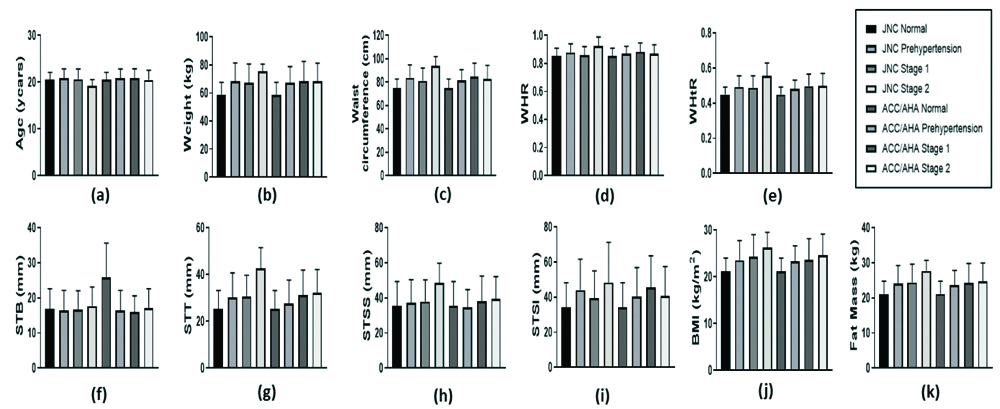
For both the classifications WC, Weight, WHtR, STT, Fat Mass and BMI were significantly higher in prehypertension, Stage 1 and Stage 2 hypertension as compared to normal subjects. Differences were seen in WHR that was significantly higher in JNC Stage 2 hypertensives, it was significantly higher in ACC/AHA Stage 1 hypertensives as compared to normotensives. Also, STB was significantly higher in JNC Stage 2; while, STSI was significantly higher in ACC/AHA Stage 1 as compared to normal subjects. Moreover, STT was higher only in JNC Prehypertension as compared to JNC Normal but not for ACC/AHA classification [Table/Fig-5,6].
Bar diagram depicting the anthropometric parameters in various BP groups according to the two BP classifications.
WC: Waist circumference; BMI: Body mass index; WHR: Waist Hip Ratio; WHtR: Waist Height Ratio; STB: Skinfold thickness at biceps; STT: Skinfold thickness at triceps; STSS: Skinfold thickness at subscapular; STSI: Skinfold thickness at suprailiac; FM: Fat mass
Post-hoc Tukey Multiple comparison test adjusted p values for various parameters.
| Tukey’s multiple comparisons test | Age (years) | WC (cm) | Weight (kg) | WHR | WHtR | STB (mm) | STT (mm) | STSS (mm) | STSI (mm) | BMI (kg/m2) | FM (kg) |
|---|
| JNC Normal vs. JNC prehypertension | 0.4365 | <0.0001 | <0.0001 | >0.9999 | <0.0001 | 0.9998 | <0.0001 | 0.9361 | 0.0560 | <0.0001 | <0.0001 |
| JNC Normal vs. JNC Stage 1 | 0.9999 | 0.0005 | <0.0001 | 0.9995 | 0.0001 | 0.8858 | 0.0057 | 0.9526 | 0.3594 | <0.0001 | <0.0001 |
| JNC Normal vs. JNC Stage 2 | 0.5228 | <0.0001 | 0.0007 | 0.0202 | <0.0001 | 0.0002 | <0.0001 | 0.1204 | 0.1832 | 0.002 | 0.0008 |
| JNC prehypertension vs. JNC Stage 1 | 0.9839 | 0.6822 | 0.9992 | 0.9958 | 0.9999 | 0.9775 | >0.9999 | >0.9999 | >0.9999 | 0.8822 | >0.9999 |
| JNC prehypertension vs. JNC Stage 2 | 0.1887 | 0.0641 | 0.6063 | 0.0163 | 0.0355 | 0.0004 | 0.0039 | 0.272 | 0.7250 | 0.4054 | 0.3207 |
| JNC Stage 1 vs. JNC Stage 2 | 0.4792 | 0.0097 | 0.4952 | 0.068 | 0.0313 | 0.0048 | 0.0112 | 0.4143 | 0.8096 | 0.8384 | 0.4842 |
| ACC/AHA Normal vs. ACC/AHA prehypertension | 0.897 | 0.0003 | <0.0001 | 0.7987 | 0.0077 | 0.9991 | 0.7421 | 0.9999 | 0.2569 | 0.0068 | 0.0131 |
| ACC/AHA Normal vs. ACC/AHA Stage 1 | 0.5866 | <0.0001 | <0.0001 | 0.0014 | <0.0001 | 0.9845 | <0.0001 | 0.6448 | <0.0001 | <0.0001 | <0.0001 |
| ACC/AHA Normal vs. ACC/AHA Stage 2 | >0.9999 | <0.0001 | <0.0001 | 0.7441 | <0.0001 | 0.1067 | <0.0001 | 0.5211 | 0.0817 | <0.0001 | <0.0001 |
| ACC/AHA prehypertension vs. ACC/AHA Stage 1 | >0.9999 | 0.6353 | 0.9975 | 0.9085 | 0.7491 | 0.9515 | 0.4014 | 0.7787 | 0.5341 | 0.9998 | 0.9831 |
| ACC/AHA prehypertension vs. ACC/AHA Stage 2 | 0.9101 | 0.998 | 0.9997 | >0.9999 | 0.8107 | 0.1995 | 0.2088 | 0.6331 | >0.9999 | 0.6388 | 0.857 |
| ACC/AHA Stage 1 vs. ACC/AHA Stage 2 | 0.769 | 0.9449 | >0.9999 | 0.8199 | >0.9999 | 0.6182 | 0.9974 | 0.9998 | 0.5312 | 0.7218 | 0.9974 |
| JNC Normal vs. ACC/AHA Normal | >0.9999 | >0.9999 | >0.9999 | >0.9999 | >0.9999 | >0.9999 | >0.9999 | >0.9999 | >0.9999 | >0.9999 | >0.9999 |
| JNC prehypertension vs. ACC/AHA prehypertension | >0.9999 | 0.8968 | 0.9997 | 0.9826 | 0.9385 | 0.9917 | 0.775 | 0.9479 | 0.8511 | >0.9999 | 0.9974 |
| JNC Stage 1 vs. ACC/AHA Stage 1 | 0.9875 | 0.366 | 0.9952 | 0.2952 | 0.9847 | 0.9991 | 0.9999 | >0.9999 | 0.2984 | 0.9504 | >0.9999 |
| JNC Stage 2 vs. ACC/AHA Stage 2 | 0.6576 | 0.0432 | 0.6713 | 0.1761 | 0.1014 | 0.0257 | 0.0481 | 0.6 | 0.8981 | 0.9154 | 0.6619 |
Comparing Stage 1, Stage 2 Hypertensives and Prehypertensives
This was found that no significant difference exist between any anthropometric parameters between Stage 1 hypertension and Prehypertension for both the classifications. However, WHR, WHtR, STB and STT were significantly higher in JNC Stage 2 as compared to JNC Prehypertension. Though, no significant difference was seen in anthropometric parameters between ACC/AHA Stage 2 as compared to ACC/AHA Prehypertension. Comparing the two hypertension JNC stages, it was found that WC, WHtR, STB and STT were significantly higher in JNC Stage 2 as compared to JNC Stage 1. However, anthropometric parameters did not significantly differ between ACC/AHA stage 1 and ACC/AHA Stage 2 [Table/Fig-5,6].
Group wise Comparison between the two BP Classifications
Comparison of anthropometric parameters between the two classifications revealed no significant difference between the anthropometric parameters when we compared JNC Prehypertension with ACC/AHA prehypertension. Moreover, anthropometric parameters were not significantly different between JNC stage 1 and ACC/AHA Stage 1. But WC, STB and STT were significantly higher in JNC Stage 2 as compared to AHA Stage 2 [Table/Fig-5,6].
Discussion
The present study was conducted to compare anthropometric parameters among the two BP classifications viz., JNC 2014 & AHA/ACC 2017 in urban young male adults. Most of the anthropometric parameters has a significant positive correlations with SBP and DBP. Similar results have been obtained by Deshmukh PR et al., and Vikram NK et al., in Indian population [13,19]. Among the anthropometric parameters weight and WC had the strongest correlation with SBP while, weight and BMI had the strongest correlation with DBP. Indeed, other studies also reported that both WC and BMI to be strong predictor of hypertension in Indian population [20,21]. Moreover, BMI and WC are independent markers of body adiposity [22].
Similarities between the Two BP Classifications while Comparing Anthropometric Parameters
Both the classification were similar while comparing anthropometric parameters like weight, WC, WHtR, FM and BMI that were more in cases (prehypertensive and Stage 1 and Stage 2 hypertensives) as compared to normotensive. Thus, findings of this study are supported by other studies that found higher WC, weight, WHtR, Fat mass and BMI in prehypertension and hypertension [23-27]. WC is a reliable measure of total abdominal fat (intra-abdominal fat and subcutaneous abdominal fat) [28,29]; while, STSI and STSS both are measures of central subcutaneous fat [30]. Since, STSI and STSS were not significantly different in prehypertension or Stage 2 as compared to Normal for both the classifications. It may be the intra-abdominal fat that is more in cases (prehypertensive and stage 2) as compared to normotensive. Indeed, WC is a strong predictor of intra-abdominal fat [28]. Moreover, more fat mass seen in cases for both the classifications. Similar finding have been reported by Dua S et al., [31]. The increased body fat releases leptin and other adipokines in the system which over activate the sympathetic and renin angiotensin system leading to hypertension. Thus, reduction of BMI and WC (especially the visceral fat content) by increasing awareness and necessary lifestyle changes need to be started even in young adults.
Differences between the Two BP Classifications while Comparing Anthropometric Parameters
However, difference was seen in WHR that was more in Stage 2 hypertension for JNC 8 2014 classification and Stage 1 for AHA/ACC classification as compared to normotensive. Thus, JNC 8 2014 classifies higher stages with more WHR as compared to AHA/ACC 2017. Nevertheless, studies show that increased WHtR have more association in hypertension as compared to WHR [32]. Though STSS was not significantly different in Stage 1 as compared to Normal for both the classifications, STSI was significantly higher in Stage 1 as compared to Normal only for ACC/AHA 2017 classification. Thus, ACC/AHA 2017 that classifies more hypertensives than JNC 8 2014 has more abdominal subcutaneous fat in Stage 1 hypertension than normal subjects. However, since similar findings are not seen in ACC/AHA Stage 2, it is difficult to generalise these finding for all hypertensives. In JNC 8 2014 classification STB, a marker of peripheral obesity, was more only in Stage 2 as compared to normal subjects. While increased STT, another marker of peripheral obesity, was seen from the prehypertensives to both the hypertension stages for the JNC 2014 classification. However, only STT was more in Stage 1 and Stage 2 hypertensives for ACC/AHA 2017 classification. Thus, ACC/AHA 2017 may miss higher hypertension grades that have increased peripheral obesity at the biceps. Also, JNC 8 may grade prehypertensives with higher peripheral obesity. Also, JNC Stage 2 has higher WC, STB and STT as compared to Stage 2 ACC/AHA 2017. Since increased obesity increases the rate of mortality and morbidity [33]. Indeed, there exist an intricate relationship between obesity and hypertension which may be understood by using newer neural network models that classify obesity-hypertension based on anthropometric parameters [34]. Such classification will help in identifying key lifestyle changes required to reduce hypertension prevalence.
Prevalence of Hypertension according to the Two BP Classifications
In this study, the prevalence for hypertension according to JNC 8 2014 was 13.06% which is close to the prevalence of 14.4% in urban males (for all Uttar Pradesh State) and 12.5% in urban males (Moradabad) according to National Family Health Survey-4 (2015-16) [16]. However, the prevalence according to new ACC/AHA 2017 classification is much higher 36.26% than National Family Health Survey-4 (2015-16). The prevalence for prehypertension in this study according to JNC 8 2014 was 33.11% which is slightly more than the previous prevalence of 26.7% reported by Singh RB et al., in Moradabad [35]. Thus, there may be rising trend in prehypertension cases in 2019 as compared to 2011 in urban areas of Moradabad. However, according to the new ACC/AHA 2017 classification prehypertension prevalence is 9.91% much less than reported by Singh RB et al., [35]. Indeed, Gupta R et al., mentioned that this new classification will increase the prevalence of hypertension in India as many prehypertension cases are classified as hypertensives according to ACC/AHA 2017 [36].
Limitation
Body fat mass in this study was estimated from skinfold thickness. However, this method fails to count for the visceral fat or mesentery fat content. Though calculated fat mass had significant positive relationship with blood pressure, direct measurement of visceral fat percentage may provide additional information.
Conclusion
Considering new ACC/AHA 2017 classification increases the prevalence of hypertension and decreases the prevalence of prehypertension in young urban males of Moradabad. Higher weight, waist circumference, waist height ratio, fat mass and body mass index are seen prehypertension & hypertension as compared to healthy subjects in both JNC 8 2014 and ACC/AHA 2017 classifications. Yet, JNC Stage 2 hypertension has higher waist circumference and skinfold thickness at biceps & triceps as compared to ACC/AHA Stage 2. Moreover, JNC 8 classifies prehypertensives with higher peripheral obesity as compared to ACC/AHA 2017. While, ACC/AHA 2017 misses higher hypertension grades that have increased peripheral obesity at the biceps as compared to JNC 8 2014.
n=444, WC: Waist circumference; BMI: Body mass index; WHR: Waist Hip Ratio; WHtR: Waist Height Ratio; STB: Skinfold thickness at biceps; STT: Skinfold thickness at triceps; STSS: Skinfold thickness at subscapular; STSI: Skinfold thickness at suprailiac; FM: Fat Mass