India has a good demographic profile being 65% of population under the age of 35 years [1]. As defined by national youth policy “youth” is aged between 15 to 29 years. These are the most important years in one’s life as a student, as an early working life and other life changing event occurs during this life period. But 36.9% of total Indian population is reported to be physically inactive which is the fourth leading cause of Non-Communicable Disorders (NCD’s) [2,3]. NCD’s are preventable but the recent literature about prevalence of NCD’s in India says that it contributes to more than two-third of the total deaths due to NCDs in the South-East Asia Region (SEAR) of WHO (2017). According to United Nations Statistics Division 60% of deaths in India are due to NCD’s [4]. There are various risk factors which are involved with NCD e.g., unhealthy diet, physical inactivity, alcohol and tobacco use [5].
Physical activity is defined as “any bodily movement produced by skeletal muscles that result in energy expenditure” [6]. According to WHO guidelines for physical activity adults between the age of 18 to 64 years must do 150 minutes of moderate or 75 minutes of vigorous physical activity per week. Further individual should do strength training on 2 or more days in a week [7]. Though the relevance of physical activity in achieving better health is well documented and well known [8]. Still report on physical activity in Indian children and youth suggest that Indian children and youth do not meet required levels of physical activity and there is need to further study the complete picture of active living in this population [9]. Hence, there is a need to know the gap between the knowledge of importance of physical activity and actually being physically active. One of the stress buffering hypothesis postulates that stress and physical activity are negatively related. Also, evidence suggests that high level of stress may poorly affect the quality of sleep [10]. Poor sleep quality, deprivation can also affect mood, self esteem and performance levels [11]. A report published in 2018 suggests that prevalence of stress among Indian college students is about 43.8% [12]. This high percentage of stress could have impact on quality of sleep and physical activity or vice versa.
Thus, the knowledge about barriers to being physically active can bridge this gap and can provide important information. Review of literature suggests that there is insufficient data on Indian populations about the barriers to physical activity faced by Indian youth. As the students and newly joined office workers represents the major portion of the Indian youth the aim of the present study was to find out self reported physical activity levels, to find out what are the perceived barriers to physical activity among the youth of Bangalore, India. Also, a secondary attempt will be made to find out the effect of physical activity levels on sleep quality of young adults.
Materials and Methods
Using quota sampling this observational survey was conducted from August 2018 to December 2018. Quota sampling is the commonly used method of non-probabilistic version of stratified sampling in survey studies. The study was approved by institutional ethical committee (EC-FAC/18/PHY/08). A total of 147 participants who were able to read and understand English, aged between 18-25 years from local colleges and offices were included. Participants from all BMI categories (under weight, normal weight, over weight and obese) were included. Participants who had clinically diagnosed of cardiovascular, musculoskeletal, psychological disorders or working on night duty were excluded. The purpose and procedure of the study was explained and then a signed consent form was obtained from all the participants. Demographic details (age and gender) of the participants were collected and assessment for BMI and waist-hip ratio was done. Self reported physical activity levels, perceived barriers to physical activity and sleep quality was measured by three appropriate and valid measures named International Physical Activity Questionnaire (IPAQ), Barrier to Being Physically Active Quiz (BBAQ) and Pittsburgh Sleep Quality Index (PSQI) [12-18]. The participants were instructed to give response to these scales by themselves; no further help was given.
Statistical Analysis
Data was recorded on the assessment sheets and data collection forms. Data was analysed by descriptive analysis and Pearson’s co-relation analysis between various barriers, physical activity and barriers, and sleep and physical activity was analysed via SPSS version 17.0 (SPSS Inc., Chicago, IL).
International Physical Activity Questionnaire (IPAQ)
Methods for physical activity measurement vary from electronic monitors such as accelerometer to surveys performed through questionnaires. The electronic models gives more objective information nevertheless, more costly, which restricts their use to epidemiological studies [13]. For the present study physical activity levels were measured using IPAQ as it is a valid and has reasonable measurement properties for measuring levels of physical activity among 18 to 65-year-old adults. The short IPAQ form “last 7 days recall” is recommended for national monitoring and the long form for research [14]. For the present study 7 item short form of IPAQ which classifies the participant’s activity levels as high, moderate or low was used. Participants were asked to give response to all the question items as per the IPAQ guidelines and scores were calculated by freely available excels for automatic calculation of data from IPAQ by Andrea Di Blasio and colleagues.
Barrier to Being Physically Active Quiz (BBAQ)
The BBAQ is a self reported scale that has 21 questions regarding people self perceptions about not being involved in physical activities. This scale focuses on internal as well as external perceived limitations or barriers for physical activity. Out of these seven barriers five are intrinsic barriers (lack of time, energy, willpower, skill, and fear of injury) and two extrinsic barriers (lack of resources and social influence). Each barrier subscale is scored using 3 questions (lack of time: Q 1, 8 and 15; social influence: Q 2, 9 and 16; lack of energy: Q 3, 10 and 17; lack of will power: Q 4, 11, and 18; fear of injury: Q 5, 12 and 19; lack of skill: Q 6, 13 and 20 and lack of resources: Q 7, 14 and 21). Each question is scored on a likert scale from 0 to 3 and thus maximum score for any barrier could be 9. Score of 5 or more in any of the seven categories would be recorded as “critical” barriers [15,16].
Pittsburgh Sleep Quality Index (PSQI)
The PSQI is a frequently used tool for checking sleep quality. It consists of 19 items grouped into seven clinically important domains of sleep related difficulties. Questions in the PSQI are concerned with sleep quality; time to fall asleep; duration; efficiency of sleep i.e., percentage of hours slept and hours in bed; any night time interruptions in sleep; use of sleep medication and any daytime dysfunction due to bad sleep. Each component is weighted equally on a 0-3 scale. By adding up the scores of seven components a global score of overall sleep quality is calculated. The score ranges from 0 to 21. Higher scores indicate worse sleep quality, score more than five is a validated cut-off value for bad sleep quality [17,18].
Results
The study was primarily conducted to find out the level of self reported levels of physical activity and to find out what are the perceived barriers to physical activity among the youth of Bangalore, India. The descriptive analysis of participants (young adults n=147) for gender and other demographic data (age, weight, height, BMI) was done [Table/Fig-1].
Descriptive analysis of respondents for age, weight, height, BMI and gender.
| S. No. | Characteristic | Mean±SD |
|---|
| 1. | Age (years) | 20.58±1.73 |
| 2. | Weight (kilograms) | 56.76±12.10 |
| 3. | Height (centimeter) | 162.69±9.97 |
| 4. | BMI (kg/m2) | 21.38±3.80 |
| 5. | Males | 54 |
| 6. | Females | 93 |
Self-Reported Physical Activity Level
Out of total of 147 respondents 29.9% reported themselves as highly physically active, 32% reported themselves as moderately active and 38.1% reported themselves as low physically active. Gender wise independent t-test analysis (t-value=4.018 at p<0.001) and cross tab analysis showed that females were less active than males [Table/Fig-2].
Descriptive cross tab analysis showing the gender based and overall percentage of physical activity.
| Physical activity categories by IPAQ | Self reported physical activity response frequencies |
|---|
| Male (n=54) | Female (n=93) | Total (n=147) | Total percentage |
|---|
| Low | 13 | 43 | 56 | 38.1 |
| Moderate | 14 | 33 | 47 | 32.0 |
| High | 27 | 17 | 44 | 29.9 |
Perceived Barriers of Physical Activity
Descriptive analysis of seven barriers to physical activity revealed the following facts frequencies and percentage: lack of will power 112 (76.2%), lack of energy 94 (63.9%), lack of resources 73 (49.6%), lack of time 72 (48.9%), social influence 38 (25.8%), lack of skill 23 (15.6%) and fear of injury 13 (8.4%) respondents. Lack of will power and lack of energy are the most critical barriers of physical activity reported by youth of Bangalore [Table/Fig-3].
Bar chart showing barriers of physical activity in males and females.
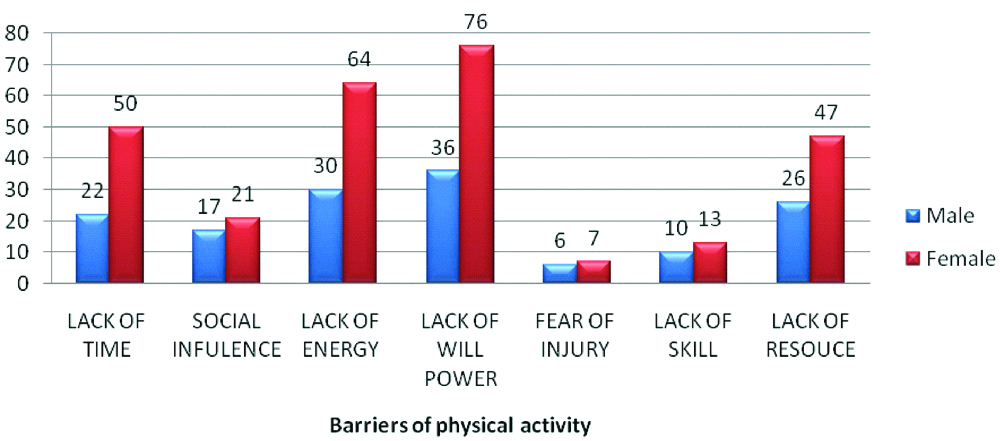
Cross tabulation analysis also showed that among Indian youth females perceived more barriers towards physical activities. Out of, 112 people who reported lack of will power as their barrier 76 were females; similarly out of 94 who reported lack of energy as their barrier 64 were females [Table/Fig-3].
Co-relational analysis among the seven barriers to physical activity showed that all the barriers of physical activity except fear of injury are significantly correlated with each other. Fear of injury is the least reported barrier and it showed significant correlation with lack of skill [Table/Fig-4].
Pearson’s correlation analysis among the seven barrier of physical activity.
| S. No. | Barriers of physical activity | Lack of time | Social influence | Lack of energy | Lack of will power | Fear of injury | Lack of skill | Lack of resources |
|---|
| 1. | Lack of time | 1 | 0.468** | 0.565** | 0.350** | 0.152 | 0.455** | 0.442** |
| 2. | Social influence | 0.468** | 1 | 0.351** | 0.291** | 0.347** | 0.473** | 0.360** |
| 3. | Lack of energy | 0.565** | 0.351** | 1 | 0.396** | 0.130 | 0.292** | 0.377** |
| 4. | Lack of will power | 0.350** | 0.291** | 0.396** | 1 | 0.000 | 0.264** | 0.214** |
| 5. | Fear of injury | 0.152 | 0.347** | 0.130 | <0.001 | 1 | 0.243** | 0.067 |
| 6. | Lack of skill | 0.455** | 0.473** | 0.292** | 0.264** | 0.243** | 1 | 0.469** |
| 7. | Lack of resources | 0.442** | 0.360** | 0.377** | 0.214** | 0.067 | 0.469** | 1 |
**Correlation is significant at the 0.01 level (2-tailed)
Impact of Physical Activity on Perceived Barriers
Correlation analysis of physical activity level {total Metabolic equivalent (MET) expenditure per week by IPAQ} showed significant relationship with lack of time, lack of energy, lack of will power and lack of resources [Table/Fig-5].
Pearson’s correlation analysis of physical activity and barrier of physical activity.
| Lack of time (r-value) | Social influence (r-value) | Lack of energy (r-value) | Lack of will power (r-value) | Fear of injury (r-value) | Lack of skill (r-value) | Lack of resources (r-value) |
|---|
| Total MET (IPAQ) | -0.262** | -0.154 | -0.246** | -0.208* | -0.004 | -0.105 | -0.198* |
*Correlation is significant at the 0.05 level (2-tailed); **Correlation is significant at the 0.01 level (2-tailed)
Quality of Sleep and Impact of Physical Activity on Sleep Quality
Descriptive analysis of component 2 of PSQI showed that mean hours of sleep for youth were 7.13±1.12. Further analysis of global score of PSQI showed that out of 147 respondents 66 (24 males and 42 females) fell into the category of bad sleepers [Table/Fig-6]. The pearson’s correlation analysis of global score of PSQI and physical activity level (total MET expenditure per week by IPAQ) showed no significant relationship (r=0.082, p=0.32).
Frequencies of good and bad sleepers among Indian youth.
| Category | Total frequency | Males | Females |
|---|
| Good sleepers | 81 | 30 | 51 |
| Bad sleepers | 66 | 24 | 42 |
Discussion
The study was conducted to find out the self perceived physical activity levels and barriers to physical activity in the youth population of Bangalore, India. Several other studies have been conducted about frequency and intensity of physical activity in India but most of the studies were primarily based on school children and adults [19]. Meanwhile, scientific literature needs to focus more on youth population as health of today’s youth will reflect the health of tomorrow’s society. The present study therefore considered the population aged between 18 to 25 years. Similar age group (18 to 22 years) of 259 medical students of both genders (M:F=116:143) was studied by Padmapriya K et al., [20]. In his study, he reported that only 15.4% of participants had low physical activity levels but the present study reported relatively higher percentage of low physical activity (38.1%) among the youth population [20]. This difference can be explained by changing behavioural habits of youth and rapidly changing nature of Indian society.
The finding of this study aligns with the previous study by Anjana RM et al., that the males succeeds in the parameter of physical activities and supports the argument of female being inferior in the level of activities undertaken [9].
Results of the present study reflects that external physical activity barriers were not critical for Indian youth where as internal barriers of physical activity like lack of will power and lack of energy were the most critical barrier reported by Indian youth population. Our findings are in alignment with few other research findings. Arango EF et al., reported the similar finding in his study on 25 to 50-year-old participants from Santa Rosa de Osos, 70% of the participants had lack of will power and for 46.2 % lack of time was the critical barrier for physical activity [21]. Rye JA et al., also reported that lack of will power is the most reported barrier towards physical activity in low income women of Virginia [22]. Alghafri T et al., conducted a study on 305 type 2 diabetes patients and reported that lack of will power (44.4%) along with lack of resources (30.5%) and lack of social support (29.2%) were the most frequently reported barriers [16]. But international literature available on perceived barrier doesn’t conclude consistently. Study conducted on perceived barriers to physical activity in females of Saudi Arabia reported that external barriers like lack of facilities and lack of encouragement are the main barriers to physical activity [23]. Owing to cultural believes, set up’s of societies, individual’s behaviour and their level of health awareness may cause difference in perceived barriers towards physical activities.
The results of the present study also revealed a very interesting fact that all the barriers expect fear to injury were significantly correlated with each other suggesting if an individual has one contributing barrier to their lower physical activity they will tend to develop other barriers too. The non-correlation of fear to injury with other barrier was due to the risk taking behaviour of the youth population. We also found that perceived barriers like lack of will power, lack of energy, lack of time and lack of resources were significantly negatively related to total expenditure of energy due to self reported physical activity. This suggests those individuals who spend more energy per week i.e., more physically active perceive less barriers to physical activity.
Secondary finding of this study revealed the fact that 44.9% of the youth is a bad sleeper. As the quality of sleep and stress is bi-directionally related, poor sleep quality will be related to higher stress and better sleep quality will provide lesser stress [11]. But in the present study we did not find a significant correlation between sleep quality and physical activity levels in youth population, possible reason for this non-significant result could be because that data collection for the present study was done soon after the participants returned to college and offices after their festive and post exam vacations. The quality of sleep was better during vacation after final examinations. Future researches could be done to study the effect of academic stress nearing examination on sleep pattern and physical activity levels in the youth population.
Limitation
There were several limitations in the present study. Sample size was reduced to 147 that were 60% of the actual targeted sample but still it is aligned with the previously published data. Male to female ratio was not equal for the study. Physical activity and barriers were measured through self reported data.
This research adds to the limited body of evidence regarding self reported physical activity levels and perceived barriers to physical activity among youth of Bangalore, India. The finding suggests both individual and communal efforts are required to improve physical activity level among youth especially females. We recommend that physical activity should be promoted through a combination of actions that focuses on internal as well as external barriers of physical activity. It includes sensitising youth, improving information strategies, providing cheaper and/or more flexible facilities, and including physical activity into the curriculum. If measures to improve physical activity levels and barriers are not taken then prevalence of physical inactivity may further increase and may adversely affect the Indian society. Future studies can be done on larger youth population.
Conclusion
The unique observation and outcome of this study suggests that 38% of youth population in Bangalore is reported to have low physical activity level. As most of the participants in the current study were related to health care and they are expected to advocate healthy life style to their clients it is absolutely necessary for them to practice physical activity on regular basis. Insufficient physical activity may have an impact on the quality of one’s own health. Female youth has lower physical activity levels as compared to young males. Lack of will power and lack of energy are the two most important internal barriers faced by the youth today. Our finding also suggested that individual who are physically active tends to face lesser barriers for being physically active. These results reflect us the crucial need for encouraging Indian youth to participate in more and more physical activities and distinctive encouragement for female students. It is integral to consider provisions of physical activity electives in the college curriculum.