Visual Evoked Potential: A Tool for Detection of Preretinopathy and Prognostication in Diabetes
G Krishnachandra Prasad1, Anjamparuthikal Aboobekar Haris2
1 Assistant Professor, Department of Physiology, Government Medical College, Kottayam, Kerala, India.
2 Associate Professor, Department of Neurology, Government Medical College, Kottayam, Kerala, India.
NAME, ADDRESS, E-MAIL ID OF THE CORRESPONDING AUTHOR: Dr. Anjamparuthikal Aboobekar Haris, Flat 8B, Clearway Colossal Vennala, Ernakulam, Kottayam-682028, Kerala, India.
E-mail: dr_aaharis@yahoo.com
Introduction
Diabetic Retinopathy (DR) is a common complication of Diabetes Mellitus (DM) that affects retinal blood vessels. It is the leading cause of blindness in the age group of 20 to 74 years despite the fact that visual loss due to DM may be preventable by glycaemic control. Unfortunately, in many cases, the patient is asymptomatic until it is too late for effective treatment. Diagnosis of retinal changes and determination of prognosis can be done by studying the pattern Visual Evoked Potential (VEP).
Aim
To investigate the ability of VEP in detecting preclinical neuro-degenerative changes in patients with diabetic preretinopathy by studying changes in VEP, in terms of P100 wave latency in diabetic patients without retinopathy.
Materials and Methods
This study included 35 diabetic patients without retinopathy and 35 non-diabetic controls. They were selected from patients attending the outpatient Department of Ophthalmology for the screening of DR. Controls were selected from the bystanders of the patients who came to the Ophthalmology outpatient department. VEP study was done in subjects and controls and the latency of P100 wave was analysed. P100 wave of VEP was chosen as it was the most reliable with less inter-subject variability. Mean P100 wave latency of both groups were compared and analysis was done checking for any variation in P100 wave latency with respect to the duration of diabetes and the control of diabetes. Data was analysed using SPSS-16. Student’s t-test was applied when two groups were compared while ANOVA (Analysis of Variance) test was applied for multiple group comparisons. The p-value <0.001 is considered significant in this study.
Results
There was a significant prolongation of P100 wave latency in diabetics without retinopathy. It was also found that there was positive correlation between prolongation of P100 wave latency and the duration of diabetes. In patients with good diabetic control the prolongation was less, as compared to those with poor diabetic control.
Conclusion
Analysis of P100 wave of VEP is helpful in the detection of diabetic preretinopathy changes. This could be a better tool for the detection of very early retinal changes before any clinical evidence of retinopathy has set in. Better glycaemic control by means of exercise, diet or change or increase in dose of medicines could prevent the early development of retinopathy if done at this stage.
Haemoglobin A1C, P 100 latency, Visual field
Introduction
The prevalence of DM in adults (>20 years of age) in India was 7.7% in 2016 with highest in Kerala, Tamil Nadu and Delhi. An estimated 438 million people will be affected by DM in the year 2030 in India [1]. DR is one of the leading disabilities caused by DM despite the fact that visual loss due to DM may be preventable by glycaemic control or photocoagulation [2-6].
Visual deficits in DM can affect the retina, optic nerve which results from vascular and metabolic complications of DM. A common complication of DM that affects retinal blood vessels is DR. Ganglion cell damage can be considered as a sign of preclinical DR. Damage in retinal ganglion cell in diabetics can be due to extracellular glutamate accumulation leading to functional and anatomical changes, which arise even before vascular damage. Unfortunately, in many cases the patient is asymptomatic until it is too late for effective treatment. Deterioration of retinal vasculopathy causes loss of blood vessel integrity with fluid leakage into the retina. The final outcome of all these is maculopathy which causes visual impairment and later blindness.
One of the primary goals of management in diabetic patients is to avoid the risk of DR [7]. But unfortunately, it is not possible clinically to detect early retinal changes as the neural retina of diabetic eyes undergoes subtle functional changes [8].
Here lies the importance of analysis in the pattern of VEP responses, which may provide early diagnosis of such diabetic changes and thereby also help to determine prognosis during treatment [9]. Pattern VEP (PVEP) can detect any defect from the optic nerve to the occipital cortex. Amplitude varies a lot hence latency is more reliable. Due to ganglionic cell damage, the latency values get prolonged with time. There have been reports from western countries showing alterations in VEP latencies in diabetic patients [8].
This study aimed to investigate the ability of VEP in detecting preclinical neurodegenerative changes in patients with diabetic preretinopathy. The secondary aim was to study correlation between changes in P100 latency and duration of diabetes and diabetic control.
Materials and Methods
This descriptive study was conducted in the outpatient Department of Ophthalmology and Department of Neurology of Government Medical College Kottayam, Kerala, India, from September 2015 to August 2016. The study was approved by the Scientific Review Committee and Institutional Ethics Committee (IRB no 73/2015).
Inclusion Criteria
DM patients attending the Outpatient Department of Ophthalmology, Government Medical College Kottayam for screening of DR, without any clinically evident retinopathy, who were willing for the study, were included as subjects. Age-matched controls were taken from the bystanders of the patients coming to the outpatient department.
Exclusion Criteria
Subjects with long standing history of hypertension, stroke cataract glaucoma optic atrophy were excluded.
Sample size was calculated by using the formula:
N=Z2 1- α/2 × S2/d2
N=sample size
Z=1.96 (for α error at 5%)
S=sample standard deviation (was 5.3% obtained from previous study) [1]
d=variability
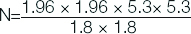
=33 (rounded off to 35 patients)
Thus, 35 cases and 35 age matched controls were included in the study. Procedure was explained to them and written informed consent was taken from each subject.
A brief history was taken and general examination was done. All cases were clinically examined for chronic complications of diabetes for exclusion. Patients with past history of cerebrovascular accidents were excluded. Nervous system examination was done in all patients. Resting blood pressure and pulse rate was also recorded.
Procedure
Ophthalmological examination of all subjects was carried out including visual acuity and fundus examination. VEP recording was done using the pattern reversal stimulation. Patients were advised to come without applying oil to the scalp. The skin was abraded and degreased. Monocular pattern reversal checker board pattern of frequency 1.8 Hz was used. The patient’s gaze was made to be fixed at the centre of the screen; distance between monitor and patient being 100 cm. Average 200 sweep stimuli were given to each eye to assess the visual function by P100 wave latency. Silver disc electrodes were placed at Grounding (FPZ), Active (OZ), Reference (FZ); that recorded the bioelectrical signals. These electrodes were placed according to the 10-20 international system of EEG electrode placement. Uniform illumination was maintained in the recording room. The electrode impedence was kept below 5 kΩ. The evoked potentials were averaged and analysed by Evoked Potential Recorder (EMG RMS MARK 2 machine). The peak P100 latencies were recorded.
Statistical Analysis
Data was coded and entered in Microsoft Excel and analysed using SPSS-16. Subjects were divided into four groups depending upon the duration of diabetes. Mean of P100 wave latencies were found out in the subjects and compared depending upon the duration of diabetes. Student’s t-test was applied when two groups were compared, while ANOVA (Analysis of Variance) test was applied for multiple group comparisons. The p-value <0.001 was considered significant in this study.
Results
The mean P100 latency of DM group was 120.38±15.99 msec and that of non-diabetic was 106.49±5.2 msec [Table/Fig-1]. This difference was found to be statistically significant with a T value of 6.909 at p-value of <0.001.
P100 wave latency in diabetic patients and control subjects.
| Group | N | Mean P100 (msec) | Std. deviation (msec) | Std. error mean |
|---|
| P100 | Diabetic | 35 | 120.38 | 15.99 | 1.91 |
| Non diabetic | 35 | 106.49 | 5.20 | 0.62 |
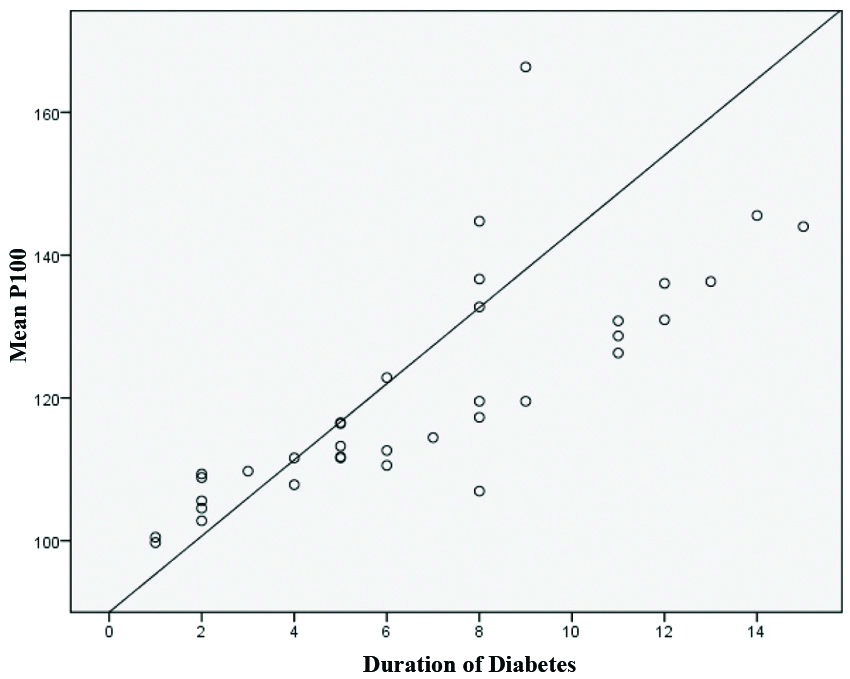
The mean P100 latency in patients with duration of diabetics upto 5 years was 108.68±5.56 msec. In patients with duration of diabetics in the range of 6-10 years, the mean P100 latency was 125.36±18.03 msec. Mean P100 latency in patients with duration 11-15 year diabetes was 134.83±9.05 msec [Table/Fig-2a]. On ANOVA the difference was found to be statistically significant with an F value 28.076 at p-value <0.001.
Analysis of mean P100 with varying duration of diabetes mellitus.
| Duration of DM | Mean P100 (msec) | N | Std. deviation (msec) |
|---|
| Upto 5 years | 108.68 | 15 | 5.56 |
| 6-10 years | 125.36 | 12 | 18.03 |
| 11-15 years | 134.83 | 8 | 9.05 |
A strong positive correlation was observed between the duration of DM and mean P100 latency which was statistically significant (r=0.791 p<0.001) [Table/Fig-2b]. Mean P 100 latency in individuals with different ranges of HbA1C is shown in [Table/Fig-3]. On ANOVA the difference was statistically significant with a F value of 59.894 at p-value <0.001.
Correlation between duration of diabetes and mean P100 wave latency.
Comparing HbA1c values with mean P100.
| HbA1c | Mean P100 (msec) | N | Std. deviation (msec) |
|---|
| Less than or equal to 6 | 105.92 | 8 | 5.36 |
| 6.1-7% | 114.66 | 15 | 7.26 |
| 7.1-8% | 129.81 | 7 | 7.03 |
| >8% | 147.46 | 5 | 15.41 |
Among diabetics mean P100 latency in the right eye was higher than non-diabetics which was significant with T value of 5.08 at p<0.001. In the left eye too, the mean P100 was higher among diabetics which was statistically significant with T value of 4.65 at p<0.001. The mean inter-eye latency among diabetics was 6.70±7.42 msec and in non-diabetics it was 3.008±2.99 msec; this was statistically significant with T value of 2.68 at p<0.001.
Discussion
In the present study, there were statistically significant correlation between prolongation of mean P100 latency in diabetics as opposed to controls and mean P100 latency and duration of diabetics. Mean P100 latency was significantly longer in poorly controlled diabetic group than with good control. Mean P100 latency was prolonged in those with Hb1AC >7%. Chopra D et al found prolonged P100 latency among diabetics and a significant correlation between the P100 latency delay and duration of illness [10]. Raman PG et al., had showed an increase in P100 latency with poor glycaemic control which was due to prolonged exposure to toxic glycaemic substances [11].
Marilyn ES et al., who studied the acute effects of blood glucose on VEP in people with diabetes; documented three mechanism by which tissue function was altered; which includes action of polyolpathway, myoinositol depletion and non-enzymatic protein glycosylation [12]. Parisi V et al., worked extensively on neural conduction in visual pathway, they explained that electrophysiological parameters did not correlate with blood glucose and Hb1AC were not influenced by three months of relatively stable metabolic control [13].
Similar to our study Martinelli V et al., showed statistically significant correlation between prolonged P100 latency and duration of diabetes [14]. Parisi V et al., observed that retinal and visual pathway function is differently impaired in diabetic patients with different duration of disease, having no signs of retinopathy [15]. Ghirlanda G et al., found that in diabetics with shorter duration of disease (3.8±3.5 years), early DM causes selective neurosensory deficits of the inner retinal layers, whereas the photoreceptors appear unaffected [9].
Limitation
Small sample size is the limitation of the present study and further work with larger sample size is required.
Conclusion
VEP assessment shows the involvement of visual pathway in people with diabetes before the development of retinopathy. In contrast to the ophthalmological studies, electrophysiological investigation especially VEP is a very sensitive method in monitoring the first phase of diabetes, particularly in determining the effects on visual function. Moreover, VEP is recommended as an early opportunity for proper management of this metabolic illness, which can lead to blindness.
Author Declaration:
Financial or Other Competing Interests: No
Was Ethics Committee Approval obtained for this study? Yes
Was informed consent obtained from the subjects involved in the study? Yes
For any images presented appropriate consent has been obtained from the subjects. NA
PLAGIARISM CHECKING METHODS: [Jain H et al.]
Plagiarism X-checker: Apr 15, 2019
Manual Googling: June 19, 2019
iThenticate Software: Sep 14, 2019 (18%)
[1]. Tandon N, Anjana RM, Mohan V, Kaur T, Afshin A, Ong K, The increasing burden of diabetes and variations among the state of India: The global burden of disease study 1990-2016The Lancet Global Health 2018 6(12):PE1352-62. [Google Scholar]
[2]. Fankhauser F, Enoch J, Cibis P, Receptor orientation in retinal pathology. A first studyAm J Ophthalmol 1961 52:767-83.10.1016/0002-9394(61)90901-1 [Google Scholar] [CrossRef]
[3]. Flynn HT, Smiddy WE, Diabetes and ocular disease: Past, present, and future therapiesOphthalmology monographs 14 2000 San FranciscoAmerican Academy of Ophthalmology [Google Scholar]
[4]. The Diabetes Control and Complications Trial Research Group The effect of intensive treatment of diabetes on the development and progression of long-term complications in insulin-dependent diabetes mellitusN Engl J Med 1993 329:977-86.10.1056/NEJM1993093032914018366922 [Google Scholar] [CrossRef] [PubMed]
[5]. Early Treatment Diabetic Retinopathy Study Research Group Early photocoagulation for diabetic retinopathy. ETDRS report number 9Ophthalmology 1991 98:766-85.10.1016/S0161-6420(13)38011-7 [Google Scholar] [CrossRef]
[6]. The Diabetic Retinopathy Study Research Group Photocoagulation treatment of proliferative diabetic retinopathy. Clinical application of Diabetic Retinopathy Study (DRS) findings, DRS report number 8Ophthalmology 1981 88:583-600.10.1016/S0161-6420(81)34978-1 [Google Scholar] [CrossRef]
[7]. Scanlon PH, Foy C, Chen FK, Visual acuity measurement and ocular co-morbidity in diabetic retinopathy screeningBr J Ophthalmol 2008 92:775-78.10.1136/bjo.2007.12856118356262 [Google Scholar] [CrossRef] [PubMed]
[8]. Lieth E, Gardner TW, Barber AJ, Antonetti DA, Retinal neurodegeneration: Early pathology in diabetesClin Experiment Ophthalmol 2000 28:03-08.10.1046/j.1442-9071.2000.00222.x [Google Scholar] [CrossRef]
[9]. Ghirlanda G, Di-Leo MAS, Caputo S, Falsini B, Porciatti V, Marietti G, Detection of inner retina dysfunction by steady-state focal electroretinogram pattern and flicker in early IDDMDiabetes 1991 9:1122-27.10.2337/diab.40.9.11221936619 [Google Scholar] [CrossRef] [PubMed]
[10]. Chopra D, Gupta M, Manchanda KC, A study of visual evoked potentials in patients of type2 diabetes mellitusJournal of Clinical and Diagnostic Reserch 2011 5(3):519-22. [Google Scholar]
[11]. Raman PG, Sodani K, George B, A study of visual evoked potential changes in diabetes mellitusInternational Journal of Diabetes in Developing Countries 1997 17:69-73. [Google Scholar]
[12]. Marilyn ES, Brad F, Eugene S, Michael C, Anthony JA, Acute effects of blood glucose on chromatic visually evoked potentials in persons with diabetes and in normal personsInvest Ophthalmol Vis Sci 1997 38:800-10. [Google Scholar]
[13]. Parisi V, Uccioli L, Parisi L, Colacino G, Manni G, Menzinger G, Neural conduction in visual pathways in newly diagnosed IDDM patientsElectroencephalogr Clin Neurophysiol 1998 108:490-96.10.1016/S0168-5597(98)00026-4 [Google Scholar] [CrossRef]
[14]. Martinelli V, Filippi M, Meschi F, Pozza G, Canal N, Comi GC, Electrophysiological study of optic pathways in insulin dependent diabetes mellitusClin Vision Sci 1991 6:437-43. [Google Scholar]
[15]. Parisi V, Uccioli L, Monticone G, Parisi L, Durola L, Pernini C, Visual evoked potentials after photostress in newly diagnosed insulin-dependent diabetes patientsGraefes Arch Clin Exp Ophthalmol 1995 233:601-04.10.1007/BF001852788529901 [Google Scholar] [CrossRef] [PubMed]