Osteoporosis is a disease of the bone that is characterised by decreased bone mass density and disorganised bone tissue microstructure. There are various predisposing factors which can lead to osteoporosis and it includes ageing, menopause, insufficient consumption of calcium, and decreased physical activity [1,2].
The decline in bone mass is accelerated with the onset of menopause and further the oral symptoms and the systemic manifestations of menopause are seen [3]. The hormonal changes that accompany menopause are the most important cause of decreased bone mass in women [4].
There are chances of fracture because of osteoporosis and it increases after menopause, and results in wrist fractures after the age of 50, vertebral fractures after the age of 60 and hip fractures after the age of 70 [5]. These are related with increased morbidity rates, increased medical cost and high mortality risk in the elderly [6].
Along with its effect on bone density, changes occurring at menopause have shown to affect the level of serum calcium. Menopause is associated with an increase in serum total calcium, a change thought to result from increased bone resorption. But studies have reported that serum total calcium declines with age within the pre and post-menopausal groups, thus establishing that menopause and age, affect serum total but not ionized calcium [7,8]. These findings may have future implications for research regarding the use of serum calcium levels as a risk indicator for skeletal osteoporosis in menopausal women.
There are various methods by which bone mineral density can be determined such as single or dual-photon absorptiometry, Quantitative CT (QCT), single or DXA and quantitative ultrasound. The consistency of DXA is high in determining persons with low BMD and is the gold standard for detecting osteoporosis [2]. However, it is very costly and not readily available; hence it cannot be routinely advised. Therefore, there was a need for alternative methods that can be used on a large scale to monitor the skeletal status and to detect early signs of osteoporosis. Recently, Quantitative ultrasound (QUS) methods have been introduced for the assessment of the skeletal status in osteoporosis. It is a small, portable ultrasound unit which exclusively measures bone density.
It is obvious; if other bones of the body are involved then jawbones are no exception. There is a study which has shown the association between changes in the mandibular cortical bone and the general BMD of the skeleton [9]. Panoramic radiographs are common diagnostic tools in dentistry today. Although these radiographs are made primarily for dental diagnosis, they may provide information regarding bone-related diseases like osteoporosis. Many mandibular indices such as MCI, Mandibular Cortical Thickness (MCT), MI and Panoramic mandibular index (PMI) may be assessed and correlated with the skeletal findings [9].
Thus, the present study was carried out to check the osteoporotic changes in jaw bones as seen on OPG and correlate them with the skeletal status as assessed by USG-calcaneus. The calcaneus bone was the site of choice due to the fact that it contains 75-90% cancellous bone. Cancellous bone is metabolically more active than cortical bone. Age and disease-related bone loss is more apparent at sites where there is high percentage of cancellous bone. Moreover, it is a highly stressed and weight bearing bone and very active in remodeling process that shows changes within the tissue earlier than compact bone. The little soft tissue covering around the calcaneus makes it an excellent site for measurement [3].
By recognising the disease in its early phase and referring the patient to a specialist, the dentist could help the patient greatly to avoid potential complications and to achieve a better quality of life. To our knowledge, this study is the first of its kind in which association of these factors has been done.
Materials and Methods
A hospital based cross-sectional study was carried out in Department of Oral Medicine and Radiology in the year 2014. A total number of 100 patients were selected. Patients were appraised of the purpose of the study and written consent was taken prior to commencement of the study. Ethical clearance was obtained from the Ethics Committee of the Institution (letter number IEC/VSPMDCRC/23/2012). The total duration of the study was one year.
Patients were distributed in two groups which were: Group I consisting of healthy premenopausal women and Group II comprised of healthy post-menopausal women.
Healthy female subjects that have attained menopause (12 months of amenorrhea) and healthy female subjects with regular menstrual cycle were included in this study.
Patients who were completely edentulous, those taking oestrogen, corticosteroids, or any other hormone replacement therapy, those on drugs that may alter calcium levels, those with history of any mandibular surgery and those with history of any underlying systemic condition, which may cause changes in the bone density were excluded from the study.
Clinical Examination
Thorough history and intraoral examination of the patients was done. Detailed menstrual history was also recorded. Drugs history pertaining to the drug that alter calcium levels or hormone replacement therapy was taken and all the data was filled up in a case history proforma.
USG-Calcaneus Estimation
Furuno CM-200 bone densitometer was used for estimation of bone density. CM-200 is a bone densitometer using ultrasound (QUS) to measure Speed of Sound (SoS) in the heel. Gel was applied to a stand-off and the patients’ left foot was positioned, after which the cylinder was aligned and the START key was pressed. Within 10 seconds, result was printed out from onboard printer and displayed on a LCD. The densitometer works on the principle of ultrasound pulse penetration, which measured the SoS and work at a frequency of 500 kHz with an ultrasound output of 1.8 mW/cm2.
Patients were classified in any one of the three groups based on their T-scores as follows:
T-score upto -1: Normal
T-score between -1.1 and -2.5: Osteopenia
T-score below -2.5: Osteoporosis [12].
The attenuation of sound waves is reduced when there is an increase in the number of attenuating elements, in this case the number of trabeculae in bone (Lewiecki EM et al., 2006; Link TM et al., 2003) [13,14]. Studies have demonstrated that the speed of sound is reduced and broadband ultrasound attenuation is decreased with reductions in bone density and trabecular number, correlating to a diagnosis of osteopenia or osteoporosis (Link TM et al., 2003) [14]. Hence, the speed of sound in m/sec for every patient was also noted.
Panoramic Radiographic Examination
Digital panoramic radiographs were made with the help of Kodak 8000C Digital Panoramic and Cephalometric System. All radiographs were made with the same exposure parameters of 12 mA, 70 kvp for 13.2 seconds, and a magnification error of x1.27. The radiographs were printed. For each of the panoramic radiographs, the right mental foramen was traced on acetylene tracing paper using a 4B pencil. Mandibular cortical thickness at the mental foramen was measured using the technique described by Ledgerton D et al., [10].
Mandibular Cortical Index (MCI) was determined by observing the inferior cortex distal to the mental foramen on both sides of the mandible, using the criteria described by Klemetti E et al., [11].
C1: The endosteal margin of the cortex sharp and even on both sides of the mandible.
C2: The endosteal margin with semilunar defects (resorption cavities) and cortical residues one to three layers thick on one or both sides.
C3: The endosteal margin appearing clearly porous with thick cortical residues.
Serum Calcium Estimation
About 2 mL of blood sample was taken from antecubital vein by venipuncture method and serum calcium was estimated.
Results
In Pre-menopausal group, maximum i.e., 30 (60%) patients were in the age group of 20-30 years, followed by 12 (24%) in the age range of 31-40 years. In Post-menopausal group, maximum i.e., 30 (60%) patients were in the age group of 51-60 years, followed by 15 (30%) in the age range of 41-50 years.
The age ranged from 20-70 years in the study. The maximum number of patients in the premenopausal group was seen in the range of 20-30 years. In a study, the highest peak of bone mass was seen in the age range of 20-30 years [3] and thus the maximum patients included in the premenopausal group ranged between 20-30 years, to facilitate better comparison between the two groups.
In Pre-menopausal group, 34 (68%) patients were normal, while 16 (32%) patients had Osteopenia/Osteoporosis. In Post-menopausal group, 7 (14%) patients were normal, while 43 (86%) patients had Osteopenia/Osteoporosis.
The mean USG (speed of sound) of patients in Pre-menopausal group was 1517.74±36.09, while in Post-menopausal group, the mean USG (speed of sound) was 1485.32±34.51 [Table/Fig-1].
Distribution of patients according to USG class in two groups.
| USG class | Pre-menopausal | Post-menopausal | p-value* |
|---|
| Number | % | Number | % |
|---|
| Normal | 34 | 68 | 7 | 14 | <0.0001 |
| Osteopenia/Osteoporosis | 16 | 32 | 43 | 86 |
| Total | 50 | 100 | 50 | 100 |
*Obtained using Chi-square test
In Pre-menopausal group, 4 (8%) patients had ≤3 cortical width (mental index), while 46 (92%) patients had >3. In Post-menopausal group, 19 (38%) patients had ≤3 cortical width (mental index), while 31 (62%) patients had >3 [Table/Fig-2].
Distribution of patients according to cortical width in two groups as measured on OPG.
| Cortical width (Mental index) | Pre-menopausal | Post-menopausal | p-value* |
|---|
| Number | % | Number | % |
|---|
| ≤3 | 4 | 8 | 19 | 38 | 0.0010 |
| >3 | 46 | 92 | 31 | 62 |
| Total | 50 | 100 | 50 | 100 | |
*Obtained using Chi-square test
In Normal USG class, the difference in the mean cortical width between pre (4.14±0.63) and post-menopausal (4.18±1.33) groups was statistically insignificant with p-value of 0.9371 (p>0.05). Also, in Osteopenia class, the difference of mean cortical width between pre (3.80±0.56) and post-menopause (3.42±0.75) was statistically insignificant with p-value of 0.057 (p>0.05) [Table/Fig-3].
Descriptive statistics for cortical width (mental index) as measured on OPG according to USG class in two groups.
| USG class | Cortical width (Mental index) | p-value* |
|---|
| Overall | Pre-menopausal | Post-menopausal |
|---|
| N | Mean | SD | N | Mean | SD | N | Mean | SD |
|---|
| Normal | 41 | 4.15 | 0.77 | 34 | 4.14 | 0.63 | 7 | 4.18 | 1.33 | 0.9371 |
| Osteopenia | 50 | 3.54 | 0.71 | 16 | 3.80 | 0.56 | 34 | 3.42 | 0.75 | 0.0575 |
| Osteoporosis | 9 | 2.58 | 0.78 | 0 | 0 | 0 | 9 | 2.58 | 0.78 | - |
| F-value* (p-value) | 18.68 (<0.0001) | | 7.062 (0.0021) | |
| Normal vs. osteopenia** | p=0.0006 | p=0.0609 | p=0.1887 | |
| Normal vs. osteoporosis** | p<0.0001 | - | p=0.0194 | |
*Obtained using one-way ANOVA in Overall and Post-menopausal group; **Using Tukey’s post-hoc test in Overall and Post-menopause group; †Using t-test for independent samples
In Normal USG class, 2 (50%) patients had cortical width ≤3 mm, while 32 (69.56%) patients had cortical width >3 mm. In Osteopenia/Osteoporosis USG class, 2 (50%) patients had cortical width ≤3 mm, while 14 (30.44%) patients had it >3 mm. The sensitivity of cortical width in pre-menopausal group as compared to USG class was 50.00% [Table/Fig-4a].
Distribution of patients according to USG class and cortical width (mental index) as measured on OPG, for premenopausal group.
| USG class | Cortical width (Mental index) | p-value* |
|---|
| ≤3 mm (n=4) | >3 mm (n=46) |
|---|
| Normal | 2 (50%) | 32 (69.56%) | 0.5843 |
| Osteopenia/Osteoporosis | 2 (50%) | 14 (30.44%) |
| Sensitivity (%) | 50.00 (8.30-91.70) |
| Specificity (%) | 69.57 (54.24-82.25) |
| Positive prediction value (%) | 12.50 (1.92-38.38) |
| Negative prediction value (%) | 94.12 (80.29-99.11) |
*Obtained using Chi-square test with simulated p-value
In Normal USG class, 1 (5.26%) patients had cortical width ≤3 mm, while 6 (19.35%) patients had cortical width >3 mm. In Osteopenia/Osteoporosis USG class, 18 (94.74%) patients had cortical width ≤3 mm, while 25 (80.65%) patients had it >3 mm. The sensitivity of cortical width in post-menopausal group when compared with USG class was 94.74% [Table/Fig-4b].
Distribution of patients according to USG class and cortical width (mental index) as measured on OPG, for post-menopausal group.
| USG class | Cortical width (Mental index) | p-value* |
|---|
| ≤3 mm (n=19) | >3 mm (n=31) |
|---|
| Normal | 1 (5.26%) | 6 (19.35%) | 0.2209 |
| Osteopenia/Osteoporosis | 18 (94.74%) | 25 (80.65%) |
| Sensitivity (%) | 94.74 (73.90-99.12) |
| Specificity (%) | 19.35 (7.50-37.48) |
| Positive prediction value (%) | 41.86 (27.02-57.87) |
| Negative prediction value (%) | 85.71 (42.23-97.63) |
*Obtained using Chi-square test with simulated p-value
In Pre-menopausal group, 45 (90%) patients belonged to C1 quality, while 5 (10%) patients belonged to C2 quality. In Post-menopausal group, 22 (44%) patients belonged to C1 cortical quality, while 21 (42%) patients belonged to C2 cortical quality and 7 (14%) patients belonged to C3 cortical quality [Table/Fig-5].
Distribution of patients according to cortical quality in two groups as seen on OPG.
| Cortical quality | Pre-menopausal | Post-menopausal | p-value* |
|---|
| Number | % | Number | % |
|---|
| C1 | 45 | 90 | 22 | 44 | 0.0005 |
| C2 | 5 | 10 | 21 | 42 |
| C3 | 0 | 0 | 7 | 14 |
| Total | 50 | 100 | 50 | 100 | |
*Obtained using Chi-square test
C1: Endosteal margin of cortex sharp and even on both sides; C2: endosteal margin with semilunar defects and cortical residues one to three layers thick on one or both sides. C3: endosteal margin appearing clearly porous with thick cortical residues
In Normal USG class, 37 (55.22%) patients belonged to C1 cortical quality, while 4 (15.38%) belonged to C2 quality. In Osteopenia class, 30 (44.78%) patients belonged to C1 cortical quality, while 19 (73.08%) belonged to C2 quality, and 1 (14%) belonged to C3 quality. In Osteoporosis class, 3 (11.54%) patients belonged to C2 cortical quality, 6 (86%) belonged to C3 quality [Table/Fig-6].
Distribution of patients according to USG class and cortical quality.
| USG class | Overall [No. (%)] | p-value* |
|---|
| C1 | C2 | C3 |
|---|
| Normal | 37 (55.22) | 4 (15.38) | 0 | 0.0005 |
| Osteopenia | 30 (44.78) | 19 (73.08) | 1 (14) |
| Osteoporosis | 0 | 3 (11.54) | 6 (86) |
| Total | 67 | 26 | 7 | |
*Obtained using Chi-square test with simulated p-value
C1: Endosteal margin of cortex sharp and even on both sides; C2: Endosteal margin with semilunar defects and cortical residues one to three layers thick on one or both sides; C3: Endosteal margin appearing clearly porous with thick cortical residues
Sensitivity, specificity, positive predictive value and negative predictive value of cortical quality (MCI) are shown in [Table/Fig-7].
Sensitivity, specificity, positive predictive value and negative predictive value of cortical quality (MCI).
| USG class | Overall {No.(%)} | p-value* |
|---|
| C1 (n=67) | C2/C3 (n=33) |
|---|
| Normal | 37 (55.22) | 4 (12.12) | <0.0001 |
| Osteopenia/Osteoporosis | 30 (44.78) | 29 (88.88) |
| Sensitivity (%) | 49.15 (35.89-62.50) |
| Specificity (%) | 90.24 (76.85-97.22) |
| Positive prediction value (%) | 87.88 (71.78-96.52) |
| Negative prediction value (%) | 55.22 (42.58-67.39) |
*Obtained using Chi-square test
C1: Endosteal margin of cortex sharp and even on both sides; C2: Endosteal margin with semilunar defects and cortical residues one to three layers thick on one or both sides; C3: Endosteal margin appearing clearly porous with thick cortical residues
In Normal USG class, 31 (68.89%) patients belonged to C1 cortical quality, while 3 (60%) patients belonged to C2/C3 cortical quality. In Osteopenia/Osteoporosis USG class, 14 (31.11%) patients belonged to C1 cortical quality, while 2 (40%) patients belonged to C2/C3 cortical quality. The sensitivity of cortical quality in pre-menopausal group when compared with USG class was 12.5% while specificity was 91.18% [Table/Fig-8].
Distribution of patients according to USG class and cortical quality for pre-menopausal group as measured on OPG.
| USG class | Pre-menopausal {No. (%)} | p-value* |
|---|
| C1 (n=45) | C2/C3 (n=5) |
|---|
| Normal | 31 (68.89) | 3 (60) | 0.99 |
| Osteopenia/Osteoporosis | 14 (31.11) | 2 (40) |
| Sensitivity (%) | 12.5 (1.92-38.38) |
| Specificity (%) | 91.18 (76.30-98.04) |
| Positive prediction value (%) | 40 (6.49-84.60) |
| Negative prediction value (%) | 68.89 (53.35-81.82) |
*Obtained using Chi-square test
C1: Endosteal margin of cortex sharp and even on both sides; C2: Endosteal margin with semilunar defects and cortical residues one to three layers thick on one or both sides; C3: Endosteal margin appearing clearly porous with thick cortical residues
In Normal USG class, 6 (27.27%) patients belonged to C1 cortical quality, while 1 (3.57%) patients belonged to C2/C3 quality. In Osteopenia/Osteoporosis USG class, 16 (72.73%) patients belonged to C1 cortical quality, while 27 (96.43%) patients belonged to C2/C3 quality. The sensitivity of cortical quality as compared to USG class was 62.79% while specificity was 85.71% [Table/Fig-9].
Distribution of patients according to USG class and cortical quality for post-menopausal group as measured on OPG.
| USG class | Post-menopausal {No. (%)} | p-value* |
|---|
| C1 (n=22) | C2/C3 (n=28) |
|---|
| Normal | 6 (27.27) | 1 (3.57) | 0.0345 |
| Osteopenia/Osteoporosis | 16 (72.73) | 27 (96.43) |
| Sensitivity (%) | 62.79 (46.73-77.02) |
| Specificity (%) | 85.71 (42.23-97.63) |
| Positive prediction value (%) | 96.43 (81.59-99.40) |
| Negative prediction value (%) | 27.27 (10.80-50.22) |
*Obtained using Fisher’s-exact test
C1: Endosteal margin of cortex sharp and even on both sides; C2: Endosteal margin with semilunar defects and cortical residues one to three layers thick on one or both sides; C3: Endosteal margin appearing clearly porous with thick cortical residues
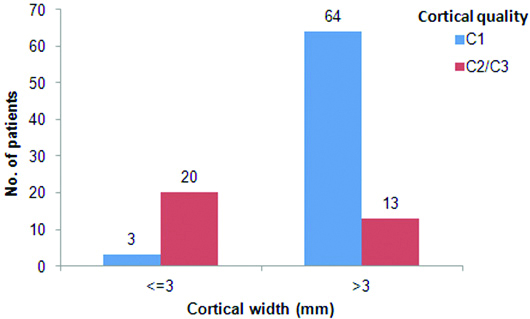
Amongst patients with MI ≤3, majority i.e., 20 (87%) had MCI category C2 or C3, while those with MI >3, there were 64 (83%) patients with MCI category C1. The association between MI and MCI was statistically significant with p-value <0.0001 [Table/Fig-10].
Bar chart showing distribution of patients as per MI and MCI, as assessed on OPG.
Descriptive statistics of serum calcium according to USG class in two groups is shown in [Table/Fig-11].
Descriptive statistics of serum calcium according to USG class in two groups.
| USG class | Serum calcium | p-value* |
|---|
| Overall | Pre-menopausal | Post-menopausal |
|---|
| N | Mean | SD | N | Mean | SD | N | Mean | SD |
|---|
| Normal | 41 | 8.94 | 0.80 | 34 | 9.00 | 0.78 | 7 | 8.63 | 0.87 | 0.3223 |
| Osteopenia | 50 | 8.95 | 0.66 | 16 | 8.72 | 0.67 | 34 | 9.06 | 0.64 | 0.1036 |
| Osteoporosis | 9 | 8.94 | 0.83 | 0 | 0 | 0 | 9 | 8.94 | 0.83 | - |
| F-value* (p-value) | 0.004 (0.996) | - | 1.077 (0.349) | |
| Normal vs. Osteopenia** | p=0.996 | p=0.2011 | p=0.3205 | |
| Normal vs. Osteoporosis** | p=0.999 | - | p=0.6636 | |
*Obtained using one-way ANOVA in Overall and Post-menopausal groups; **Using Tukey’s post-hoc test in Overall and Post-menopausal group; †Using t-test for independent samples
Discussion
QUS at the calcaneus is an attractive tool to detect osteoporosis because of its many advantages, one of them being that its results are comparable to DXA [15]. In a study conducted by Drozdzowska B et al., it was found that the BMD of the mandible as assessed by DXA correlated significantly with findings of calcaneal and phalyngeal QUS [16]. Boonen S et al., reported that the sensitivity for identifying women with osteoporosis was 68% for QUS and 87% for DXA, while specificity was 70% for QUS and 79% for DXA [15]. They concluded that QUS might be almost as effective as DXA in assessing post-menopausal osteoporosis. Similarly, Njeh CF et al., concluded that QUS can detect age and menopause-related influences on skeletal status and can discriminate healthy women from those with osteoporotic fractures in a manner comparable with that of BMD measurement by DXA [17,18]. With all these things in mind, QUS was selected for the present study.
Mental Index (MI)
Different authors have proposed cut-off values ranging from 3 mm to 4.5 mm for the MI to be indicative of osteoporotic changes. For the present study, a cut off value of 3 mm was considered for MI. In the present study, when distribution of patients according to cortical width i.e., MI, as assessed on OPG, was done, it was found that 38% of patients in the post-menopausal group had MI ≤3, whereas only 8% in the premenopausal group showed similar findings and this difference was statistically significant (p-value is 0.0010) [Table/Fig-2]. These findings are in agreement with a study by Mudda JA et al., who found that MI was related to menopausal status [19]. Mean values were higher for MI in premenopausal group. Dutra V et al., also found in their study that with advancing age in females, the values of MI decrease significantly and this is in agreement with the present study [20]. Taguchi A et al., also in their study, concluded that post-menopausal women have a thinner cortex and thereby increased risk of osteoporosis [21]. Thus, a thinner cortex could be a feature of menopause.
When the mean MI values, according to USG classes were analysed, it was found on overall analysis that the mean cortical width in normal patients was significantly higher than that in osteopenic and osteoporotic patients, irrespective of the menstrual status (p<0.0001). These results were in accordance to what was anticipated as per previous studies [2,7,21,22]. Women with normal skeletal status have higher cortical widths as compared to osteopenic or osteoporotic women. Thereby, it can be concluded that thinning of the mandibular cortex is age and hormone related, and that changes in the jaw bones correlate well with the skeletal status.
When the distribution of patients according to MI and USG class was analysed, it was found that 86.96% of patients classified as osteopenic/osteoporotic by USG, had MI ≤3, whereas 50.65% of patients had MI >3. Similarly, 49.35% classified as normal on USG had MI >3, whereas 13.04% of patients had MI ≤3. This difference was statistically significant. The sensitivity of MI in detecting osteopenia/osteoporosis was 89.96%, while specificity was 49.35% [Table/Fig-12].
Distribution of patients according to USG class and cortical width (mental index) as measured on OPG.
| USG class | Cortical width (Mental index) | p-value* |
|---|
| ≤3 (n=23) | >3 (n=77) |
|---|
| Normal | 3 (13.04) | 38 (49.35) | 0.0001 |
| Osteopenia/Osteoporosis | 20 (86.96) | 39 (50.65) |
| Sensitivity (%) | 86.96 (66.38-97.07) |
| Specificity (%) | 49.35 (37.76-60.99) |
| Positive prediction value (%) | 33.90 (22.09-47.39) |
| Negative prediction value (%) | 92.68 (80.05-98.38) |
*Obtained using Chi-square test
When all the similar parameters were analysed in the post-menopausal and premenopausal groups separately, it was found that sensitivity was lower in the premenopausal group (50%) than in post-menopausal group (94.74%) [Table/Fig-4a,b]. It was found that the sensitivity of MI increases once the menopausal status of the patient is known. Thus, whenever OPG radiographs are screened for osteoporotic changes, recording the menstrual history and correlating the radiographic findings with the medical history may provide better results.
The 3 mm threshold for the cortical width used in the present study gave a good overall sensitivity and a moderate specificity. Taguchi et al., proposed a cut-off value of 4.5 mm for the cortical width and got a sensitivity and specificity of 89.5% and 33.9% [6]. The sensitivity reported by these authors is almost similar to our findings, but the cut-off value for MI in the present study was 3 mm, comparison of this with the present study insinuated that the cut-off value does not seem to alter the sensitivity and specificity to a great extent. But it should be kept in mind that increasing the cut off value may lead to misdiagnosis of true positives as being false negatives. Devlin H et al., evaluated three radiomorphometric indices for the diagnosis of reduced skeletal bone density and suggested a threshold for MI of 3 mm (or less) [23]. The cut-off value of 3 mm for MI is supported by many authors [7,24,25] but other values for the cut-off have also been reported [6,26,27]. Due to the wide variability in the literature with regard to the cut off value of MI, further studies exploring this aspect are necessary to make a definite conclusion.
Mandibular Cortical Index (MCI)
Previous studies have shown that mean mandibular BMD assessed by DXA has a significant relationship with the MCI scale with mandibles classified as C3, having the lowest BMD [27]. In the present study, the distribution of all patients according to cortical quality i.e., MCI as assessed on OPG, was done and it was found that in the premenopausal group, 90% of the patients had a cortical quality classified as C1 whereas in the post-menopausal group, only 44% patients had C1 type of a cortex. No patients in the premenopausal group had a cortex classified as C3 whereas 14% of patients in the post-menopausal group had a cortex classified as C3. The difference between the distributions of patients was found to be statistically significant (p-value 0.0005) [Table/Fig-5]. This suggests that the cortex becomes thinner and irregular in post-menopausal females. But Mudda JA et al., and Zlataric K et al., have reported an age related increase in the number of patients with C2 and C3 type of cortex suggesting that the cortical changes are dependent on age as well [19,27]. In the present study also, it was seen that C2 and C3 types of cortices were seen in older patients. With increasing age, the tendency of an individual to have cortical erosion also increases. This may be attributable to the normal physiologic process of age-related bone resorption coupled with hormonal changes in post-menopausal women. Therefore, there is a need to compare these cortical changes with age-matched male subjects so as to assess whether these changes are only related to hormones. In terms of ease of learning, we found that MCI is relatively easy to learn and with the help of reference radiographs as given by Klemetti E et al., classifying the cortex is simple but appropriate training for general dental practitioners for the use of MCI is necessary [11].
The distribution of patients according to USG class and MCI was assessed which revealed that normal (55.22%) and osteopenic (44.78%) patients were more likely to have a cortex classified as C1 as compared to osteoporotic (0%) patients. Similarly, in osteoporotic patients, C3 type of cortex (86%) was predominantly seen suggesting that whenever an eroded cortex is present, osteoporosis should be suspected (p-value 0.0005) [Table/Fig-6]. As already stated, the bone status of the mandible correlates with the general skeletal status and many studies support this finding. This explains why we found good correlation between findings of USG and MCI. These findings are in agreement with many previous authors [26,28-31]. The sensitivity and specificity of MCI in detecting osteoporosis was found to be 49.15% and 90.24% [Table/Fig-7].
In premenopausal group, it was seen that there is no significant difference in distribution of patients based on MCI in the USG class [Table/Fig-8]. The sensitivity and specificity in the premenopausal group was 12.5% and 91.18%, whereas in the post-menopausal group, there was significant difference in the distribution of patients as per MCI, where it was found that osteopenic and osteoporotic patients predominantly showed a cortex categorised as either C2 or C3 (p-value 0.0345). Thus, a strong association is suggested between the two parameters. The sensitivity and specificity was found to be 62.79% and 85.71% [Table/Fig-9]. On segregation of the sample based on menstrual status and then assessing the sensitivity and specificity, considerable amount of discrepancy was observed in the values. Although, the sensitivity of MCI was not very good, but a high specificity reinforces a definite correlation between the bone density of the mandible and the general skeletal status. Most authors have reported a good sensitivity with regard to MCI [6,15,26,28,32].
Serum Calcium
Based on the findings of the present study, it may be concluded that menopause does not affect the levels of serum calcium. Khatoonabad MJ et al., showed statistically insignificant differences in the levels of serum calcium in normal and osteopenic/osteoporotic post-menopausal women [32]. These findings support the results of the present study.
Limitation
A larger sample size is required for future studies to apply the results on general population.
Conclusion
It was found that the sensitivity of MI was good with a moderate specificity value. And in case of MCI, the specificity was good with a moderate sensitivity. Based on these findings, we may be able to say that MI and MCI associate well and combining the two may be more helpful rather than using either of them alone and panoramic radiography could be a reliable tool in screening osteoporosis.
*Obtained using Chi-square test
*Obtained using Chi-square test
*Obtained using one-way ANOVA in Overall and Post-menopausal group; **Using Tukey’s post-hoc test in Overall and Post-menopause group; †Using t-test for independent samples
*Obtained using Chi-square test with simulated p-value
*Obtained using Chi-square test with simulated p-value
*Obtained using Chi-square test
C1: Endosteal margin of cortex sharp and even on both sides; C2: endosteal margin with semilunar defects and cortical residues one to three layers thick on one or both sides. C3: endosteal margin appearing clearly porous with thick cortical residues
*Obtained using Chi-square test with simulated p-value
C1: Endosteal margin of cortex sharp and even on both sides; C2: Endosteal margin with semilunar defects and cortical residues one to three layers thick on one or both sides; C3: Endosteal margin appearing clearly porous with thick cortical residues
*Obtained using Chi-square test
C1: Endosteal margin of cortex sharp and even on both sides; C2: Endosteal margin with semilunar defects and cortical residues one to three layers thick on one or both sides; C3: Endosteal margin appearing clearly porous with thick cortical residues
*Obtained using Chi-square test
C1: Endosteal margin of cortex sharp and even on both sides; C2: Endosteal margin with semilunar defects and cortical residues one to three layers thick on one or both sides; C3: Endosteal margin appearing clearly porous with thick cortical residues
*Obtained using Fisher’s-exact test
C1: Endosteal margin of cortex sharp and even on both sides; C2: Endosteal margin with semilunar defects and cortical residues one to three layers thick on one or both sides; C3: Endosteal margin appearing clearly porous with thick cortical residues
*Obtained using one-way ANOVA in Overall and Post-menopausal groups; **Using Tukey’s post-hoc test in Overall and Post-menopausal group; †Using t-test for independent samples