Laboratory Request Form Revamped: Pictogram Based Symptoms Afford Adequate Patient’s Clinical Information in High Patient Load Setting
Mahadevan Ganesan1, Ganesan Sucila Thangam2, Ramalingam Sekar3, Robert Sudha4
1 Research Scientist, Department of Microbiology, Government Theni Medical College, Theni, Tamil Nadu, India.
2 Associate Professor, Department of Microbiology, Government Theni Medical College, Theni, Tamil Nadu, India.
3 Tutor, Department of Microbiology, Government Theni Medical College, Theni, Tamil Nadu, India.
4 Associate Professor and Head, Department of Microbiology, Government Theni Medical College, Theni, Tamil Nadu, India.
NAME, ADDRESS, E-MAIL ID OF THE CORRESPONDING AUTHOR: Ganesan Sucila Thangam, Kanavilakku, Theni, Tamil Nadu, India.
E-mail: drgsucila@rediffmail.com
Introduction
Laboratory Request Form (LRF) offers communication triad involving patient, physician and diagnostic service providers. LRFs with complete patient’s clinical information along with the diagnostic results may be used as predictor tool for emerging diseases. Overcrowding of wards in developing countries, especially in India, may affect physician’s effectiveness causing an appalling lack of clinical symptoms in LRFs or mostly left unattended by form attendees. Solving this problem certainly requires a novel method of data collection with the aim of improving the physician’s attention.
Aim
The objective of this study was two-fold: (1) to determine the proportion of unattended and partially filled LRFs; and (2) to evaluate the effectiveness of pictograms over text oriented symptoms.
Materials and Methods
A total of 645 Pictogram based LRF (PLRF) were provided as an overleaf along with the Text oriented LRFs (TLRF). The percentages of blank form, total symptoms per form, and individual symptoms per form were calculated. Physicians Attention Index (PAI) was also calculated based on the number of LRFs in which physicians filled the duration of one or more symptoms. The difference in frequencies of categorical responses between two dependent groups was calculated by way of the comparison of proportions and chi-square. A two-sided p-value <0.05 was considered as the test of significance for all parameters.
Results
A significant proportion of unattended forms decreased upon implementation of PLRFs (23.4% vs. 11.8%; p-value =0.0001). Notably, symptoms such as headache, abdominal pain, rhinorrhea, knee pain showed the most improved proportions of all. During this study period, dengue accounts for >80% of the test request provided with more number of associated symptoms. Interestingly, PAI was 0.125 (21.7%) in PLRFs and this could not be possible in the default TLRF.
Conclusion
Revisiting of LRF is need of the hour in order to get maximum attention from form attendees thereby improving adequacy in test requesting information. This will ultimately aid the physician or diagnostic service providers to offer differential diagnosis which in turn improves the quality of patient care.
Completeness, Infographics, Symptoms assessment, Test request form
Introduction
Laboratory Request Forms (LRFs) act as triad that interconnects patient, physician and diagnostic service provider. The importance of LRFs in laboratory diagnosis is mainly to confirm the disease and sometimes this may be the determining factor for initiating or adjusting the treatment [1]. Patient history/clinical information are imperative to ascertain the clinical significance and to offer a clinically relevant/useful test report by a laboratory professional. In high patient load government settings, it is noted that the LRFs is often incomplete for necessary patient/specimen information [2]. Majority of the errors (68%) usually occur at pre-analytical stage itself [3]. In post analytical step, laboratory results interpreted with that of clinical history mentioned in the LRFs is highly recommended. In that case, inadequate information or uncompleted LRFs imply difficulties in terms of patient care, timely diagnosis and financial resources.
Most of the non-private hospitals forward samples for diagnostic testing with LRF which have patient name, age, sex, address and result of the test. In order to improve this scenario, Virus Research and Diagnostic Laboratory (VRDL), a network of laboratories in India has been established by Department of Health Research and Indian Council of Medical Research, New Delhi for handling of viral diseases not only in emergency situations but also to carry out and report the routine viral diagnosis. LRF for VRDLs is designed and distributed by National Institute of Epidemiology (NIE), Chennai. It is in duplex format in which the first page is solely for recording the details of patients who attended hospital either as in-patients or out-patients, while the other deals with the details pertaining to patients or samples from outbreak/disease clusters. As a whole, the VRDL form designed by NIE has seven dedicated sections such as: (a) identification; (b) patient information; (c) clinical details; (d) epidemiological details; (e) patient information especially during an outbreak; (f) details of sample collection; and (g) laboratory results [4]. Most often, requesting physicians may not be able to fully utilise this important communication medium due to the complexity of information furnished in it. Hence, in order to simplify the complex presentation of clinical information, the present study has modified the default TLRF with the pictograms. There is limited number of publications that has employed pictograms in LRFs for prognostic and diagnostic perspectives.
The aim of this novel study was two-fold the first one was to determine the proportion of unattended and partially filled LRFs; and to evaluate the effectiveness of pictograms over text oriented symptoms. The present study was designed to improve the completeness of clinical information by introducing pictogram based symptoms in order to enhance the physician’s attention.
Materials and Methods
This prospective study was conducted at VRDL Government Theni Medical College, Theni, Tamil Nadu, India for six months from August 2018 to January 2019. The LRFs (n=645) evaluated in this study included all the investigative modalities offered in this VRDL. The pictograms for this study were designed by the author with the following characteristics; use of blue colour as in default LRF, clear and simple line art images, and use of plain large font both in English and Tamil (local) language. Each symptom in the clinical section was depicted by appropriate pictogram. This was attached onto default text oriented form as an overleaf. Therefore, for each patient, two types of clinical sections i.e., TLRF and PLRF were assessed. LRFs of both inpatient and outpatient received for routine laboratory investigations were evaluated. The permission for conducting this study was obtained from the Institutional Ethical Committee (IEC. No:884/MEIII/19).
Data Processing
The number of forms without clinical indication (blank), the different clinical information per form was calculated and the type of investigation in each form was also included. The duration of illness was depicted in pictographic scale that ranged from 1 to 10. In addition to that, the forms with duration of individual symptoms filled by the physicians were assessed. For the first of its kind, PAI was elucidated and calculated by the author which is the ratio of LRFs with the duration of symptoms that were filled by the physicians to the total number of LRFs received during the study period. The total number of symptoms per form and their type of symptoms were entered into a Microsoft excel sheet.
Statistical Analysis
The data were summarised using a frequency distribution table and analysed using descriptive statistics. The response rate differences for TLRF and PLRF was depicted by proportional Venn diagram. All the data were expressed in percentages followed by its cumulative frequencies. Clinical information per patient entered in both the forms was considered as dependent variable. The difference in frequencies of categorical responses between two dependent groups was calculated by way of the comparison of proportions and chi-square. A two-sided p-value <0.05 was utilised as the criterion for rejecting the null hypothesis of no difference. All statistical analysis was done using SPSS software.
Results
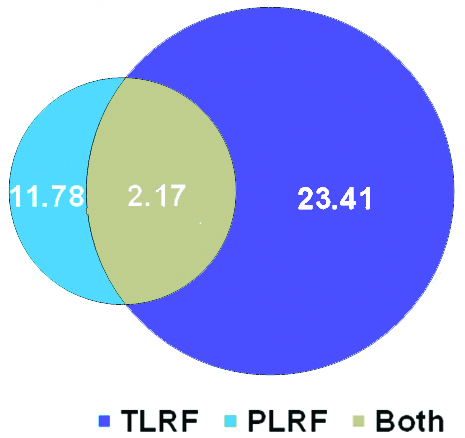
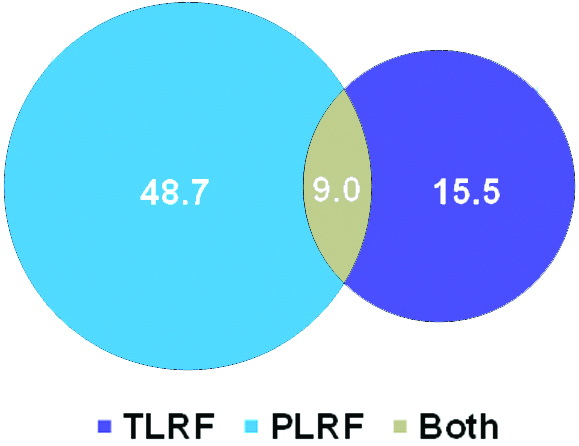
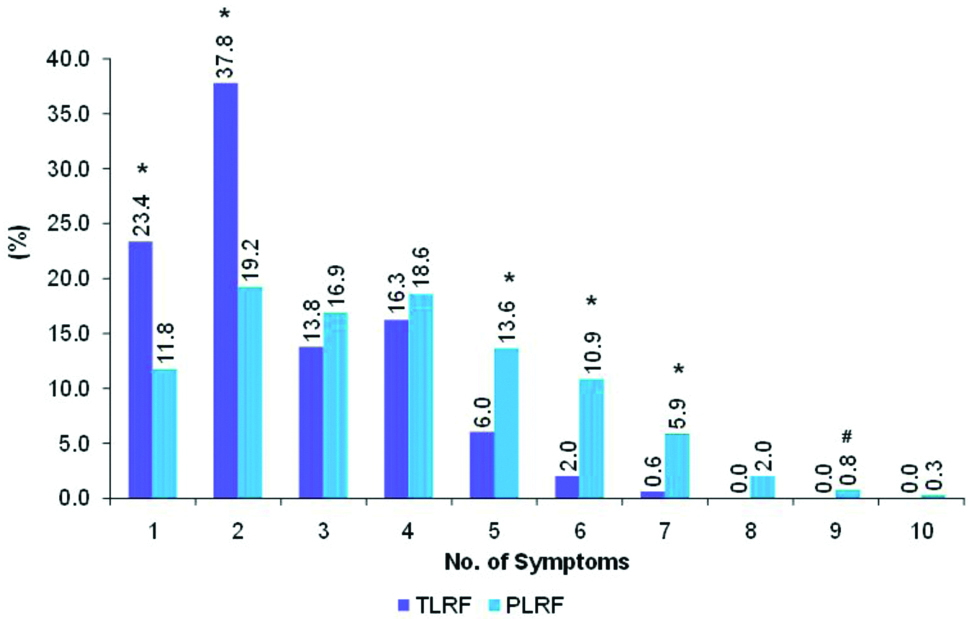
A total of 645 LRFs were evaluated, of which majority of the test done for dengue (622), followed by Hepatitis A Virus (HAV) (12), Chikungunya (8) and Rota virus (3). The number of LRFs with relevant clinical information increased significantly (p=0.0001) after the implementation of the pictogram, surpassing 85% compared to that of text oriented symptoms. [Table/Fig-1] shows the proportion of incomplete TLRFs received during the six months period. A small proportion of 2.2% (14) were left blank in both type of LRFs. Conversely, the duration of illness was filled more in TLRF than PLRF while 15.5% (100) were found unfilled in both forms [Table/Fig-2]. In the context of associated symptoms, more than one symptom per form was significantly (p=0.0001) improved in PLRFs. Majority of TLRFs (395) were with single or dual symptom(s)/form, on the other hand, in PLRFs frequencies under various symptoms showed almost a normal distribution [Table/Fig-3]. The maximum number of symptoms per request form was six and nine in TLRF and PLRF respectively.
Proportionate decrease in blank LRFs after implementation of pictograms.
Proportion of unattended duration of illness seen in PLRFs.
Comparison of total number of symptoms filled per LRF.
The proportion of each categorical response is tested by Test for Proportion (Fisher Exact test) and denoted as p-values 0.0001 (*), and 0.05 (#)
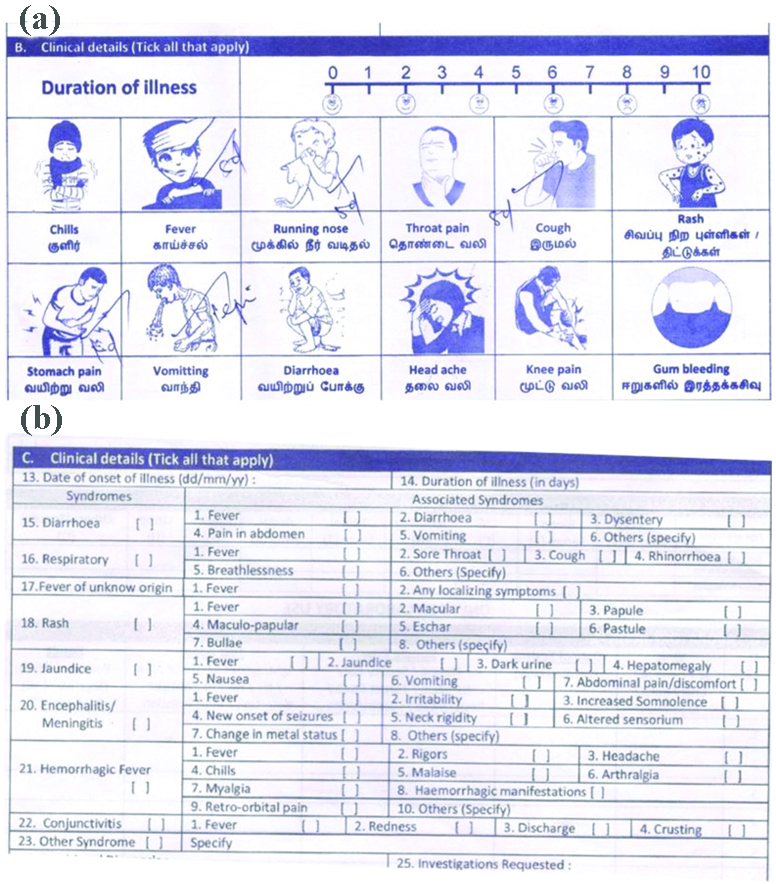
In addition, individual symptom wise frequencies were found to be higher in PLRF than TLRF; 4 vs. 7 (rash), 435 vs. 509 (fever) as shown in the [Table/Fig-4]. Significant improvement level at p=0.0001 was observed in knee pain-91.0% (101), rhinorrhea-88.6% (132), headache-81.2% (155). PLRFs attended by physicians mentioning the duration of symptoms was evidenced by [Table/Fig-5a]. Interestingly, PAI was 0.125 (21.7%) in PLRFs and this could not be possible in the default TLRF [Table/Fig-5b].
Comparison of symptom wise frequencies in TLRF and PLRF.
| Symptoms | Frequencies | Total |
|---|
| TLRF (%) | PLRF (%) |
|---|
| Fever | 435 (46.1) | 509 (53.9)# | 944 |
| Rhinorrhea | 17 (11.4) | 132 (88.6)* | 149 |
| Chills | 52 (25.0) | 156 (75.0)* | 208 |
| Throat pain | 49 (31.4) | 107 (68.6)* | 156 |
| Cough | 88 (29.5) | 210 (70.5)* | 298 |
| Rash | 4 (36.4) | 7 (63.6) | 11 |
| Abdominal pain | 42 (29.8) | 99 (70.2)$ | 141 |
| Vomit | 91 (43.1) | 120 (56.9)# | 211 |
| Diarrhoea | 53 (50.0) | 53 (50.0) | 106 |
| Headache | 36 (18.8) | 155 (81.2)* | 191 |
| Knee pain | 10 (9.0) | 101 (91.0)* | 111 |
| Gum bleeding | 1 (11.1) | 8 (88.9) | 9 |
Significance of PLRFs compared to that of TLRFs is expressed in terms of p-values: 0.05 (#), 0.001 ($) and 0.0001 (*)
LRFs indicating Physician’s Attention Index (PAI).
Pictograms attracted form attendees and provide space for mentioning the duration of each symptoms (a) whereas the default TLRF (b) is designed with check box
Discussion
Appropriate diagnosis and treatment provided to patients is always associated with symptom based clinical investigations as these symptoms will offer critical clues to the diagnosis. Even though the importance of appropriate completion of LRFs is usually emphasised for pre-registration house officers, the clinical history part of TLRF is often incomplete or even sometimes left blank [5]. The incompleteness in many of the TLRFs was in accordance with the study conducted at Lagos in which 1.3% of the 7,841 LRFs were fully completed [6]. In another case, TLRFs even fails to provide limited details of blood donors at Kano, Nigeria [7]. Salient works done by Salinas M et al., and Dogether MA et al., compared the completeness of paper based LRFs with LIS [2,8]. They found that 20-25% of the TLRFs were with blank clinical information. After implementation of LIS software based online Analytical Processing unit, the number of LRFs without clinical information were minimised. Similarly, this present study showed significant increase in completion rate of LRFs while replacing text oriented symptoms with pictorials.
Associated symptoms like headache, diarrhoea, abdominal pain is significantly filled in PLRFs. The pictorial form of symptoms not only attracts form attendees but also individuals without medical knowledge, feel ease to fill the form. This will be useful in most of the high patient load setting wherein physicians are unable to concentrate on each patient. Since this study was single blinded, the physicians were not advised or instructed to mention the duration of each symptom. So, the PAI in PLRFs is the direct indication of how pictograms enhance the involvement of physicians in form filling procedure.
The symptoms in default TLRF is grouped into syndrome such as diarrheal, respiratory, encephalitis etc. This kind of layout, if filled properly, will provide syndrome wise symptoms that aid the clinicians to narrow down the diagnostic tests and treatment protocol. In addition to that, majority of the TLRFs are filled with duration of illness and that again a crucial factor for diagnosing diseases like dengue. It is agreed that the conventional TLRF has stand out in some of the parameters but it under performs in clinical information section. In TLRF, repeated symptoms like fever, diarrhoea is mentioned under most of the syndromes which may lead to erroneous outcome. Hence, these symptoms may be merged into one symptom per clinical sign in PLRF. It is also noteworthy that the default TLRF doesn’t have provision to mention the duration in symptoms as of PLRF.
The utility of pictograms are mostly aimed to educate the patients on the use of medications and awareness programs in the form of leaflets or pamphlets namely in diabetes [9], haemodialysis [10], reflux Symptoms [11], psoriasis [12], dyspepsia [13]. The results of these studies showed that the patient information leaflets having pictorials of clinical signs have worked greatly in understanding the risk factors, transmission of disease and effective management of diseases. This is because, compared with abstract words, pictograms can make it easier for people to interpret and perceive information in a proper manner. This present study also brings out the evidence that imply pictorial symptoms in LRFs can greatly enhance the physician’s attention thereby improve the completeness of the request forms.
Limitation
This study had certain limitations; firstly, not all symptoms such as jaundice, dark urine are converted into pictograms. Secondly, those clinical information that are filled in the PLRF are not verified with the patient’s case history. However, the outcome of this study suggests that the pictorial representation of symptoms in LRFs seems to be better and furthermore, the other sections has been taken into consideration for improvement in near future.
Conclusion
Combination of picture with text improves the quality in patient’s clinical history. Completeness in clinical information not only gives the laboratory personnel an opportunity to enhance patient benefit through post-analytical step interpretation but it also aid in the future retrospective studies. To put it in a nutshell, the authors emphasised the need to revisit LRF and to validate the usage of pictograms or any other novel yet attractive methods that would enhance accuracy and compliance with the necessities of laboratory request form. This, in turn, will improve the quality of patient/specimen information which aids the physician or diagnostic service providers to offer differential diagnosis.
Significance of PLRFs compared to that of TLRFs is expressed in terms of p-values: 0.05 (#), 0.001 ($) and 0.0001 (*)
[1]. Barros IM, Alcântara TS, Mesquita AR, Santos AC, Paixão FP, Lyra DP Jr, The use of pictograms in the health care: a literature reviewRes Social Adm Pharm 2014 10(5):704-19.10.1016/j.sapharm.2013.11.00224332470 [Google Scholar] [CrossRef] [PubMed]
[2]. Salinas M, López-Garrigós M, Flores E, Leiva-Salinas M, Esteban P, Ahumada M, Indications for laboratory tests in primary care: assessment of the most frequent indications and requests with blank clinical informationBiochemia Medica 2016 26(3):431-35.10.11613/BM.2016.04527812310 [Google Scholar] [CrossRef] [PubMed]
[3]. Plebani M, Errors in clinical laboratories or errors in laboratory medicine?Clin Chem Lab Med 2006 44(6):750-59.10.1515/CCLM.2006.12316729864 [Google Scholar] [CrossRef] [PubMed]
[4]. Virus Research and Diagnostic Laboratory (VRDL), Sri Venkateswara Institute of Medical Sciences, Tirupati, Andhra Pradesh. http://svimstpt.ap.nic.in/Microbiology_files/CRF.pdf Accessed on 09-August-2019 [Google Scholar]
[5]. Henderson AR, The test request form: a neglected route for communication between the physician and the clinical chemist?J Clin Pathol 1982 35:986-98.10.1136/jcp.35.9.9867119131 [Google Scholar] [CrossRef] [PubMed]
[6]. Oyedeji OA, Ogbenna AA, Iwuala SO, An audit of request forms submitted in a multidisciplinary diagnostic center in LagosPan Afr Med J 2015 420:310.11604/pamj.2015.20.423.577826309456 [Google Scholar] [CrossRef] [PubMed]
[7]. Jegede F, Mbah HA, Dakata A, Gwarzo DH, Abdulrahman SA, Kuliya-Gwarzo A, Evaluating laboratory request forms submitted to haematology and blood transfusion departments at a hospital in Northwest NigeriaAfr J Lab Med 2016 5(1):a38110.4102/ajlm.v5i1.38128879111 [Google Scholar] [CrossRef] [PubMed]
[8]. Dogether MA, Muallem YA, Househ M, Saddik B, Khalifa M, The impact of automating laboratory request forms on the quality of healthcare servicesJ Infect Public Health 2016 9:749-56.10.1016/j.jiph.2016.09.00327670682 [Google Scholar] [CrossRef] [PubMed]
[9]. Doucette D, Vaillancourt R, Berthenet M, Li LS, Pouliot A, Validation of a pictogram-based diabetes education tool in counselling patients with type 2 diabetesCan Pharm J (Ott) 2014 147(6):340-44.10.1177/171516351455266225364350 [Google Scholar] [CrossRef] [PubMed]
[10]. Mateti UV, Nagappa AN, Attur RP, Bairy M, Nagaraju SP, Mallayasamy S, Preparation, validation and user-testing of pictogram-based patient information leaflets for hemodialysis patientsSaudi Pharm J 2015 23:621-25.10.1016/j.jsps.2015.01.02226702256 [Google Scholar] [CrossRef] [PubMed]
[11]. Zhao W, Jin H, Zhang L, Wang B, Sun F, Jiao H, Pictograms to Provide a Better Understanding of Gastroesophageal Reflux Symptoms in Chinese SubjectsGastroenterol Res Pract 2017 2017:121458410.1155/2017/121458428656044 [Google Scholar] [CrossRef] [PubMed]
[12]. Satheendran S, Nagappa An, Pai S, Pictogram-based information leaflet in Patients with psoriasisAsian J Pharm Clin Res 2017 10(7):405-07.10.22159/ajpcr.2017.v10i7.17384 [Google Scholar] [CrossRef]
[13]. Tack J, Carbone F, Holvoet F, Vanheel H, Vanuytsel T, Vandenberghe A, The use of pictograms improves symptom evaluation by patients with functional dyspepsiaAliment Pharmacol Ther 2014 40:523-30.10.1111/apt.1285525052080 [Google Scholar] [CrossRef] [PubMed]