The diagnosis of AA is not always clear clinically as symptoms are not always classical [1]. Clinical diagnosis of AA is accurate in only 70% to 80% [2]. History and examination are often inconclusive in diagnosing and excluding appendicitis [3]. Delays in diagnosis leads to perforation [4]. In order to avoid the repercussions of delay in rightly diagnosing AA, few surgeons have adopted a liberal criteria for surgery with acceptable NAR of 15% to 25%, and even higher rates in women for whom reaching correct diagnosis is difficult [5,6].
Operative treatment based only on clinical examination has a high NAR. As diagnostic accuracy of clinical algorithm is very low thus many surgeons resort to imaging modalities, most promising being graded compression sonography and computed tomography. In the recent times, many law suits are being filed against surgeons for delayed treatment or diagnostic error in cases of AA [7]. Operation room delays, misdiagnosis and delayed diagnosis have all been termed as medical negligence amounting to monetary and administrative punishments [8]. Therefore, complimenting a clinical diagnosis with imaging becomes a safe option in the current surgical practice.
Hence, the present study was conducted to assess the utility of abdominal USG and CT scan in reducing diagnostic errors in AA. The diagnostic efficacy of AS, USG and CT scan were studied in terms of measurable outcomes such as sensitivity, specificity, PPV, NPV, diagnostic accuracy, NAR so as to formulate a diagnostic algorithm for AA.
Materials and Methods
This was a prospective observational study of Diagnostic Accuracy conducted in a tertiary care teaching hospital over a period of 1 year from Dec 2017 to Nov 2018 after obtaining Ethical clearance from Institutional Ethics Committee (vide letter Nos IEC BHDC/49 of 2017 dated 06 Nov 2017 and SRC BHDC / 49 of 2017 dated 06 Nov 2017) and consent from all patients.
Sample Size Calculation
For estimation of sample size, the following statistical formula was used:
For Sensitivity 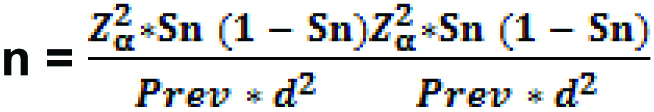
For Specificity 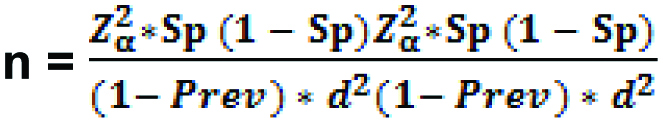
Where;
Zα = Value of standard normal variate corresponding to α level of significance;
Sn = Sensitivity of the Test;
Sp = Sensitivity of the Test;
Prev = Prevalence of the disease;
d = Margin of errors which is a measure of precision;
Review of literature [9-13] was done to make assumptions of sensitivity and specificity of all three diagnostic modalities (AS, USG and CT scan) as well as prevalence of AA. A minimum sample size of 87 was calculated based on the above formula.
Methodology
Total 102 patients with suspicion of AA who underwent appendicectomy were included in the study. Patients with complicated appendicitis such as perforation mass or abscess; age <12 years and pregnant women were excluded.
Decision for surgical management was taken by a senior surgeon and investigator was informed. A detailed independent clinical evaluation was carried out by the investigator. AS was applied in all patients and were referred for USG while CT scan was asked only in cases of equivocal AS and inconclusive USG findings as per hospital protocol. The patients were assigned to three groups based on the AS as low risk (AS: 1-4), intermediate risk (AS: 5-6) and high risk (AS: 7-10). Further the AS <7 and ≥7 were considered as negative and positive findings respectively based on the study by Ohle R et al., [14]. The gold standard for confirming diagnosis of AA was Histopathological examination (HPE) [15]. A pretested proforma was used to collect relevant information (patient data, AS, USG findings, CT scan, intraoperative findings and HPE report) [15].
Statistical Analysis
Patient’s data, AS, USG, CT scan and HPE findings were analysed using SPSS 24.0. Chi-square test was used for testing of significance for association. The sensitivity, specificity, PPV, NPV, accuracy and negative appendectomy rates were calculated for AS, USG and CT scan by standard methods. The p-value <0.05 was considered statistically significant.
Results
AS was calculated for all patients during the study period. A total of 102 patients were included, who underwent surgery for AA based on clinical and imaging findings, of whom 91 had appendicitis confirmed on HPE. There were 75 males and 27 females with a mean age of 27.5±10.0 years [Table/Fig-1]. All patients were subjected to appendiceal USG, while 33 patients underwent CT scan [Table/Fig-1]. NAR was 9.33% in males and 14.8% in females with overall NAR of 10.78%. The individual diagnostic performance of AS, USG and CT scan are shown in [Table/Fig-2] while performance of USG and CT scan in patients with low AS is shown in [Table/Fig-3].
Patient’s demographic and clinical data and eventual management.
| Criteria | Male | Female | Overall |
|---|
| Number | 75 | 27 | 102 |
| Age (Mean±SD) | 26.1±9.3 | 25.6±8.9 | 27.5±10.0 |
| Alvarado score (n=102) | | | |
| ≥7 | 58 | 16 | 74 |
| <7 | 17 | 11 | 28 |
| USG findings (n=102) | | | |
| Positive | 67 | 21 | 88 |
| Negative | 08 | 06 | 14 |
| CT scan findings (n=33) | 19 | 14 | 33 |
| Positive | 12 | 12 | 24 |
| Negative | 07 | 02 | 09 |
| HPE findings | | | |
| Positive | 68 | 23 | 91 |
| Negative | 07 | 04 | 11 |
| Negative appendectomy rate | 9.33% | 14.81% | 10.8% |
USG: Ultrasonography; CT: Computed tomography; HPE: Histopathological examination
Diagnostic performance of AS, USG and CT scan.
| Criteria | Alvarado’s score (n=102) | USG (n=102) | CT scan (n=33) |
|---|
| Overall | Male | Female | Overall | Male | Female | Overall | Male (n=19) | Female (n=14) |
|---|
| Sensitivity | 78.02% | 83.82% | 60.87% | 94.51% | 98.53% | 82.61% | 96.0% | 100% | 92.31% |
| Specificity | 72.73% | 85.71% | 50.00% | 81.82% | 100% | 50.00% | 100% | 100% | 100% |
| PPV | 95.95% | 98.28% | 87.50% | 97.73% | 100% | 90.48% | 100% | 100% | 100% |
| NPV | 28.57% | 35.29% | 18.18% | 64.29% | 87.50% | 33.33% | 88.9% | 100% | 50% |
| Accuracy | 77.45% | 84.00% | 59.26% | 93.14% | 98.67% | 77.78% | 96.96% | 100% | 92.86% |
| Chi-square value | 12.691 | 17.508 | 0.167 | 48.277 | 64.660 | 2.096 | 28.160 | 19.000 | 6.462 |
| p-value | 0.0001 | 0.0001 | 0.683 | 0.001 | 0.0001 | 0.148 | 0.0001 | 0.0001 | 0.011 |
AS: Alvarado score; USG: Ultrasonography; CT scan: Computed tomography scan; PPV: Positive predictive value; NPV: Negative predictive value
Diagnostic performance of USG and CT scan in patients with AS <7.
| USG findings | CT scan findings |
|---|
| Sensitivity | 95.00% | 100% |
| Specificity | 100% | 100% |
| PPV | 100% | 100% |
| NPV | 50.00% | 100% |
| Accuracy | 95.24% | 100% |
| Chi-square value | 23.644 | 28.00 |
| p-value | 0.0001 | 0.001 |
USG: Ultrasonography; CT scan: Computed tomography scan; PPV: Positive predictive value; NPV: Negative predictive value
The overall sensitivity, specificity, PPV, NPV and diagnostic accuracy of AS was 78.02%, 72.73%, 95.95%, 28.57% and 77.45% respectively which was statistically higher in males [Table/Fig-2]. The overall sensitivity, specificity, PPV, NPV and diagnostic accuracy of USG was 94.51%, 81.82%, 97.73%, 64.29% and 93.14% respectively and had a higher value in males [Table/Fig-2]. In females, the sensitivity, specificity, PPV, NPV, accuracy of the CT scan was 92.31%, 100.00%, 100.00%, 50.00% and 92.86% respectively while in males, the sensitivity, specificity, PPV, NPV, accuracy of the CT scan was 100.00%, 100.00%, 100.00%, 100.00% and 100.00% respectively [Table/Fig-2]. CT scan had an overall sensitivity of 96.00% and specificity of 100% [Table/Fig-2].
In patients with AS <7, USG and CT scan had better sensitivity, specificity, PPV, NPV and higher diagnostic accuracy [Table/Fig-3]. USG had better sensitivity (95.00% versus 94.37%), specificity (100.00% versus 33.33%), NPV (50.00% versus 20.00%), and diagnostic accuracy (95.24 versus 91.89) as compared to patients with AS >7. These were the subset of patients where decision making was difficult and imaging adjunct was helpful.
Discussion
Since 1886 when Reginald Fitz described AA as a disease entity, various clinical scoring systems have been described of which the Alvarado criteria, generating the MANTRELS score, is the most effective [14,15]. A score of >7 points has a sensitivity of 90% and specificity of 80% [16]. In the index study, out of 74 (72.5%) patients having the AS ≥7 there were 03 negative appendicectomies while 28 (27.5%) patients having the AS <7 there were 08 negative appendicectomies [Table/Fig-1]. The overall sensitivity of AS was 78%, specificity of 73% and diagnostic accuracy of 77.45%, and is comparable to the findings of Kularatna M et al., [9]. Alvarado A himself reported sensitivity, specificity and PPV of AS to be 80%, 74% and 92% [17].
AS is a good diagnostic ‘rule out’ tool in men with poor reliability in children and tendency to over diagnose AA in women [18]. In the study by Ozkan S et al., AS had a superior sensitivity, specificity, PPV and NPV in males [19]. We also found AS to have better specificity (85.71% versus 50.00%) and lower NAR (9.3% versus 14.8%) in males.
USG depicted a sensitivity of 94.51%, specificity of 81.82% and PPV and NPV of 97.73% and 64.29% respectively with a diagnostic accuracy of 93.14% in our study which was comparable to findings of Terasawa T et al., in a systematic review done from 1966 to 2003 [20]. The benefit of USG was seen in patients with AS <7 where clinical decision making was difficult. Combining AS with USG improves sensitivity, specificity and diagnostic accuracy in patients with AS >7 as reported by Pipal DK et al., and Nautiyal H et al., in their respective studies [21,22]. However, Mishra A et al., in their study reported definite advantage of USG in AS <7, and similar finding was observed in our study [5].
CT scan was performed in 33 patients in cases of equivocal AS and inconclusive USG findings. Hwang ME did a literature review of all studies published between 1986 to 2014 and found that pooled sensitivity, specificity of CT scan was higher than USG [11]. We also found CT scan to have a higher sensitivity and specificity than USG. In patients with AS <7, CT scan had a 100% sensitivity, specificity, PPV, NPV and accuracy similar to study by Tan WJ et al., [23]. Rosen MP et al., concluded that CT scan performed in the emergency department increases the physician’s level of certainty and reduces the hospital admission rates by 23.8% and leads to more timely surgical intervention [24].
A study on 241 malpractice (relating to the diagnosis and treatment of acute appendicitis) found that surgeons were held responsible in 41% of the claims [25]. Role of CT scan is beneficial as it can be undertaken rapidly, interpreted accurately and definitively to guide treatment in AA. With its additional advantage over USG in accurately diagnosing AA [26], its increased use over the years by surgeons [6] is justified.
Limitation
In countries with limited resources of man, material and manpower, CT scan is not available in most of the primary and secondary healthcare set up. Cost-effectiveness of applicability of CT scan in AA, in a developing country needs further research.
Conclusion
CT scan has better sensitivity, specificity and diagnostic accuracy as compared to AS and USG. Utility of CT scan is more productive when AS is <7. We recommend that USG should be used as an adjunct in all patients of suspected AA. CT scan to be used in equivocal cases of AA in which AS and USG cannot establish the diagnosis thereby safeguarding surgeons against medico-legal litigations due to diagnostic errors in AA.
USG: Ultrasonography; CT: Computed tomography; HPE: Histopathological examination
AS: Alvarado score; USG: Ultrasonography; CT scan: Computed tomography scan; PPV: Positive predictive value; NPV: Negative predictive value
USG: Ultrasonography; CT scan: Computed tomography scan; PPV: Positive predictive value; NPV: Negative predictive value