Accurate measurement of foetal weight is crucial and impacts on the management of the foetus in various clinical scenarios. It is essential for the monitoring of foetal development in women with high risk pregnancies; it provides information that helps obstetricians decide on the time, mode and place of delivery for most pregnancies; and determines the need for specific interventions [1-5]. Mortality rates are more sensitive to birth weight than gestational age, thus making foetal weight a determinant of pregnancy outcomes and neonatal mortality [2,6].
Various clinical and imaging techniques are commonly employed in the estimation of foetal weight and studies vary in their opinions on the accuracy of one method over the other [4,7,8]. Currently, two-dimensional ultrasonography is a widely acceptable imaging method for foetal weight estimation. It is perceived as having good clinical validity and precision due to it’s objectivity, as well as use of standardised and reproducible foetal measurements [4,8]. The common foetal measurements include: the BPD, HC, AC and FL, which are then inserted singly or in different combinations into regression modules, to derive weight estimations [2,3,7-12]. Recent modules incorporated either three or all four foetal parameters, in an effort to improve their accuracy and predictive value [4,6,7,12].
Thus, purpose of this study was to compare estimated birth weights obtained with selected sonographic modules, with the actual birth weights, and assess the accuracy of these modules in a South-eastern Nigerian population. This will determine which formula is most suitable, especially when no module has been generated locally.
Materials and Methods
This was a prospective, cross-sectional analytical study of 245 consenting, consecutive, eligible pregnant women receiving care at the antenatal clinic of University of Nigeria Teaching Hospital (UNTH), Ituku-Ozalla, Enugu, Nigeria, from October 2013 to May 2014. The study was approved by the Health Research Ethics Committee of the hospital (NHREC 05/01/2008B-FWA 00002458-IRB00002323). The hospital is a teaching hospital, owned by the Federal Government of Nigeria, which offers primary and specialised health care to residents of Enugu state and its environs. All women with singleton, term pregnancies (37 to 41 weeks of gestational age) were eligible for the study.
Exclusion criteria included pregnant women with chronic medical illnesses such as pulmonary tuberculosis, chronic hypertension, HIV infection and those with complications of pregnancy such as diabetes mellitus, pre-eclampsia, antepartum haemorrhage. Women who were not sure of their last menstrual cycle, and had no ultrasound scan dating of pregnancy within the first trimester and those with antenatal diagnosis of congenital foetal anomalies were also excluded from the study. Each selected mother-foetus pair served as their own control since foetal weight for each foetus was estimated and then compared with their actual birth weight. The sample size was calculated using the standard deviation of the mean foetal weight at birth of 0.64 kg [13]. Therefore, a sample of 245 women was adequate for the study based on an assumed standardised effect size of 0.3, study power of 90% at 95% confidence level, and attrition rate of 5%.
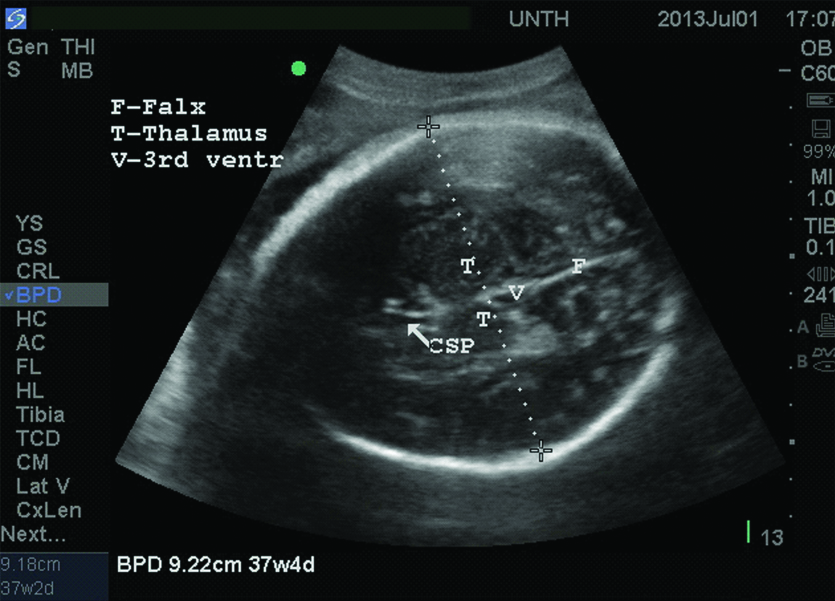
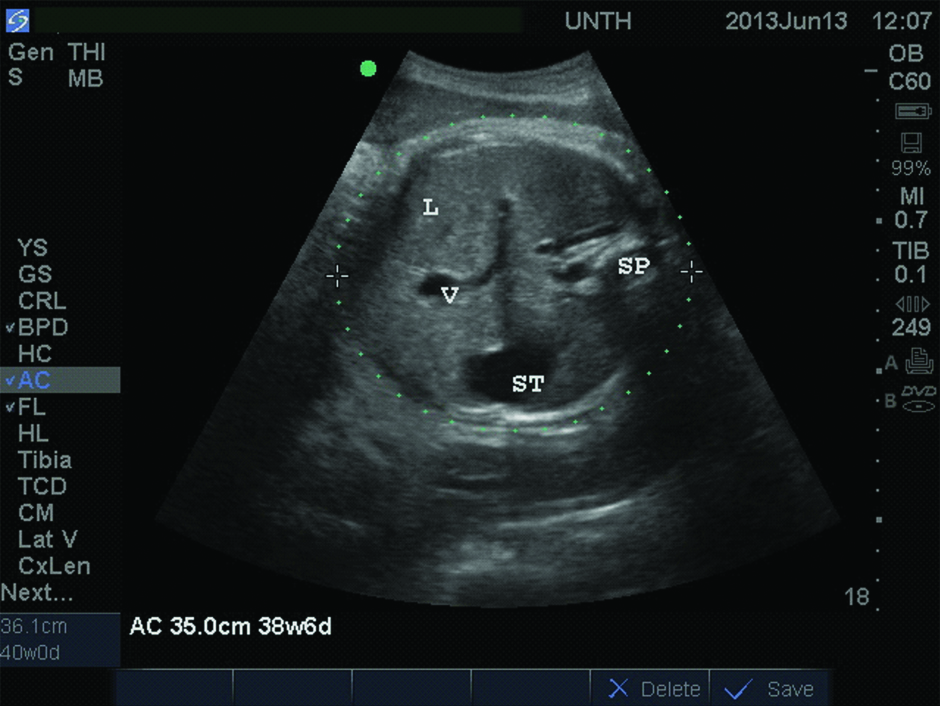
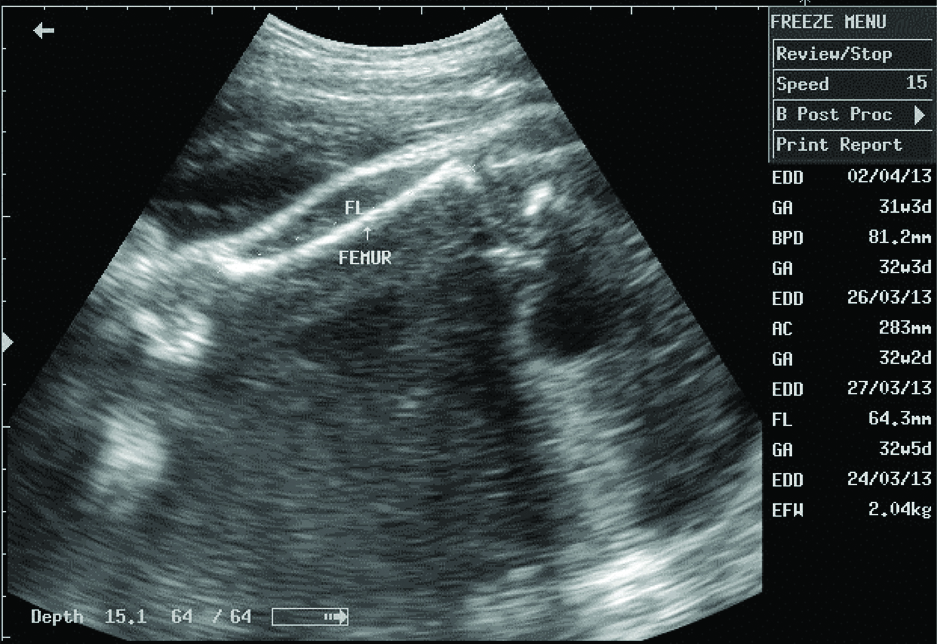
Following informed consent, maternal anthropometric and sonographic foetal measurements were carried out for each participant at the antenatal clinic. Sonographic measurements were taken, using a 3.5-5.0 MHz convex array transducer on a Mindray DP-2200 portable, mobile ultrasound imaging system. Each participant was scanned once, for 20 to 30 minutes, mostly in supine position. The foetal BPD, AC and FL were measured on frozen images with calibrated callipers, using the standard methods- the BPD at the level of the thalami [Table/Fig-1], the AC at the level of the liver [Table/Fig-2] and the FL using O’ Brien method, along the long axis of the shaft [Table/Fig-3] [14,15]. Each foetal parameter was measured three times and the mean of two measures at close range, recorded for each parameter. After delivery, the birth weight of each baby was measured in grams by the midwife on duty, within 30 minutes of delivery, using a standardised neonatal weighing scale. The midwives were blinded to the study objectives. The actual birth weight of each neonate, the sex and number of days from the ultrasound scan (SDI) were documented in the participant’s data sheet. Parameters for each foetus were substituted into the six selected formulae for weight modules, to obtain the EFW. These formulae were:
Transverse ultrasound image of the foetal head at the level of the thalami (T).
The measurement of the Biparietal diameter (BPD) is seen as dashes (----) from one leading edge to the other leading edge.
CSP: Cavum septum pellicidum; F: Falx; T: Thalamus; V: Third ventricle
Transverse ultrasound image of foetal abdomen at the level of the liver, L.
The Abdominal circumference (AC) is measured at a level which demonstrates the umbilical portion (V) of left portal vein within liver, as it meets the horizon portion of left portal vein.
It also shows: Sp: Spine; St-the fluid-filled foetal stomach on the left
Obstetric ultrasound image showing measurement of the femur length (white dots) parallel to the shaft of the femur (arrow).
Single parameter module (using FL)
Honarvar M et al., [3]: EFW (kg)=0.042 FL2(cm)+0.32 FL-1.36. SD approximately±235 gm
Two parameter modules
Hadlock FP et al., [12] (AC/FL):
Log10 EFW=1.304+0.05281(AC)+0.1938(FL)-0.004(AC)(FL)
Hadlock FP et al., [12] (AC/BPD):
Log10 EFW=1.1134+0.05845(AC)-0.000604(AC)2-0.007365(BPD)2 +0.000595(BPD)(AC)+0.1694(BPD)
Three parameter modules (BPD/AC/FL)
Hadlock FP et al., [12]: Log10 EFW=1.335-0.0034(AC)(FL)+0.0316(BPD)+0.0457(AC)+0.1623(FL)
Nzeh DA et al., [11]: Log10 (EBW)=0.470+ 0.4881og10BPD+0.5541og10FL+1.3771og10AC
Nzeh DA et al., [11]: Log10 (EBW)=0.326+0.00451 (SDI)+0.3831og10BPD+0.6141og10FL+1.4851og10AC
The ABW and EFWs obtained from each module were grouped into three categories [16]-low birth weight <2500 gm; normal birth weight 2500-4000 gm; macrosomia >4000 gm.
Statistical Analysis
Statistical Package for Social Sciences (SPSS) computer software version 17.0 for Windows was used for both descriptive and inferential data analysis, at 95% confidence level. Kolmogorov-Smirnov test was used to assess the normality of continuous data. Continuous variables were compared using Wilcoxon Signed Ranks Test, One-Way ANOVA, Spearman’s Correlation test and Mann-Whitney test, as appropriate. A p-value of <0.05 (or 0.01 for correlation co-efficient) was considered statistically significant. Accuracy of the EFW for determining the ABW was assessed for all participants on one hand and for participants with normal birth weight babies on the other hand. Percentage (%) error and the proportion of EFW within ten percent (10%) of ABW were used for both cohorts while the sensitivity/specificity tests and the Receiver Operating Characteristic (ROC) analysis was also applied to the normal birth weight group. The % errors for the sonographic module were compared using ANOVA and Post-Hoc (Tamhane) tests.
For this study, the percentage error for each module was calculated using the formula [8]:
{(Estimated birth weight-Actual birth weight)/Actual birth weight}X100
Also, the sensitivity and specificity of the six modules in estimating normal birth weight were calculated using the following formulae [17].
Sensitivity= {True Positive/(True positive+False Negative)}×100
Specificity= {True Negative/(True Negative+False Positive)}×100
For the sensitivity/specificity tests and ROC analysis, the gold standard for normal birth weight was the actual birth weight range of 2500 to 4000 gm. This value was compared with the EFW of each sonographic module. Thus, when the EFW and its corresponding ABW were ≥2500 and ≤4000 gm, it was considered TP, EFW of <2500 gm or >4000 gm but ABW ≥2500 and ≤4000 gm=FN, EFW ≥2500 and ≤4000 gm but ABW <2500 gm or >4000 gm=FP, while EFW <2500 gm or >4000 gm and ABW <2500 gm or >4000 gm=True negative (TN).
Results
A total of 252 pregnant women were recruited for the study; 245 women (97.2%) completed the study and were analysed while 7 women (2.8%) were lost to follow-up. The mean age of participants was 30.7±4.47 (range=15-41) years. A majority of participants were of Igbo tribe (98.4%, 241/245), married (98.4%, 241/245), multiparous (65.7%, 161/245), and had tertiary education (80.0%, 196/245). The mean ABW of the newborns was 3371.4±413.64 (range=2100-5000) grams. The male to female ratio was 1.2:1 (53.5%, 131/245 versus 46.5%, 114/245). The categories of the ABW were as follows: low birth weight (1.2%, 3/245), normal birth weight (95.1%, 233/245), macrosomia (3.7%, 9/245).
The mean ABW was similar to the mean EFW from Hadlock BPD/AC/FL, Hadlock AC/FL and Honarvar FL modules (>0.05) but differed significantly from those of Hadlock BPD/AC), Nzeh BPD/AC/FL/SDI, and Nzeh BPD/AC/FL without SDI modules. However, the EFW from each module showed a positive correlation with ABW (p<0.001). Details of the association between the actual birth weights with estimated foetal weights from all modules are shown in [Table/Fig-4].
Association between EFW of sonographic modules and ABW.
| Sonographic modules | | Comparison of means | Correlation analysis† |
|---|
| EFW range (grams) | Mean EFW±SD (grams) | p-value* | r | p-value* |
|---|
| Nzeh BPD/AC/FL | 2496-4185 | 3404.2±276.14 | 0.040 | 0.723 | <0.001 |
| Hadlock BPD/AC/FL | 2240-4321 | 3332.4±336.76 | 0.068 | 0.722 | <0.001 |
| Nzeh BPD/AC/FL+SDI | 2374-4460 | 3544.8±355.36 | <0.001 | 0.707 | <0.001 |
| Hadlock AC/FL | 2355-4448 | 3396.1±352.72 | 0.151 | 0.700 | <0.001 |
| Hadlock BPD/AC | 2228-4346 | 3324.0±327.31 | 0.022 | 0.692 | <0.001 |
| Honarvar FL | 2521-4751 | 3392.5±328.89 | 0.348 | 0.427 | <0.001 |
*p-value of the association between actual birth weight and the corresponding sonographic module for estimated foetal weight
†Correlation analysis between actual birth weight and the EFW from each sonographic module
As shown in [Table/Fig-5], for all categories of new-borns and new-borns in the normal weight category, the mean percentage (%) or systematic error for the EFW for each module, ranged from negative to positive values. The Hadlock BPD/AC/FL module had the least mean % error (-0.5±8.56%) while the Nzeh BPD/AC/FL+SDI module had the highest positive mean deviation (5.8±12.06). The ANOVA test showed that there was a significant difference seen generally between the observed mean % errors of the sonographic modules (p<0.001). However, the extent which the systematic error for each module differed from the other modules are shown in [Table/Fig-6]. For example, the systematic error of Hadlock BPD/AC/FL and BPD/AC modules were comparable to each other (p=1.000), and did not differ significantly from that of Hadlock AC/FL (p>0.05).
Percentage (%) Error of EFW and Proportion of EFW within 10% of ABW for various modules.
| Sonographic modules | % Error values (Mean±SD) | Proportion of EFW within 10% of ABW |
|---|
| All newborns (n=245) | Newborns with normal weight (n=233) | All newborns (n=245) | Newborns with normal weight (n=233) |
|---|
| Frequency (%) | Frequency (%) |
|---|
| Hadlock BPD/AC/FL | -0.5±8.56 | -0.4±8.36 | 191 (78.0) | 185 (79.4) |
| Hadlock BPD/AC | -0.7±8.83 | -0.6±8.58 | 192 (78.4) | 186 (79.8) |
| Hadlock AC/FL | 1.4±9.16 | 1.6±9.00 | 178 (72.7) | 172 (73.8) |
| Honarvar equation | 1.7±12.06 | 2.1±11.42 | 142 (58.6) | 140 (60.1) |
| Nzeh without SDI | 1.8±8.75 | 2.0±8.3 | 187 (76.3) | 181 (77.7) |
| Nzeh+SDI | 5.8±9.09 | 6.1±8.79 | 166 (67.8) | 159 (68.2) |
Comparison of systematic error of modules using Post-Hoc test.
| Sonographic modules | Assigned number | Systematic (mean %) Error | Comparison of mean % error with each module p-value for Post-Hoc (Tamhane) test |
|---|
| 1 | 2 | 3 | 4 | 5 | 6 |
|---|
| Hadlock BPD/AC/FL | 1 | -0.5 | | 1.000 | 0.229 | 0.271 | 0.045* | <0.001* |
| Hadlock BPD/AC | 2 | -0.7 | | 0.132 | 0.172 | 0.023* | <0.001* |
| Hadlock AC/FL | 3 | 1.4 | | | 1.000 | 1.000 | <0.001* |
| Honarvar FL | 4 | 1.7 | | | | 1.000 | <0.001* |
| Nzeh BPD/AC/FL without SDI | 5 | 1.8 | | | | | <0.001* |
| Nzeh BPD/AC/FL+SDI | 6 | 5.8 | |
*Significant p-value <0.05
The modules are sorted in descending order of accuracy as reflected by systematic error.
With respect to the proportion of EFW within 10% of the ABW, [Table/Fig-5] shows that Hadlock BPD/AC had the highest proportion (192, 78.4%) followed by the Hadlock BPD/AC/FL module (191, 78.0%). The least proportion of EFW within 10% of ABW was obtained using the Honarvar module (142, 58.0%). The proportions of EFW within 10% of actual birth weight for new-borns in the normal weight category showed a similar pattern to that of the general population.
For the sensitivity and specificity tests, each module was further analysed using ABWs occurring within the normal weight category as a standard. As shown in [Table/Fig-7], the Nzeh BPD/AC/FL without SDI had the highest sensitivity (98.7%) while Nzeh BPD/AC/FL+SDI showed the least sensitivity (88.4%). However, the highest specificity was observed with the Nzeh BPD/AC/FL+SDI module (58.3%) followed by Hadlock BPD/AC (45.5%). The Honarvar module had an indeterminate specificity as none of its EFWs had a true negative value.
Sensitivity and Specificity Tests with their positive and negative values.
| Sonographic module (n=245) | True positives | False negatives | True negatives | False positives | Sensitivity (%) | Specificity (%) |
|---|
| Nzeh BPD/AC/FL without SDI | 230 | 3 | 3 | 9 | 98.7 | 25.0 |
| Hadlock BPD/AC | 230 | 4 | 5 | 6 | 98.3 | 45.5 |
| Hadlock BPD/AC/FL | 227 | 5 | 5 | 8 | 97.8 | 38.5 |
| Hadlock AC/FL | 224 | 10 | 4 | 7 | 95.7 | 36.4 |
| Nzeh BPD/AC/FL+SDI | 206 | 27 | 7 | 5 | 88.4 | 58.3 |
| Honarvar | 224 | 9 | 0 | 12 | 96.1 | ID* |
*ID-Indeterminate
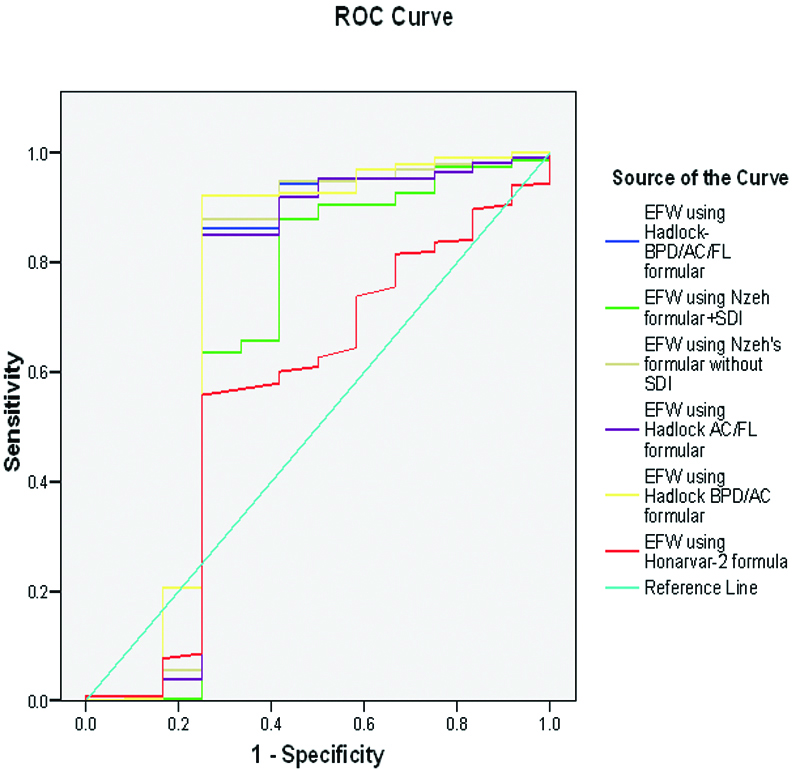
The ROC curve [Table/Fig-8], and the areas under the ROC curve [Table/Fig-9] were used to access the overall accuracy of each module. The Hadlock BPD/AC and the Hadlock BPD/AC/FL had the largest areas, 0.737 and 0.718, respectively, indicating the highest accuracy with this measure. These values for the area under the curve differed significantly (p<0.01) from that of the tangent (area = 0.5). The Honarvar module showed the least AUC (0.482), not statistically different from the tangent.
Receiver operating characteristic (ROC) curve for overall accuracy of modules in estimating normal birth weight.
Values for area under the ROC curve.
| Sonographic module | Area under curve | Standard Error | p-value* |
|---|
| Hadlock BPD/AC | 0.737 | 0.113 | 0.006 |
| Nzeh BPD/AC/FL without SDI | 0.718 | 0.117 | 0.011 |
| Hadlock BPD/AC/FL | 0.713 | 0.117 | 0.013 |
| Hadlock AC/FL | 0.705 | 0.116 | 0.017 |
| Nzeh BPD/AC/F+SDI | 0.654 | 0.114 | 0.072 |
| Honarvar | 0.560 | 0.096 | 0.482 |
*P<0.05 is significant
Discussion
The socio-demographic and obstetric characteristics of the subjects in this study were comparable to those of related studies in Enugu [18], and Lagos [2]. Furthermore, various studies of pregnant women within Enugu, Nigeria [18-20] also demonstrated similar participants’ characteristics indicating that results of this study can be generalised to women within the area.
The sample population of this study is essentially homogenous; this added to the strength of the present study as originators of some sonographic modules encouraged the evaluation of their accuracy in various localities due to inter-populations variations [4,11,21].
The present study assessed six sonographic modules for estimated foetal weight that made use of one, two or all of these three foetal parameters- BPD, AC and FL.
This study showed positive correlations of varying magnitudes between the ABW and the EFW, from all modules. However, stronger correlations were observed in modules that incorporated three foetal parameters (BPD, AC, FL), when compared to those with less than three parameters. Thus, the Hadlock BPD/AC/FL and Nzeh BPD/AC/FL modules had the best correlations while the least correlation was observed for Honarvar module. It may be assumed from this observation, that sonographic modules with more foetal parameters incorporated into them were strongly correlated with the ABW. Interestingly, this correlation did not appear to impact directly on accuracy of the modules for estimating ABW in the study population.
For all the weight categories, the Hadlock BPD/AC/FL module had the highest accuracy for estimation of ABW, as it had the least systematic error. This finding is similar to the systematic error of 1.0% reported in the study from Lagos, Nigeria [2]. However, the Hadlock BPD/AC/FL module overestimated the actual birth weights in the Lagos study, unlike in this study where the module underestimated the birth weight. Two other studies by Shittu AS et al., and Melamed N et al., also observed minimal underestimation of the birth weight using the Hadlock BPD/AC/FL module; which was similar to the present findings [8,10]. Furthermore, the systematic error of Hadlock BPD/AC/FL module was closely ranked in accuracy, to those of Hadlock BPD/AC and Hadlock AC/FL modules; the post-hoc test demonstrated that these values did not differ significantly. This concurred with the observation that Hadlock formulae, irrespective of the number of parameters, consistently showed lower systematic errors and higher the number of parameters used, the less the random error, and consequently a higher accuracy [6,10-12]. The present study findings showed that the three Hadlock modules had comparable accuracy for the determination of actual birth weight in the study environment.
The Nzeh BPD/AC/FL+SDI module had the least accuracy as shown by the high bias and over-estimation of the ABW, which significantly differed from those of all other modules. This observation is inconsistent with the report of Nzehand colleagues, that their two modules (Nzeh BPD/AC/FL/SDI and Nzeh BPD/AC/FL without SDI) showed higher systematic accuracy for foetal weight estimation compared with the other four modules reviewed [11]. The addition of SDI in one of the Nzeh formula was to minimise the underestimation of birth weight, especially when ultrasound scan to delivery interval was more than six days; this was not seen in the present study. It is very probable that population differences between subjects used for the various studies were responsible for this disparity. There are few studies, using their own generated module, which showed that actual weights of neonates were predicted more accurately when SDI was within ≤7 days [10,22]. The present study assessed the accuracy of Nzeh module in cooperating SDI, relative to other modules, and not the impact of SDI on the accuracy of each of the modules.
For most modules tested in this study, more than 70% of the EFW were within 10% of the ABW, except Honarvar and Nzeh BPD/AC/FL+SDI modules which had lower proportions. This finding is not surprising because a review of 26 regression formulae showed that most of the modules had 80% and above of their estimates within 10% of ABW [10]. It is known that the systematic (mean percentage) error is a better test of accuracy when compared to proportion within 10% [10], and hence it is expected that higher proportions within 10% of the ABW will be observed in modules that had the least systematic error. The present study results conformed to this by showing the highest proportions for Hadlock BPD/AC and Hadlock BPD/AC/FL, both of which had the least systematic errors. Furthermore, the three Hadlock formulae used in this study were among the four modules with more than 70% of their EFW within 10% of ABW, which supports the earlier observations made about the accuracy of Hadlock modules [2,6,9-11].
When the various EFWs for ABW within normal birth weight category was subjected to the same accuracy measures as above, the observed values for the percentage (systematic) error and proportion of births within 10% of ABW were similar to those obtained for the general population. This could be attributed to the high frequencies of ABWs and EBWs observed in the normal birth weight category of more than 95% of the sample population. Thus, this finding suggests that modules that showed overall high accuracy as discussed above, are equally very accurate for the estimation of normal birth weights in the study population.
With respect to sensitivity and specificity tests of the six modules to estimate normal birth weights, values obtained [Table/Fig-7] did not clearly indicate which module had the highest accuracy, making their ranking difficult. Hence, the need to include the ROC curve [Table/Fig-8] as a measure of accuracy in this study - the area under the ROC curve [Table/Fig-9] was significant for four of the modules viz., the three Hadlock modules and the Nzeh without SDI. This was consistent with the accuracy as reflected by the proportions of estimates within 10% of ABW, for this study.
Hadlock BPD/AC module had the highest area under the curve, which implied highest accuracy for the estimation of normal birth weight in the study population. All three Hadlock formulae showed similar significant areas under the curve and so it can be assumed that their overall accuracy is comparable. This also reflects the initial finding that there was no significant difference in the systematic error among the three Hadlock modules [Table/Fig-6]; though the Hadlock AC/FL module consistently showed the least accuracy out of the three Hadlock modules.
For this study, while the Hadlock modules maintained fairly consistent levels of accuracy with respect to the different measures, the accuracy of Nzeh without SDI module varied with each measure of accuracy employed. In contrast, the Nzeh+SDI module showed low levels of accuracy for most of the measures of accuracy. Incidentally, the earliest the Nzeh BPD/AC/FL+SDI formulae can determine EFW is at the onset of labour or delivery by caesarean section, which rules it out as a tool in the planning of deliveries. The Honarvar module showed the least correlation with birth weight and had a low accuracy for ABW in most of the measures. The module is based only on the FL, which has been shown to depend on growth rates of foetuses within the ethnic groups [3,21]; it is possible that the study population may have faster growth rates of the femur which may explain significant overestimation of birth weight observed with this module. This assumption is worth studying further since most of the sonographic formulae currently employed in study area incorporate FL based on the report of Hadlock FP et al., [12]. Inclusion of FL into the module improved the accuracy because of the inaccessibility of the engaged foetal head before delivery. This argument may not apply to the study population because foetal head engagement usually occurs during labour in black women.
Several studies have assessed the accuracy of various sonographic modules, yet a consensus has not been made on which modules foetal weight should be estimated [1,5]. Two studies, Dudley NJ, and Melamed N et al., which reviewed many modules, explained that this discordance between previously reported studies were a result of limiting factors such as sample size, small number of modules or avoidable sources of error [6,10]. The modules used in any vicinity may eventually depend on how accurately the modules have been shown to estimate the foetal weight, over time.
Limitation
This study was limited by its sample size as there was inadequate power for some sub-group analyses. Hence, using the modules to estimate extreme categories of birth weights (low birth weight and macrosomia) was not possible. Larger sampled, multi-centre studies in the Igbo population are therefore recommended.
Conclusion
In conclusion, this study has shown that for antenatal women in Enugu, Nigeria, the Hadlock BPD/AC/FL and Hadlock BPD/AC modules consistently showed higher accuracy than other modules for the estimation of birth weight for all new-borns. On the other hand, the Honarvar and Nzeh+SDI modules showed the least accuracy for estimation of birth weight, using most of the measures of accuracy. Since Hadlock BPD/AC requires less number of parameters and invariably less time to measure, it is therefore recommended for routine foetal weight estimation in busy ultrasound centres.
*p-value of the association between actual birth weight and the corresponding sonographic module for estimated foetal weight
†Correlation analysis between actual birth weight and the EFW from each sonographic module
*Significant p-value <0.05
The modules are sorted in descending order of accuracy as reflected by systematic error.
*ID-Indeterminate
*P<0.05 is significant