Betatrophin, a small 22 kDa protein is a member of Angiopoietin-like proteins (ANGPTLs) family composed of eight types (ANGPTL1 to ANGPTL8) isoforms mainly produced by the liver, White adipose tissues (WAT) and Brown adipose tissues (BAT) [1-3]. Betatrophin has been reported to be involved in regulation of plasma Triglyceride (TG) level via direct and/or indirect interactions with ANGPTL3 that inhibits Lipoprotein lipase (LPL) activity [1,4]. This inactivation of betatrophin is a potential therapeutic target for hyperlipidemia or obesity cases.
To determine how its expression varies in different illnesses, betatrophin level was studied in several conditions. The betatrophin levels were observed to be elevated in subjects with Metabolic Syndrome (MS), Insulin Resistant (IR), Type-2 Diabetes (T2D), Gestational Diabetes Mellitus (GDM) and overt and subclinical hypothyroidism [5-10]. In addition, studies confirmed that betatrophin levels were significantly higher in overweight and obese subjects [7,11,12].
Limited studies are available on the role of betatrophin in pregnancy that report contradictory results [9,13-17]. While some studies stated that betatrophin levels were elevated in pregnancy, others showed that betatrophin levels were decreased progressively during pregnancy, and one study reported that no significant difference was observed in betatrophin level between pregnancy and the postpartum period [9,13-17]. The association of betatrophin with TG in pregnancy also remains inconclusive, and further studies are required to assess the relationship of Thyroid hormons(THs), Thyroid stimulating hormone and Estradiol (E2) with betatrophin in pregnancy [9,13-17].
Literature suggests that the significant difference in metabolism between normal weight women and overweight/obese women during pregnancy can be accounted to the mass of adipose tissue gained before pregnancy [18-22]. Studies report a gradual decrease in mass of adipose tissue for women who enter pregnancy with high BMI and no change or slight increase in the mass of adipose tissue for women who enter pregnancy with normal BMI [20,21]. Betatrophin as adipokine causes an increase in the mass of adipose tissue by inhibiting LPL activity. Thus, implying that the body mass index and/or mass of WAT storage prior to pregnancy (pre-BMI) might be the cardinal factors that influence betatrophin level during pregnancy.
Based on these findings, the present study was conducted to elucidate the effect of preBMI on betatrophin level during normal pregnancy, and to study its relationship to TG, THs, TSH and E2. To the best of our knowledge, this is the first study in which the effect of preBMI on betatrophin levels, and the correlations of betatrophin with thyroid and lipid parameters were evaluated in three trimesters of pregnancy.
Materials and Methods
The present cross-sectional study comprised of pregnant women visiting the Maternity Hospital, Zakho for routine check-up between December 2016 and May 2017. A total of ninety participants (30 for each trimester) with Fasting blood sugar (FBS) <95 mg/dL (according to the diagnostic criteria of hyperglycaemia, World Health Organisation 2013) were enrolled for the study after a clinical examination by certified medical staff. Cases with a history and/or family history of diabetes, gestational diabetes, thyroid dysfunction, hyperlipidemia, hypertension or hypotension, as well as multiple pregnancies were excluded. Our study was in agreement with the guidelines of Ethics Committee of the Maternity Hospital, Zakho (IEC number 384 on 20th November 2016). The nature and purpose of this work were explained to all the women enrolled in this study, and written consent was obtained.
A standard questionnaire regarding lifestyle, previous gynaecological history, gestational weeks, height, weight prior to pregnancy (women who did not know their weight before pregnancy were excluded) and weight during pregnancy was filled by all the participants, following which the total number was reduced into 59. The participants were divided according to the pre-gravid BMI into; normal weight/lean women (PL) (pre-BMI ≤24.9 kg/m2, Age=24.03±3.79 years) and overweight/obese women (PO) (pre-BMI >25 kg/m2, 9 of them were obese; pre-BMI was > 30 kg/m2, Age=27.6±3.94 years). The samples population for PL included 10 women in FT, 10 women in ST and 12 women in TT. The sample size for PO included eight women in FT, 10 women in ST, nine women in TT.
Married employees of reproductive age with normal FBS levels were enrolled as NPW (control group). The control group was divided according to the BMI into two groups; 10 non-pregnant normal weight/lean women (NPL) and 12 non-pregnant overweight/obese women (NPO). The sample size for this study was calculated with 80% power at a 5% level of statistical significance.
Blood samples were collected aseptically and then allowed to clot for 30 minutes in serum-separating tubes at room temperature. The sera were obtained by centrifugation and directly stored at -70°C until further analysis. All the parameters were measured according to the manufacturer’s kit instructions.
Circulating C-terminal and full-length betatrophin concentration was estimated using sandwich ELISA (Aviscera Bioscience, Santa Clara, CA, USA, catalogue No. SK00528-08). Serum Estradiol (E2) level was measured by competitive ELISA (Accubind, USA, product code: 4925-300). Serum TSH concentration was estimated using sandwich ELISA (diagnostic, Germany, catalog No. BDTSO3-BA), while circulating total triiodothyronine (T3) and total thyroxin (T4) was estimated using competitive ELISA (bioactive diagnostic, Germany, catalog No. BDT301-BA, BDT402-BA, respectively). Serum TG level was estimated by the glycerophosphate oxidase colorimetric method using automatic analyzer (biolis24i, Tokyo Boeki Medical System, cormay kits) in Bedar Hospital Laboratory, Zakho.
Statistical Analysis
Data were analysed by the Statistical Package for Social Science (SPSS) (IBM SPSS Statistics, version 25). The normality of data was tested by Shapiro-Wilk test, and all data were expressed as Mean±Standard Deviation (SD). Homogeneity of variances was tested by Levene test. Independent t-test and Mann-Whitney test were used for statistical comparisons between pregnant women (PW) and non- pregnant women (NPW) of both groups, one- way analysis of variance (ANOVA), Welch test (for normally distributed data) and Kruskal wallis test were performed to compare within groups as well as Games-Howell test for the post-hoc multiple comparisons. Pearson (for parametric variables) and Spearman (for non-parametric variables) correlation analysis were performed to find possible correlation between Betatrophin and other hormones. The p-value <0.05 was considered statistically significant.
Results
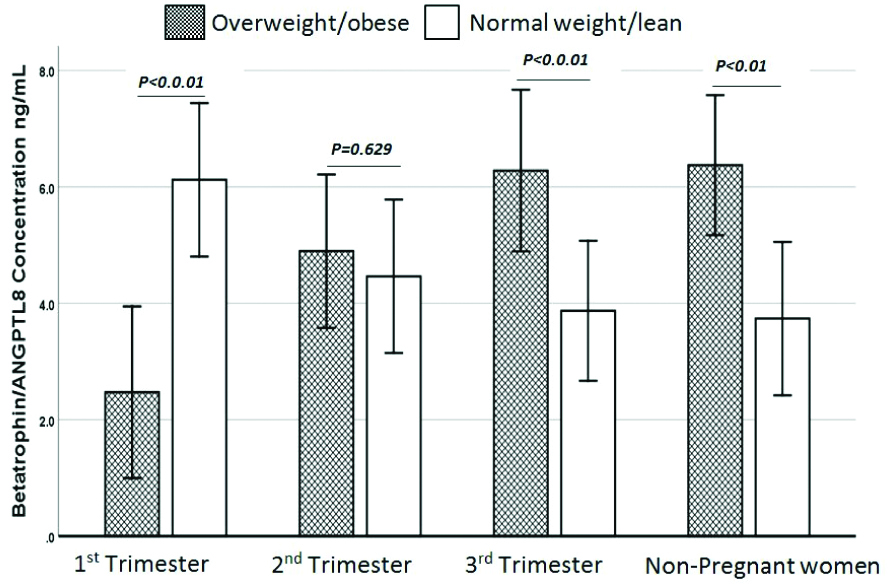
Circulating betatrophin levels were increased by 21.3% in PL as compared to NPL (4.7±2.4 ng/mL, 3.73±0.96 ng/mL, respectively). In PL women, betatrophin levels decreased with progression of pregnancy (FT: 6.1±3.44 ng/mL, ST: 4.46±1.96 ng/mL and TT: 3.87±1.32 ng/mL) [Table/Fig-1]. No correlations were observed between betatrophin and anthropometric and biochemical parameters in the PL group. However, betatrophin showed significant correlations with TSH in ST, with T3 in TT, with TG in ST, with T3 in NPL [Table/Fig-2]. Circulating betatrophin levels were significantly decreased in PO compared to NPO (4.6±2.4 and 6.37±2.4, respectively). In PO group, betatrophin levels increased with progression of pregnancy. Games-Howell test showed a significant decrease in FT versus ST, FT versus TT and FT versus NPO, the p-values were 0.017, 0.006 and 0.001, respectively. There was no significant difference between ST versus TT, ST versus NPO and TT versus NPO [Table/Fig-3]. A significant positive correlation was observed between betatrophin and T3, T4, E2, TG and GWG in PO [Table/Fig-4]. Circulating betatrophin levels in PL compared with PO were significantly increased in FT, and significantly decrease in TT but there was no significant difference in ST. As pregnancy progressed, betatrophin levels declined in PL but increased in PO. The betatrophin concentration was found to be significantly higher in NPO than in NPL (p-value <0.01) [Table/Fig-5].
Characteristic of the Normal weight/Lean women.
| Variables | FT (n=10) | ST (n=10) | TT (n=12) | p1 | PL (n=32) | NPL (n=10) | p2 |
|---|
| pre BMI (kg/m2) | 21.87±1.6 | 21.48±2.02 | 22.3±1.8 | a0.415 | 21.9±1.8 | *22.7±1.64 | t0.208 |
| BMI (kg/m2) | 22.24±1.6 | 23.4±2.1 | 27.1±2.1 | NC | 24.4±2.86 | NC | NC |
| Gestational week | 9.43±2.7 | 19.5±2.9 | 34.46±3.7 | NC | NC | NC | NC |
| GWG kg | 0.88±0.29 | 4.8±1.6 | 12.1±1.3 | NC | NC | NC | NC |
| Betatrophin (ng/mL) | 6.1±3.44 | 4.46±1.96 | 3.87±1.32 | w0.217 | 4.7±2.4 | 3.73±0.96 | m0.39 |
| TG (mg/dL) | 92.4±30.4 | 156.4±37.6 | 193.1±49.9 | w<0.0001 | 150.2±58 | 67±16.5 | t<0.0001 |
| TSH (μlU/mL) | 0.996±1 | 1.4±0.997 | 1.64±0.9 | a0.448 | 1.42±0.99 | 1.58±1.07 | m0.551 |
| T3 (ng/mL) | 1.74±0.54 | 1.92±0.63 | 2.2±0.63 | a0.197 | 1.97±0.61 | 1.7±0.67 | t0.242 |
| T4 (μg/dL) | 7.3±1.65 | 7.7±1.26 | 7.9±1.4 | a0.302 | 7.6±1.4 | 6.76±1.48 | t0.097 |
| E2(pg/mL) | 1140±891 | 4745±3272 | 8130±2253 | w<0.0001 | 4888±3708 | 216±143 | m<0.0001 |
Values are expressed as Mean±SD; pre-BMI: pregravid BMI; BMI: Body mass index; GWG: Gestational weight gained; TSH: Thyroid stimulating hormone; T3: Total triiodothyronine; T4: Total thyroxin; E2: Estradiol; FT: 1st trimester; ST: 2nd trimester; TT: 3rd trimester; PL: Pregnant normal weight/lean; NPL: Non-pregnant normal weight/lean; NC: Not calculated; *: represents BMI for NPL; n: Sample size; a represents one-way (ANOVA) test and wrepresents Welch test; trepresents Independent t-test and mrepresents Mann-Whitney test; p1 is p-value within groups; p2 is p-value between PL vs NPL. p<0.05 consider statistically significant
Correlation between betatrophin and anthropometric and biochemical parameters in normal weight/lean women.
| Variables | FT (n=10) | ST (n=10) | TT (n=12) | NPL (n=10) | PL (n=32) |
|---|
| r-value | p-value | r-value | p-value | r-value | p-value | r-value | p-value | r-value | p-value |
|---|
| TSH | s0.255 | 0.476 | °0.721* | 0.019 | °-0.173 | 0.59 | °0.131 | 0.719 | s0.156 | 0.395 |
| T3 | °-0.144 | 0.691 | °0.211 | 0.559 | °0.759** | 0.004 | °0.823** | 0.003 | s0.197 | 0.281 |
| T4 | °0.06 | 0.869 | °-0.009 | 0.981 | °-0.205 | 0.523 | °0.158 | 0.662 | s-0.1 | 0.586 |
| E2 | °0.177 | 0.625 | °0.109 | 0.764 | °0.053 | 0.87 | °0.387 | 0.27 | s-0.207 | 0.256 |
| TG | °0.37 | 0.292 | °0.68* | 0.031 | °0.296 | 0.351 | °-0.019 | 0.959 | s0.022 | 0.906 |
| GWG | °-0.369 | 0.294 | °0.41 | 0.24 | “0.236 | 0.461 | --- | ---- | s-0.266 | 0.141 |
FT: 1st trimester; ST: 2nd trimester; TT: 3rd trimester group; NPL: Non-pregnant normal weight/lean group; PL: Pregnant normal weight/lean group; r: Correlation coefficient; TSH: Thyroid stimulating hormone; T3: Total triiodothyronine; T4: Total thyroxine; E2: Estradiol; n: Sample size; °:Pearson correlation; s:Spearman correlation; GWG:Gestational weight gained; *p<0.05; **p<0.001
Characteristic of the overweight/obese women.
| Variables | FT (n=8) | ST (n=10) | TT (n=9) | p1 | PO (n=27) | NPO (n=12) | p2 |
|---|
| pre BMI (kg/m2) | 29.1±3.57 | 28.86±1.99 | 28.48±2.66 | k0.851 | 28.59±2.49 | *28.09±2.09 | m0.499 |
| BMI (kg/m2) | 29.45±3.64 | 30.4±2.0 | 32.96±2.3 | NC | 30.98±2.99 | NC | NC |
| Gestational week | 9.4±3.2 | 19.3±4.5 | 37.16±3.04 | NC | NC | NC | NC |
| GWG kg | 0.83±0.23 | 3.9±1.4 | 11.1±0.89 | NC | NC | NC | NC |
| Betatrophin (ng/mL) | 2.47±0.72 | 4.9±1.96 | 6.28±2.4 | w<0.0001 | 4.6±2.4 | 6.37±2.4 | m0.03 |
| TG (mg/dL) | 123.6±32 | 202±88.4 | 264.3±81 | w<0.001 | 199.6±90.7 | 98.5±35.3 | m<0.0001 |
| TSH (μlU/mL) | 1.89±0.97 | 1.1±0.62 | 1.47±1.18 | a0.312 | 1.47±0.96 | 1.28±0.76 | t0.557 |
| T3 (ng/mL) | 1.72±0.46 | 2.1±0.53 | 2.3±0.78 | a0.029 | 2.1±0.63 | 1.6±0.70 | t0.025 |
| T4 (μg/dL) | 6.97±1.08 | 8.07±1.68 | 8.6±0.91 | a0.021 | 7.9±1.4 | 7.1±1.2 | t0.101 |
| E2 (pg/mL) | 751.5±601 | 4286±2824 | 9365±3651 | w<0.001 | 4932±4393 | 174.4±110.7 | m<0.001 |
Values are expressed as Mean±SD. pre-BMI: pregravid BMI; BMI: Body mass index; GWG: Gestational weight gained; TSH: Thyroid stimulating hormone; T3: Total triiodothyronine; T4: Total thyroxin; E2: Estradiol; FT: 1st trimester; ST: 2nd trimester; TT: 3rd trimester; PO: Pregnant overweight/Obese; NPO, Non-pregnant Overweight/Obese; NC: Not calculated; *: represents BMI for NPO; n:Sample size; k represents Kruskal Wallis test; a represents one-way (ANOVA) test and w represents Welch test; t represents Independent t-test and m represents Mann-Whitney test; p1 is p-value within groups; p2 is p-value between PO vs NPO; p<0.05 consider statistically significant
Correlation between betatrophin and anthropometric and biochemical parameters in overweight/obese women.
| Variables | FT (n=8) | ST (n=10) | TT(n=9) | NPO (n=12) | PO (n=27) |
|---|
| r-value | p-value | r-value | p-value | r-value | p-value | r-value | p-value | r-value | p-value |
|---|
| TSH | °0.557 | 0.152 | °0.201 | 0.577 | °-0.574 | 0.106 | °-0.028 | 0.93 | s-0.243 | 0.222 |
| T3 | °0.562 | 0.147 | °-0.2 | 0.579 | °0.077 | 0.843 | “0.231 | 0.471 | s0.433* | 0.024 |
| T4 | °-0.272 | 0.515 | °0.22 | 0.541 | °0.614 | 0.079 | °0.563 | 0.057 | s0.499** | 0.008 |
| E2 | °0.125 | 0.769 | °-0.011 | 0.977 | °0.23 | 0.552 | °-0.477 | 0.116 | s0.609** | 0.001 |
| TG | °0.005 | 0.991 | °0.092 | 0.799 | °0.317 | 0.406 | °0.112 | 0.729 | s0.570** | 0.002 |
| GWG | °-0.046 | 0.914 | °0.653* | 0.041 | s-0.254 | 0.509 | ----- | ----- | s0.676** | 0.0001 |
FT: 1st trimester; ST: 2nd trimester; TT: 3rd trimester group; NPO: Non-pregnant overweight/obese; PO: Pregnant overweight/obese; r: Correlation coefficient; TSH: Thyroid stimulating hormone; T3: Total triiodothyronine; T4: Total thyroxine; E2: Estradiol; n: Sample size; °: Pearson correlation s: Spearman correlation; GWG: Gestational weight gained; *: p<0.05; **: p<0.001
Comparison of Betatrophin concentration between PL and PO subgroups and their relative counterpart NPL and NPO.
Independent t-test, p-value<0.05 statistically significant
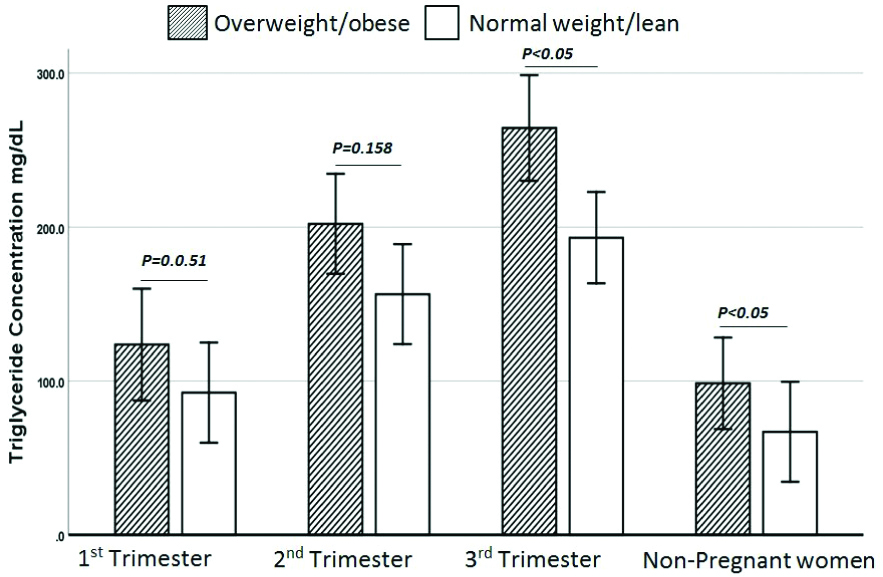
TG levels were elevated in all PO subgroups as well as NPO compared with PL subgroups and NPL. However, the differences were not statistically significant in FT and ST (p-value 0.051 and 0.158, respectively). The difference in TG levels was statistically significant in TT and NPO groups [Table/Fig-6]. E2, T3, T4 and TSH hormones did not show significant differences within PL subgroups and NPL and when compared with PO subgroups and NPO.
Comparison of TG concentration between PL and PO subgroups and their relative counterpart NPL and NPO.
Independent t-test, p-value<0.05 statistically significant
Discussion
Betatrophin primarily released by liver and adipose tissues, inhibits LPL activity through its interaction with ANGPTL3. The overexpression of betatrophin results in hypertriglyceridemia, while its inactivation leads to decrease in TG level, and reduction in adipogenesis and weight loss [1,3]. Various studies demonstrate the role of betatrophin in pathophysological process of pregnancy [9,13-17]. Abu-Farha M et al., found a significant increase in full-length betatrophin levels in 62 obese subjects when compared to 82 non-obese subjects [11]. Guo K et al., in a study on subjects with Normal Glucose Tolerant (NGT) showed that betatrophin levels were significantly higher in overweight subjects compared with lean subjects [12]. Zheng D et al., reported a positive correlation between betatrophin and BMI in 50 healthy non-pregnant women [14]. These findings are in agreement with our results that indicate that betatrophin levels were significantly higher in NPO compared with NPL. The elevation in obese subjects can be attributed to physiology mechanism to overcome the raise in circulating free fatty acids levels, or can be an instinctive response to expanding mass of WAT that produces betatrophin as a second endocrine organ in addition to the liver.
In the present study, it was found that the betatrophin levels were non-significantly elevated in FT of PL women as compared with NPL. However, these levels decreased as the pregnancy progressed. Similar findings were reported by Ebert T et al., where no significant difference in betatrophin levels was observed [9]. Both Zielinska A et al., and Martinez-Perez B et al., also reported gradual decrease in betatrophin concentration towards the prepartum period (the mediums of BMIs in FT were 21.6 and 24.75 respectively) in lean pregnant women. Betatrophin in TT was lower than the postpartum period [16,17]. Another study reported a significant increase in betatrophin level in TT of lean pregnant women as compared to lean non-pregnant women [14]. In line with our results, no correlation was observed between betatrophin and TG in any of these studies [9,14,16,17].
The change in betatrophin level during pregnancy in lean women can be ascribed to the alteration in metabolism. In lean women, the first half of pregnancy comprises of anabolic processes that require an increase in TG level by inhibiting LPL activity, and activating lipogenesis and increasing the accumulative fat index [18-20]. These processes attained increased secretion of betatrophin from the liver and adipose tissues. The second part of pregnancy in lean women is catabolic that leads to lipolysis by stimulating LPL activity to increase circulating fatty acids required for fetus growth [18,19]. Here, activation of LPL activity is achieved by reduction of betatrophin levels. Our results showed a significant decrease in betatrophin levels in FT of overweight/obese subjects as compared to NPO, and the levels of betatrophin were significantly increased with progression of pregnancy. Trebotic LK et al., in a small cohort study, compared the concentration of betatrophin in 19 normal pregnant women (gestational age was 5.6-6.5 months, the gestational BMI was 29.8±6.97) with 10 lean normal non-pregnant women, the result showed significant increase in betatrophin concentration in normal pregnant group compared with control group [13]. Due to high BMI of normal weight pregnant in ST, the reliability of his study remains debatable. Similar to our findings, Trebotic LK et al., also reported that betatrophin was positively and significantly correlated with estrogen or its natural isoform E2, TG and BMI/GWG [13]. Huang Y et al., also compared normal overweight pregnant with lean non-pregnant women. They found an increase of betatrophin level in gestation and a positive correlation with TG. Similarly to our result in OP, there is an increase in betatrophin level and there is a correlation between betatrophin and TG which was absent in lean pregnant women [15].
Contrary to lean pregnant women, early stages of pregnancy in obese women are catabolic, where activation of lipolysis stimulates LPL activity, lowers betatrophin level and increases circulating free fatty acids, resulting in a reduction in the WAT [18,19]. The increase in levels of free fatty acids in the second part of pregnancy increases secretion of betatrophin from the liver and adipose tissues to overcome the reduction in the mass of adipose tissue [20,21].
Evidence suggests that T3 induces betatrophin mRNA expression in HepG2 cells and regulates lipid metabolism through betatrophin gene activated autophagic process [23]. T3 stimulates LPL activity by regulating Apolipoprotein A-V (ApoA5) gene transcription [24]. Additionally, T3 in rat model was found to be negative regulator of ANGPTL3 that reduces ANGPTL3 mRNA expression [25]. These findings indicate stimulation of catabolism and regulate betatrophin secretion during pregnancy. THs reach their peak at about 20 weeks of gestation exactly when the catabolic processes start to predominate and their levels remain elevated until the end of pregnancy [26,27]. In our study, a positive correlation was observed between betatrophin and T3 in the third trimester in PL subgroup. Since the catabolic processes predominate in obese pregnant women, a positive correlation between betatrophin and T3 in PO was observed, indicating that betatrophin is correlated with T3 when LPL activity increases and/or when its level decreases. A good example of the variation in betatrophin level when the anabolic process predominates is the hypothyroidism cases. A study revealed that betatrophin increased in hypothyroidism subjects and correlated significantly with TSH and TG [10]. Zielinska et al. found an increase in betatrophin level in FT beside a positive correlation between betatrophin and TSH [16]. Also in PL and in ST group, we found that betatrophin was positively correlated with TSH and TG. We can elucidate that betatrophin correlates with TSH and TG when anabolic processes predominate more than catabolic processes.
While TG levels were elevated significantly with progression of pregnancy in both PL and PO women, the rising TG levels in PO were higher in all trimesters and reach significance in TT compared with PL. Actually, this difference can be attributed to rising betatrophin levels gradually to the end of pregnancy in PO subgroups. Whereas, in PL the most important factors to increase TG levels are the E2 and progesterone effect on hepatic LPL activity [28-29].
Limitation
The main limitation of this study was the reduction in the sample size of pregnant women enrolled due to the criteria set by the project. Similar studies with larger sample size are required. In addition, the association of betatrophin with THs needs be evaluated, especially in cases with hyperthyroidism. The cases to control ratio should be at least 1:1, but due to logistic limitations, it was not possible in our study.
Conclusion
We conclude that depending upon the pre-BMI, betatrophin levels change throughout the course of pregnancy. The levels of betatrophin depend upon T3 when catabolic processes predominate in PO and PL women and on TSH and TG when anabolic processes predominate in PL women. Thus, the study suggests that thyroid functions should also be taken into consideration while interpreting the results of betatrophin levels.
Values are expressed as Mean±SD; pre-BMI: pregravid BMI; BMI: Body mass index; GWG: Gestational weight gained; TSH: Thyroid stimulating hormone; T3: Total triiodothyronine; T4: Total thyroxin; E2: Estradiol; FT: 1st trimester; ST: 2nd trimester; TT: 3rd trimester; PL: Pregnant normal weight/lean; NPL: Non-pregnant normal weight/lean; NC: Not calculated; *: represents BMI for NPL; n: Sample size; a represents one-way (ANOVA) test and wrepresents Welch test; trepresents Independent t-test and mrepresents Mann-Whitney test; p1 is p-value within groups; p2 is p-value between PL vs NPL. p<0.05 consider statistically significant
FT: 1st trimester; ST: 2nd trimester; TT: 3rd trimester group; NPL: Non-pregnant normal weight/lean group; PL: Pregnant normal weight/lean group; r: Correlation coefficient; TSH: Thyroid stimulating hormone; T3: Total triiodothyronine; T4: Total thyroxine; E2: Estradiol; n: Sample size; °:Pearson correlation; s:Spearman correlation; GWG:Gestational weight gained; *p<0.05; **p<0.001
Values are expressed as Mean±SD. pre-BMI: pregravid BMI; BMI: Body mass index; GWG: Gestational weight gained; TSH: Thyroid stimulating hormone; T3: Total triiodothyronine; T4: Total thyroxin; E2: Estradiol; FT: 1st trimester; ST: 2nd trimester; TT: 3rd trimester; PO: Pregnant overweight/Obese; NPO, Non-pregnant Overweight/Obese; NC: Not calculated; *: represents BMI for NPO; n:Sample size; k represents Kruskal Wallis test; a represents one-way (ANOVA) test and w represents Welch test; t represents Independent t-test and m represents Mann-Whitney test; p1 is p-value within groups; p2 is p-value between PO vs NPO; p<0.05 consider statistically significant
FT: 1st trimester; ST: 2nd trimester; TT: 3rd trimester group; NPO: Non-pregnant overweight/obese; PO: Pregnant overweight/obese; r: Correlation coefficient; TSH: Thyroid stimulating hormone; T3: Total triiodothyronine; T4: Total thyroxine; E2: Estradiol; n: Sample size; °: Pearson correlation s: Spearman correlation; GWG: Gestational weight gained; *: p<0.05; **: p<0.001