The term NAFLD includes a wide spectrum of liver disorders ranging from steatosis to Non-alcoholic steatohepatitis (NASH) and cirrhosis [1,2]. NAFLD is the most common liver disease with an estimated prevalence of 9-32% in the general Indian population, with a higher incidence rate amongst obese and diabetic patients, and a 20-30% in the general population of western countries [3,4]. It also shares risk factors (e.g., age, physical inactivity, waist circumference, insulin resistance, dyslipidemia and high blood pressure) with other non-communicable diseases such as diabetes, obesity and metabolic syndrome [5,6]. Hence, more established screening tools for other non-communicable diseases like Diabetes- IDRS can be considered for screening of NAFLD.
The Indian Diabetes Risk Score (IDRS)- an established screening tool for diabetes was derived using four simple parameters, namely age, abdominal obesity, family history of diabetes and physical activity and is classified as low (<30), medium (30-50) and high (≥60) risk categories. It was initially shown to be useful to identify individuals with undiagnosed diabetes in the community [7]. Though previous studies [8] including a cohort of participants from Madras relate IDRS with the prevalence of NAFLD, no specific study involving the population of Gujarat- a population which is prone to diabetes [9] and other metabolic disorders have been done. Therefore, this study was undertaken to ascertain the role of IDRS in a population in Anand, Gujarat as a cost-effective screening tool for NAFLD.
Materials and Methods
A cross-sectional observational study was carried out from September 2016 to August 2017 in the Health Check-Up Department (Hello Health) at Shree Krishna Hospital, Anand, Gujarat, India. The department was chosen for the study population as it consists of patients who can afford the comprehensive health check-up plan which was needed to provide both baseline demographics and rule out the exclusion criteria. Out of the 243 individuals who voluntarily underwent their routine annual comprehensive Platinum Plan Health Check-up (including 2D Echo, Abdominal and Pelvic Ultrasonography (USG), Chest X-ray, Mammography, Electrocardiogram (ECG), Lipid profile, liver function test, Renal function test, Blood histogram with Differential counts, PT/INR, Vitamin-D3, Vitamin-B12 levels and consultation with a physician, surgeon, gynaecologist, dietician), 217 were included as participants in the study. Twenty six individuals were excluded for having either significant alcohol consumption (>30 mg/day–men, >20 mg/day-women) or a known history of hepatic disease/cirrhosis based on a physical assessment for signs and symptoms (anorexia, nausea, jaundice, vomiting, fatigue, arthralgia, fever and weight loss) of acute liver diseases, and USG scans on a GE Health Care of Logic P5 series machine by an experienced radiologist who has a working experience of >10 years on the same machine to minimise inter-observer bias.
For each participant in the study, various anthropometric, biochemical, and radiological parameters and IDRS score were recorded. Participants were classified as having NAFLD vs. No NAFLD using the USG parameters by the same radiologist. The USG parameters for diagnosis included: increased echogenicity of the liver texture, decreased penetration of sound, lack of visibility of vascular structures within the liver due to ill-defined portal walls, and an increased liver size in the mid-clavicular line >15.5 cm. IDRS score was calculated and applied to each participant along with a comparison of its ability to screen for NAFLD against already proven screening tools and risk factors associated with NAFLD.
Statistical Analysis
Using STATA (14.2), quantitative and qualitative data has been presented by descriptive statistics and frequencies respectively. Differences between the risk groups of IDRS were tested using the chi-square test and analysis of variance. Univariate analysis was performed to identify the factors associated with NAFLD, followed by a stepwise logistic regression analysis by introducing each factor individually into the model. A p-value <0.05 was considered to be significant.
Results
Based on the exclusion criteria, the data of 217 participants was analysed qualitatively and quantitatively. Participants were divided into age groups of 10-year intervals with the maximum number of participants (31.34%) belonging to 61-70 years, followed by 26.72% belonging to 51-60 years age groups. Mean age of the participants was 56.83±11.39 years. Gender distribution among participants was 118 (54.38%) females and 99 (45.62%) males. Survey of comorbidities and risk factors identified 75 (34.6%) as hypertensive, 42 (19.4%) as known cases of diabetes, 27 (12.4%) as freshly diagnosed diabetics, 9(4.1%) with dyslipidemia, 27 (12.4%) with hypothyroidism, and 17 (7.8%) with a history of Ischaemic Heart Disease.
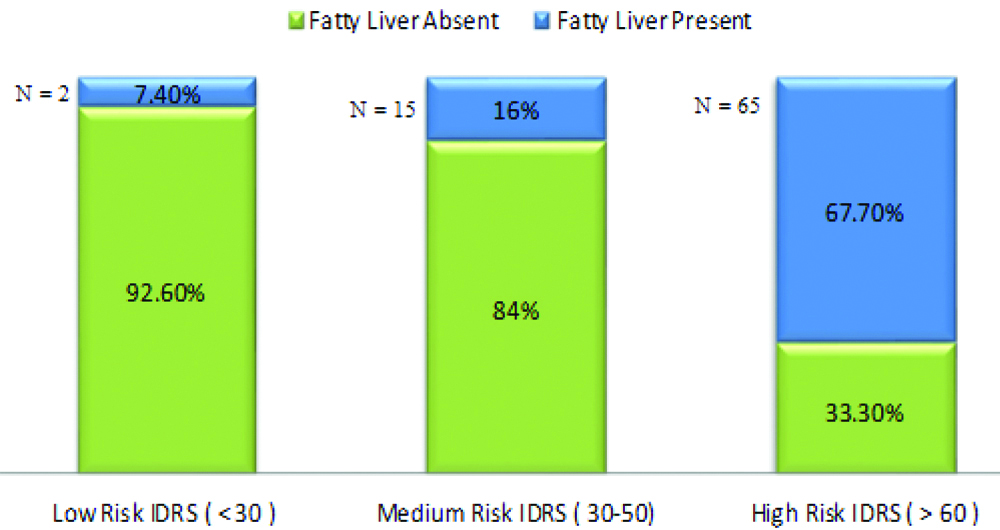
According to the Asian Criteria for BMI, maximum participants (36.87%) were distributed in the Pre-Obese category, followed by 22.12% in the Obese Type 1 category. According to the category, a maximum number of participants (44.24%) demonstrated high-risk IDRS scores with 43.22% demonstrating medium risk scores. Based on Ultrasonographic imaging of the liver, 82(37.79%) participants were diagnosed with fatty liver while 65(67.7%) exhibited a high-risk IDRS score and features of Fatty Liver [Table/Fig-1].
Participants diagnosed to have NAFLD vs. Non NAFLD in various IDRS risk groups.
Among patients with NAFLD, 56.25% belonged to 31-40 years age group, 42.55% in the 41-50 years age group, 38.38% were males, 37.28% were females, 56.52% were diabetic and 29.05% were non-diabetic. The mean values of the bioclinical parameters of the participants with NAFLD and without NAFLD were calculated. A significant statistical association was seen in BMI, Waist: Hip ratio, FBS, HbA1c, FBS, SGOT, SGPT/SGOT ratio [Table/Fig-2].
Bioclinical Characteristics of study participants in relation to whether the patient has NAFLD or not and based on Indian diabetes risk score.
| Parameter | NAFLD present | NAFLD absent | p-value | IDRS <30 (n=27) | IDRS 30-50 (n=94) | IDRS ≥60 (n=96) | p-value |
|---|
| BMI (kg/m2) | 31.09 (4.67) | 24.51 (2.96) | <0.001 | 22.47 (1.88) | 24.82 (3.15) | 30.40 (4.62) | <0.001 |
| Waist: Hip ratio | 0.99 (0.07) | 0.88 (0.07) | <0.001 | 0.84 (0.05) | 0.89 (0.06) | 0.98 (0.08) | <0.001 |
| Systolic BP (mm of Hg) | 129.46 (12.15) | 127.91 (14.69) | 0.817 | 120.44 (11.07) | 128.36 (11.51) | 129.19 (15.79) | 0.011 |
| Diastolic BP (mm of Hg) | 80.73 (7.42) | 79.11 (8.80) | 0.165 | 76.22 (7.34) | 78.96 (6.84) | 81.46 (9.48) | 0.007 |
| FBS (mg/dL) | 133.46 (57.35) | 108.04 (23.23) | <0.001 | 100.52 (13.53) | 114.56 (36.69) | 125.40 (48.90) | 0.014 |
| HbA1C (%) | 7.21 (1.76) | 6.44 (0.89) | <0.001 | 6.09 (0.37) | 6.61 (1.12) | 7.04 (1.61) | 0.002 |
| SGPT (IU/L) | 37.91 (30.46) | 38.16 (27.59) | 0.951 | 29.48 (17.31) | 41.95 (32.81) | 36.69 (26.30) | 0.112 |
| SGOT (IU/L) | 21.22 (9.63) | 26.00 (10.62) | <0.001 | 20.59 (5.93) | 26.56 (10.27) | 22.89 (11.25) | 0.008 |
| SGPT: SGOT ratio | 1.74 (0.77) | 1.44 (0.58) | <0.001 | 1.46 (0.64) | 1.50 (0.57) | 1.64 (0.77) | 0.223 |
| S. Total Cholesterol (mg/dL) | 182.17 (33.90) | 176.27 (36.80) | 0.240 | 170.74 (36.44) | 176.44 (39.97) | 182.71 (30.70) | 0.234 |
| S.Triglycerides (mg/dL) | 124.44 (81.44) | 109.19 (53.09) | 0.096 | 87.85 (44.73) | 112.20 (50.66) | 125.26 (79.82) | 0.027 |
| HDL (mg/dL) | 51.09 (11.55) | 54.31 (13.70) | 0.076 | 55.70 (14.82) | 54.33 (13.04) | 51.15 (12.25) | 0.129 |
| LDL (mg/dL) | 105.40 (27.52) | 100.86 (29.22) | 0.258 | 96.63 (27.67) | 100.83 (32.70) | 105.96 (24.09) | 0.241 |
A univariate analysis using NAFLD as a dependent variable and other covariates as independent variable was done with the 95% confidence interval, Odd’s ratio of >1 and statistical significance were observed in the following parameters: SGPT/SGOT ratio (OR-2.04, p=0.002), HbA1C (OR-1.57, p≥0.001), IDRS High risk as compared to Low Risk (OR-26.21, p≥0.001), BMI (OR- 1.74, p≤0.001), FBS (OR-1.01, p-value <0.01). From the statistically significant variables, a stepwise multiple logistic regression analysis was done using NAFLD as a dependent variable and these parameters. After negating the effect of other variables in this model, only three parameters had a statistically significant association with NAFLD viz., SGPT/SGOT ratio, BMI, and IDRS [Table/Fig-3]. If IDRS, BMI and SGPT/SGOT ratio are used in a model to diagnose NAFLD- the model would have 85.7% accuracy in diagnosing NAFLD.
A stepwise multiple logistic regression analysis done using NAFLD as the dependent variable and the various significant risk factors in univariate analysis as independent variables.
| Variable | NAFLD |
|---|
| Odds ratio | Confidence interval | p-value |
|---|
| SGPT/SGOT ratio | 2.90 | 1.44-5.87 | 0.003 |
| HbA1c | 1.19 | 0.89-1.60 | 0.25 |
| IDRS | 1.03 | 1.00-1.07 | 0.036 |
| BMI | 1.53 | 1.26-1.86 | <0.001 |
Discussion
The overall prevalence of NAFLD in India is 9%-32% with the present study reporting a NAFLD prevalence of 37.79%. Indian studies conducted by Das D et al., Singh SP et al., and Anbalagan VP et al., reported prevalence rates of 37.68%, 24.5%, and 24.7% respectively [8,10,11]. As the present study was conducted among supposedly healthy volunteers who were participating in the comprehensive health centre check-up, this may suggest the possibility of a higher prevalence of NAFLD in the Gujarati population compared to prevalence in another Gujarat based study [9].
A comparison of the demographic variables between the present study and two other Indian based studies is presented in [Table/Fig-4]. The higher age group in our study as compared to other studies may be attributed to the fact that there is a greater tendency to do health check-ups in the elderly. Though this implies an overall high IDRS score due to the age factor, the prevalence of NAFLD is still known to increase with an increase in age. The peak of NAFLD prevalence in the present study was present in the age group of 31-40 years, a finding supported by Das D et al., who had a mean age of fatty liver group as 41.5±14.5 years [8].
Comparison of demographic variables between three Indian based studies.
| Study variable | Present study | Das D et al., [8] | Anbalagan V et al., [11] |
|---|
| Mean age of participants | 56.83±11.39 years | 40.4±15.0 years | 40±11.9 years |
| Mean age of participants with NAFLD | 57.3±7.31 years | 41.5±14.15 years | |
| Prevalence of NAFLD | 37.79% | 37.68% | 24.7% |
| Gender distribution (M:F) | 45.62%: 54.38% | 62.13%: 37.87% | 45.2%: 54.8% |
| Gender distribution among fatty liver patients (M:F) | 38.38%: 37.28% | 37.5%: 38.5% | |
The present study showed no significant difference in the prevalence of NAFLD amongst males and females. However, on the basis of biopsy, and ultrasound imaging, Singh SP et al., Daryani N et al., and Amarapurkar D et al., found a male predominance in the incidence of NAFLD in their respective studies [10,12,13].
In the present study, a maximum number of the participants (36.87%) belonged to the Pre-obese category, 22.12% belonged to obese category and 2.76% belonged to morbidly obese category of Asian Criteria of BMI. Mean BMI of the participants was 27±4.89 kg/m2 with a mean BMI for participants with fatty liver of 31.09±4.67 kg/m2 and of those without fatty liver of 24.51±2.96 kg/m2 (p<0.001). As per National Family Health Survey 2015-16, 19.7% of the male population and 23.7% of the female population in Gujarat is obese in contrast to the 24.88% of obese participants of our study [14]. This may be explained by the fact that people attending the health check-up are from an affluent class of the society with a higher likelihood of them being overnourished than undernourished. However, studies re-iterate the fact that NAFLD is associated with raised BMI and hence obesity, with an increased BMI linked to a higher risk of NAFLD in many studies [13,15].
The IDRS scores in the present study were divided into Low Risk (<30), Medium risk (30-50) and High risk (≥60) groups which subsequently had 7.4% of the participants belonging to low-risk IDRS score with NAFLD, 16% of the participants belonging to medium risk IDRS score with NAFLD and 67.7% of the participants belonging to high risk IDRS score with NAFLD. In the study by Das D et al., the prevalence of NAFLD was significantly higher among participants with a high and medium IDRS (73.46% and 32.20% respectively) compared to those of low IDRS (10.25%) [8]. Similarly, in the study by Anbalagan VP et al., the prevalence of NAFLD was also significantly higher among participants with high IDRS (30.4%) and medium IDRS (21%) compared to those with low IDRS (15.8%) (p=0.022) [11]. This trend suggests that there is an evident increase in the prevalence of NAFLD in the population studied as there is an increase in their IDRS score.
In the present study, on comparing the bio-clinical characteristics of the various participants in relation to different categories of IDRS, statistically significant values (p<0.05) were obtained, implying that there is a statistically significant relationship between the increase in these parameters as compared to increase in IDRS score. This also reiterates the fact that NAFLD, obesity, diabetes, Metabolic syndrome and hypertension are all the part of the spectrum of the same syndrome. This relationship of the IDRS with these parameters also points towards the fact that IDRS may be used to detect risk factors of these metabolic disorders. As compared to other studies [8,11], parameters in the present study from the Univariate analysis of NAFLD suggest that as the value of these variables increase, the probability of these participant having NAFLD increases [Table/Fig-5].
Bio-clinical characteristics of study participants in relation to different risk categories based on indian diabetes risk score in our study as compared to other Indian studies.
| Parameter | p-value for the trend in present study | p-value of the trend in the study by Anbalagan VP et al., [11] | p-value of the trend in the study by Das D et al., [8] |
| BMI (kg/m2) | <0.001 | <0.001 | <0.001 |
| Waist: Hip ratio | <0.001 | - | - |
| FBS (mg/dL) | 0.014 | <0.001 | - |
| HbA1C (%) | 0.002 | <0.001 | - |
| SGPT (IU/L) | 0.112 | <0.001 | <0.001 |
| SGOT (IU/L) | 0.008 | 0.318 | - |
| S. Total cholesterol (mg/dL) | 0.234 | 0.004 | - |
| LDL (mg/dL) | 0.241 | 0.004 | - |
| NAFLD | 0.001 | 0.022 | - |
Though IDRS, HbA1C, SGPT/SGOT ratio and BMI were significant in the univariate analysis when these variables were considered for multiple logistic analyses as the independent variable against NAFLD and as the dependent variable HbA1C turned out to be non-significant in the diagnosis of NAFLD. However, Anbalagan VP et al., found that, HbA1C had a significant association with NAFLD [11]. This could be explained by the fact that the authors had studied non-diabetic individuals in the population while the present study included both diabetic and non-diabetic individuals, many of whom were already on oral hypoglycaemic agents or insulin therapy which would have altered the baseline HbA1C and hence, skewed its association with NAFLD in the index study.
Though multiple studies have related obesity with NAFLD there is not much literature about the use of BMI for the screening of NAFLD. In contrast, SGPT/SGOT ratio has been validated in multiple studies in the past for screening of NAFLD, and in the present study too, the ratio has been found to be significant in a stepwise logistic regression analysis in the screening of NAFLD [16]. Hence, the patients attending the inpatient and outpatient departments at hospitals can be offered these enzyme tests for screening of NAFLD, while BMI can be used as a screening modality of NAFLD in the community as per the present findings.
The score has previously been associated with NAFLD in Sikkim and in Chennai, however, there was no study to associate IDRS with NAFLD in the Gujarati population who are at a higher risk of metabolic disorders [8,11].
Limitation
About 1/3rd of the subjects were diabetic (either known or newly diagnosed) and among those with NAFLD, 56% were diabetic. There is no doubt that these two common conditions co-exist and that, there is a significant amount of unrecognised advanced NAFLD within asymptomatic diabetic patients. So, Diabetes Mellitus may prove to be a confounding factor in proposing a relationship between NAFLD and IDRS.
Conclusion
IDRS has been found to have a statistically significant association with NAFLD. Just four clinical parameters- age, waist circumference, family history of diabetes and daily activity status of the participants are required to calculate IDRS which in turn can be used to screen patients with NAFLD. Thereby the present authors propose that IDRS which virtually requires no financial or logistic resources can be used to screen individuals with NAFLD- following which the selected few can then be made to undergo more established and more sensitive tools of diagnosis of NAFLD such as imaging or biopsy.