Characterisation of Breast Cancer Lesions using Image Processing Based Technique
Yousif Mohmed Abdallah1, Nouf Hussain Abuhadi2, Dalia Bilal3
1 Associate Professor, Department of Radiological Science and Medical Imaging, College of Applied Medical Science, Majmaah University, Majmaah Riyadh, Saudi Arabia.
2 Assistant Professor, Department of Diagnostic Radiology, College of Applied Medical Science, Jazan University, Jazan, Saudi Arabia.
3 Assistant Professor, Department of Diagnostic Radiology, College of Applied Medical Science, Jazan University, Jazan, Saudi Arabia.
NAME, ADDRESS, E-MAIL ID OF THE CORRESPONDING AUTHOR: Dr. Yousif Mohmed Abdallah, Associate Professor, Department of Radiological Science and Medical Imaging, College of Applied Medical Science, Majmaah University, Majmaah-11952, Saudi Arabia.
E-mail: y.yousif@mu.edu.sa
Introduction
Characterisation of mammographs deliberates as influential approaches in cataloguing of breast tissues and tumour. In breast, unravelling of nearby tissues in the mammographs is one of the tough processing procedures. The existence of speckle noise in these mammographs boundaries makes the pathology analysis more difficult.
Aim
To characterise breast cancer lesions using different image processing algorithms in order to improve the mammographs and increase their diagnostic value.
Materials and Methods
This retrospective study aims to locate structures and lesions in breast images. The algorithms use the noise speckles deletion, augmentation and subdivision of the breast tissue and the background in mammographs. More precisely, it aims to ascribe a label to pixels within the mammographs that have the same graphic characteristics. The segmented images were associated with the binary image mask to the original mammograph. The Root-Mean-Square Error (RMSE) and Peak Signal-to-Noise Ratio (PSNR) were studied in images database. Both percentage match between ground truth and segmentation results were calculated.
Results
Percentage match measure of watershed algorithm was 96.60 (p<0.05) and Corresponding Ratio (CR) was 0.019 (p<0.05). The edge detection gave good and clear visualisation of the processed images that increased the diagnostic value of them.
Conclusion
The edge detection and water-marker technique are able to identify the breast lesions precisely and improves radiological analysis and diagnosis.
Image enhancement, Image processing, Mammography, Segmentation
Introduction
Breast tissue Characterisation is most significant computerisation methods that are used to investigate the breast lesions [1-3]. It provides important dynamic and static data such as the outline, location and magnitude of the lesion. Those methods can increase the insight and interpretation rate. Breast cancer develops in both fatty and tubular tissues [4,5]. Breast cancer is most common malignant disease in occurrence and second most common cause of death among women globally. Mammography is a radiological procedure to visualise the whole breast tissues [6-8]. Recently, mammography is used in the detection of early breast cancer stages and treatment monitoring. Medical imaging is a process of producing visible images of inner structures of the body for scientific and medicinal study and treatment as well [9-11].
Medical imaging includes both organic and radiology which use electromagnetic energies (X-rays and gamma), sonography, magnetic, scopes, thermal and isotopes imaging. There are many other technologies which are used to record information about the location and function of the body. Those methods have many limitations compared with those modulates which produce images. Annually billions of images are done globally for different diagnostic purposes. About half of them use ionising and non-ionising radiation modulates [12]. Those images were produced using fast processors and due to conversion of the energies arithmetically and logically to signals [13-15]. Those signals later convert to digital images. They represent the different types of tissues inside the body. The clinical image analysis incorporates numerous kinds of strategies and tasks, for example, image pick-up, interpretation, archiving, viewing and transference. The advanced pictures have a few advantages, for example, quicker and shabby handling, simple archiving and transference, prompt quality evaluation, various duplicating and quick proliferation and versatile control. The disadvantage of computerised image is misapplication copyright, failure to resize with protecting the quality, need enormous limit memory and need quicker processor for control [16]. Image processing is the use of computer to manipulate on digital image. It has many benefits such as elasticity, adaptability, data storing and communication. With the growth of different image resizing techniques, the images can keep efficiently. It has many sets of rules to perform into the images synchronously. The 2D and 3D images can process in multiple dimensions. The image processing was founded in 1960s [17]. In the 1970s with the development of computer system, the cost of image processing becomes less and fast. In the 2000s, the image processing becomes quicker, inexpensive and simple [18-22].
Materials and Methods
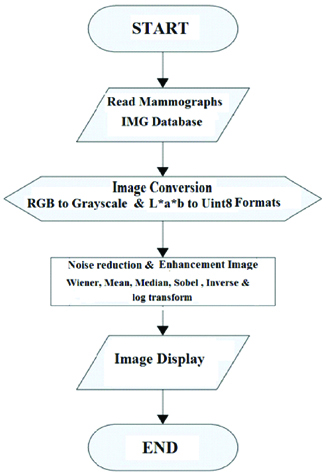
This retrospective study was conducted from November 2018 to January 2019. It aims to locate structures and lesions in breast images. More precisely, it aims to ascribe a label to pixels within the mammographs that have the same graphic characteristics. A sample of 100 mammographs was used in this study. Image processing program such as “MatLab” was used to perform both mathematical and logical operations in image scrutiny and characterisation. Mammography images comprise noise that makes the location and detection of suspicious tumour areas and breast tissue difficult. Consequently, the pre-processing operations are crucial to removing the noise and background in order to enhance the region of interest detection. Different resolution and contrast processes were used such as image modification, noise decline using Sobel, Canndy and Roberts’s edge detection techniques. Noise and wiener adjustment techniques are used widely in contrast enhancement. Those techniques adjust the quality of the breast tissue in order to make the carcinoid areas diagnosis easier. Mammographs contain many noise speckles that result in wrong determination of the lesion. The [Table/Fig-1] showed the Gaussian technique that was performed in the study. The variance and mean of the images were measured using Wiener techniques [Table/Fig-1].
Flowchart of Input, process and output of image enhancement techniques.
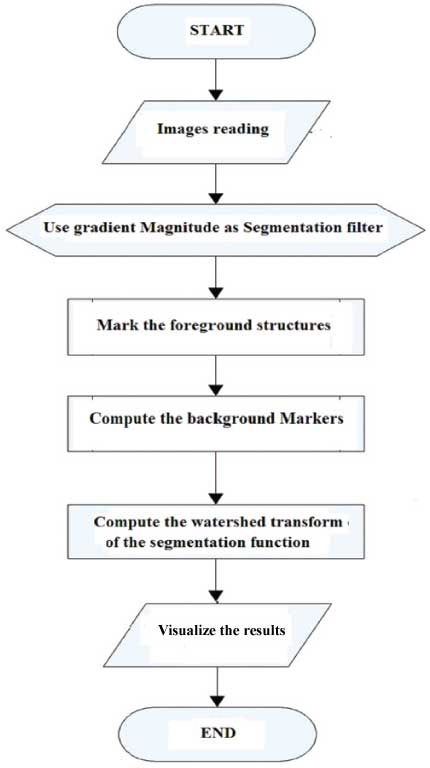
Input to, process, and output of Segmentation techniques.

Where η is the N-by-M local region of respectively pixel in the mammograph.
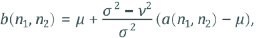
ν2 represents the noise alteration.
Watershed segmentation can detect the breast tissue efficiently and precisely. This technique analyses the mammographs as a topographical grey image and it draw the gradient scenery of the mammograph and outline watersheds once the inundating of separate indicators appointment with one another. Henceforth, the documentation of markers is incredibly crucial in breakdown the over-segmentation tough. The recommended technique was a texture-based technique that selected the marker levels for the water-level involvement [Table/Fig-2]. The mammographs were divided into 10 groups.
The Forward Algorism
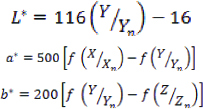
Where, Xn,Yn, and Zn are the Tristiulus values of the white point.
The RMSE was used to measure the variances between values that foretold by a model and the values detected. The RMSE assists to aggregate the extents of the faults in estimation of numerous times into a single amount of predictive power. RMSE is a measure of accurateness, to compare estimating errors of dissimilar models for a specific dataset and not between datasets, as it is scale-dependent. The RMSE calculates as follows:

Where:
θ represents the estimator
ϑ represents the estimated parameter
The PSNR block calculates the signal-to-noise ratio, in decibels, between two different images. This ratio was used as a quality measurement tool between the original and a processed image.
PSNR is calculated as follows:
Where: R: represents the maximum fluctuation in the input image data.
Results
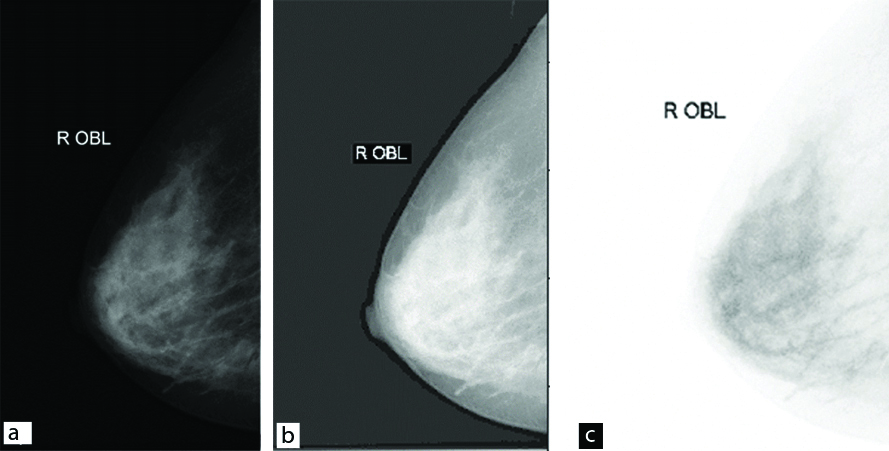
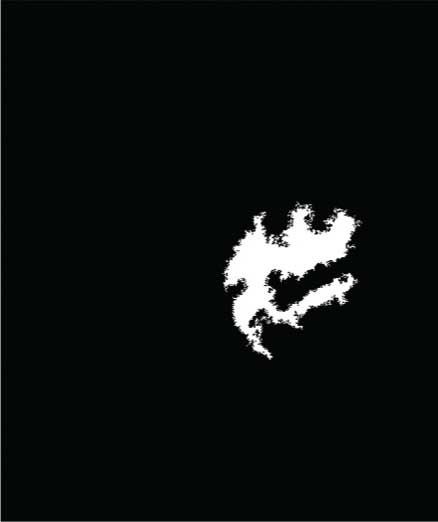
In pre-processing phase, the mammographs were read and stored as grey colored images. Then multiple algorithms were applied to binary converted images such as sharpen and log approaches. In this phase, the noise speckles were removed followed by median and log filter. Those techniques can give better results compared with the others. Those techniques work non-linearly to increased the quality of processed mammographs. The results got by the application scheme of detecting breast cancer as shown below in [Table/Fig-3,4,5,6,7,8 and 9].
Input to, process, and output of Image enhancement techniques: a) original image; b) Log transform; c) Inverse transform.
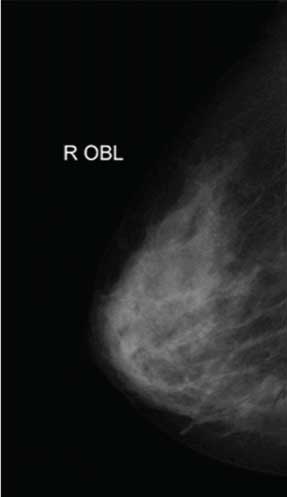
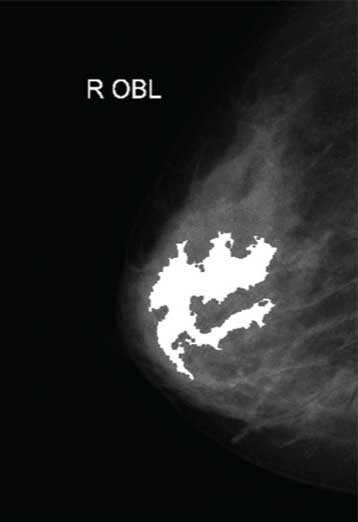
The original mammography image.
Opening close reconstruction algorithm.
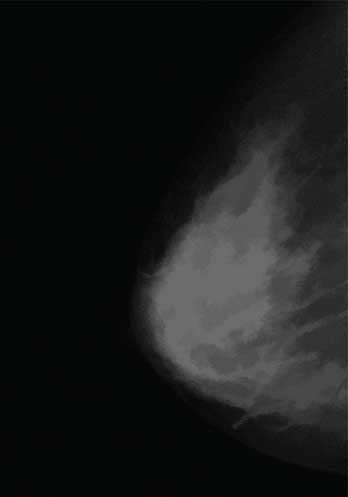
Opening close reconstruction algorithm.
Modified regional maxima superimposed on original image (fmg4).
Coloured watershed label matrix (Lrgb).
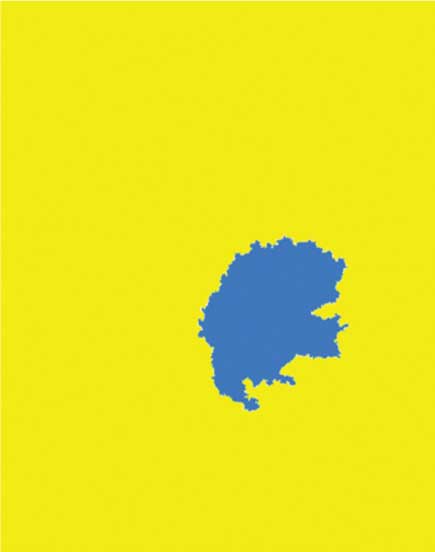
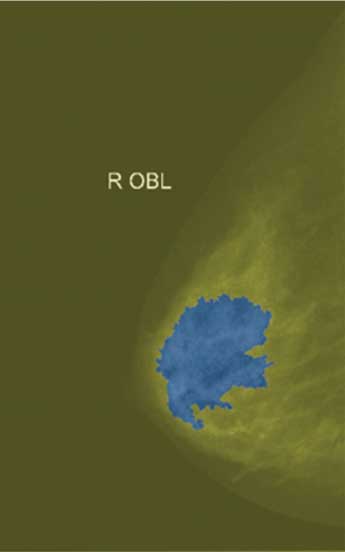
Lrgb superimposed transparently on original image.
Quantitative Analysis of Segmentation Results
The [Table/Fig-10] showed the comparison segmentation results on images, time taken, number of clusters, numbers of iteration, RMSE and PSNR for the segmented images. Group 7 and Group 9 had highest number of iterations amongst the studied image groups. The RMSE ranged between 0.5055 and 0.6003 while the SNR ranged between 48.620 and 51.008. The [Table/Fig-11] showed the quantitative analysis of the segmented mammographs which were 96.60 and 0.19 for PM and CR respectively. The [Table/Fig-12] showed breast segmentation methods according to the approaches used in this study compared with other authors’ methods and accuracy [23-29].
Comparison of Outcomes of segmentation results on images.
| Image group | Time taken | Number of clusters | Numbers of iteration | RMSE | PSNR |
|---|
| Group 1 | 0.43 sec. | 61 | 6 | 0.5431 | 48.623 |
| Group 2 | 0.31 sec. | 60 | 9 | 0.5951 | 49.012 |
| Group 3 | 0.47 sec. | 60 | 7 | 0.5763 | 48.961 |
| Group 4 | 0.56 sec. | 63 | 8 | 0.5102 | 48.620 |
| Group 5 | 0.36 sec. | 64 | 9 | 0.5055 | 48.751 |
| Group 6 | 0.43 sec. | 60 | 7 | 0.5310 | 49.521 |
| Group 7 | 0.51 sec. | 69 | 8 | 0.5642 | 50.123 |
| Group 8 | 0.63 sec. | 67 | 9 | 0.5341 | 51.008 |
| Group 9 | 0.69 sec. | 69 | 9 | 0.5961 | 48.753 |
| Group10 | 0.59 sec. | 68 | 8 | 0.6003 | 49.821 |
RMSE: Root-mean-square error, PSNR: Peak signal-to-noise ratio
The quantitative results of segmented mammograph.
| Case | GP1 | GP2 | Automated methods |
|---|
| PM | CR | PM | CR | PM | CR |
|---|
| Group1 | 94.43 | 0.75 | 96.28 | 0.35 | 98.77 | 0.87 |
| Group 2 | 90.11 | 0.31 | 82.17 | 0.56 | 92.51 | 0.91 |
| Group 3 | 82.53 | 0.63 | 91.08 | 0.12 | 95.01 | 0.58 |
| Group 4 | 87.88 | -1.01 | 96.36 | -0.99 | 98.95 | -1.21 |
| Group 5 | 94.39 | -2.15 | 91.87 | -1.13 | 99.12 | -1.99 |
| Group 6 | 91.37 | 0.61 | 93.02 | 0.51 | 97.82 | 1.64 |
| Group 7 | 90.43 | -0.43 | 94.77 | -0.45 | 98.32 | -0.91 |
| Group 8 | 85.07 | 0.32 | 95.60 | 0.65 | 94.99 | 2.04 |
| Group 9 | 90.38 | -0.92 | 98.62 | -0.82 | 98.82 | -0.98 |
| Group 10 | 89.99 | 0.62 | 89.51 | 0.75 | 91.75 | 0.95 |
| Mean | | | | | 96.606 | 0.19 |
Breast segmentation methods according to the approaches used in this study compared with other authors’ methods and accuracy [23-29].
| Authors | Methods | Accuracy |
|---|
| Present study | breast muscle segmentation Noise removal
| 96.6% |
| Ma Y et al., [23] | Label elimination Image improvement
| 90.4% |
| Raba D et al., [24] | = breast muscle | 98% |
| Zhang Z et al., [25] | segmentation | 98.8% |
| Chen Z et al., [26] | Noise removal | |
| Wei K et al., [27] | Contrast improvement | 95.7% |
| Raba D et al., [24] | Artifacts removal | 88.2% |
| Mustra M et al., [28], Rahmati P et al., [29] | FCLAHE for image improvement | |
Discussion
The [Table/Fig-3,4,5,6,7 and 8] show the segmented images associate the binary image rough Mask to the original mammograph. Both of percentage match between ground truth and segmentation results were calculated. Those results were high compared by many other author results such as Abdallah Y, [19]. Breast tissues characterise using watershed segmentation methods. Those methods could delineate the breast lesions precisely. Noise speckles deletion and water-marker algorithms of the breast tissues those were used in this study gave high matching ratio with low amounts of SNR and high RMSE associating with other researchers such as Qin X et al., Abdallah Y, and Bushra M et al., [17,19,21]. Authors recommended in their study that the contrast using the FCLAHE technique would increase contrast and discernibility of the mammographs could upsurge using noise reduction by local contrast enhancement procedures [28]. The proposed techniques by this study showed high matching rates compared with the manual scrutiny of the images by physicians. Thus, utilisation of those algorithms would enhance the images precisely in short period. The combination of the image improvement techniques and segmentation would improve the Characterisation of the breast tissue and reduce the noise to lesser level. This method was precise, quiet and easy to be applied in large mammographs databases. In this paper, the proposed method is a combined method, which can be easily used to characterise the breast tissues and lesions. The results of this study were different than Loukas C et al., who evaluated the pattern of the breast tissue beneath high and low magnifications and Tomar RS et al., who used Neural network, wavelet, symbolic logic, biological process approach and eventually hybrid system, which employs integration of on top of technique [30,31]. This method was more precise, quieter and easier to be applied in large mammographs databases.
Limitation
Although the use of powerful image analysis tools and expert judgment is a common method of studying and characterising the breast tissues, this study does not provide a complete picture of other breast disorders and other breast imaging modalities which were not studied.
Conclusion
This study concluded that pre-processing procedures could improve the mammographs prior characterisation of breast structures using watershed approach. The future work should include large databases and multiple imaging modalities. This study discovered the k-means technique that can be beneficial for breast tissue characterisation. This study will help the researchers to uncover the critical areas of breast cancer automatic detection that many researchers were not able to explore.
Authors’ Contribution
All authors conceived of the presented idea. YA developed the theory and performed the computations. YA and NHF verified the analytical methods. YA supervised the findings of this work. All authors discussed the results and contributed to the final manuscript.
[1]. Liu J, Zhuang X, Wu L, An D, Xu J, Peters T, Gu L, Myocardium Segmentation from DE MRI using Multi-component Gaussian Mixture Model and Coupled Level SetIEEE Trans Biomed Eng 2017 1(99):01-10. [Google Scholar]
[2]. Abdallah Y, Application of Analysis Approach in Noise Estimation, Using Image Processing ProgramLambert Publishing Press GmbH & Co. KG 2011 :123-25. [Google Scholar]
[3]. Abdallah Y, Yousef R, Augmentation of X-rays images using pixel intensity values adjustmentsInternational Journal of Science and Research (IJSR) 2015 4(2):2425-30. [Google Scholar]
[4]. Abdallah Y, Increasing of Edges Recognition in Cardiac Scintography for Ischemic PatientsLambert Publishing Press GmbH & Co. KG 2011 :123-25. [Google Scholar]
[5]. Liu Y, Li C, Guo S, Song Y, Zhao Y, A novel level set method for segmentation of left and right ventricles from cardiac MR imagesConference Proceedings IEEE Engineering Medicine Biology Society 2014 47:19-22. [Google Scholar]
[6]. Feng C, Zhang S, Zhao D, Li C, Simultaneous extraction of endocardial and epicardial contours of the left ventricle by distance regularized level setsMed Phys 2016 43(6):274110.1118/1.494712627277021 [Google Scholar] [CrossRef] [PubMed]
[7]. Ammar M, Mahmoudi S, Chikh MA, Abbou A, Endocardial border detection in cardiac magnetic resonance images using level set methodJ Digit Imaging 2012 25(2):294-306.10.1007/s10278-011-9404-z21773869 [Google Scholar] [CrossRef] [PubMed]
[8]. Sun L, Lu Y, Yang K, Li S, ECG analysis using multiple instance learning for myocardial infarction detectionIEEE Transactions on Biomedical Engineering 2012 59(12):3348-56.10.1109/TBME.2012.221359722929363 [Google Scholar] [CrossRef] [PubMed]
[9]. Wang L, Chitiboi T, Meine H, Günther M, Hahn HK, Principles and methods for automatic and semi-automatic tissue segmentation in MRI dataMAGMA 2016 29(2):95-110.10.1016/B978-0-12-802045-6.00013-2 [Google Scholar] [CrossRef]
[10]. Islam MK, Haque A, Tangim G, Ahammad T, Khondokar M, Study and Analysis of ECG Signal Using MATLAB and LABVIEW as Effective ToolsInternational journal of Computer and Electrical engineering 2012 4(3):404-08.10.7763/IJCEE.2012.V4.522 [Google Scholar] [CrossRef]
[11]. Lu X, Yang R, Xie Q, Ou S, Zha Y, Wang D, Nonrigid registration with corresponding points constraint for automatic segmentation of cardiac DSCT imagesBiomed Eng Online 2017 16(1):3910.1186/s12938-017-0323-128351368 [Google Scholar] [CrossRef] [PubMed]
[12]. Hong-tu Z, Jing Y, The Wavelet Decomposition and Reconstruction Based on the MATLAB, Proceedings of the Third International Symposium on Electronic Commerce and Security Workshops(ISECS)College of Computer Science & Technology 2010 (10):143-45. [Google Scholar]
[13]. Qin X, Cong Z, Fei B, Automatic segmentation of right ventricular ultrasound images using sparse matrix transform and a level setPhys Med Biol 2013 58(21):7609-24.10.1088/0031-9155/58/21/760924107618 [Google Scholar] [CrossRef] [PubMed]
[14]. Qin X, Wang S, Shen M, Zhang X, Lerakis S, Wagner MB, Register cardiac fiber orientations from 3D DTI volume to 2D ultrasound image of rat heartsProc SPIE Int Soc Opt Eng 2015 9415:pii: 94152M10.1117/12.208231726855466 [Google Scholar] [CrossRef] [PubMed]
[15]. Dormer J, Qin X, Shen M, Wang S, Zhang X, Jiang R, Determining Cardiac Fiber Orientation Using FSL and Registered Ultrasound/DTI volumesProc SPIE Int Soc Opt Eng 2016 9790:pii: 97901510.1117/12.221729627660384 [Google Scholar] [CrossRef] [PubMed]
[16]. Abdallah Y, Hassan A, Segmentation of brain in MRI images using watershed-based techniqueInternational Journal of Science and Research (IJSR) 2015 4(1):683-88. [Google Scholar]
[17]. Qin X, Wang S, Shen M, Lu G, Zhang X, Wagner MB, Fei B, Simulating cardiac ultrasound image based on MR diffusion tensor imagingMed Phys 2015 42(9):5144-56.10.1118/1.492778826328966 [Google Scholar] [CrossRef] [PubMed]
[18]. Muhammad N, Bibi N, Jahangir A, Mahmood Z, Image denoising with norm weighted fusion estimatorsPattern Analysis and Applications 2018 21(4):1013-22.10.1007/s10044-017-0617-8 [Google Scholar] [CrossRef]
[19]. Abdallah Y, Increasing of edges recognition in cardiac scintigraphy for ischemic patientsJournal of Biomedical Engineering and Medical Imaging 2016 2(6)10.14738/jbemi.26.1697 [Google Scholar] [CrossRef]
[20]. Muhammad N, Bibi N, Qasim I, Jahangir A, Mahmood Z, Digital watermarking using Hall property image decomposition methodPattern Analysis and Applications 2018 21(4):997-1012.10.1007/s10044-017-0613-z [Google Scholar] [CrossRef]
[21]. Bushra M, Nazeer M, Muhammad S, Tanzila S, Amjad R, Extraction of breast border and removal of pectoral muscle in wavelet domainBiomedical Research 2017 28(10):01-03. [Google Scholar]
[22]. Abdallah Y, Segmentation of heart tissues using gathering and colour analysis techniquesBiomed Res- India 2017 28(6):01-04. [Google Scholar]
[23]. Lu X, Dong M, Ma Y, Wang K, Automatic mass segmentation method in mammograms based on improved vfc snake modelScienceDirect 2015 :201-17.10.1016/B978-0-12-802045-6.00013-2 [Google Scholar] [CrossRef]
[24]. Raba D, Oliver A, Mart J, Peracaula M, Espunya J, Breast segmentation with pectoral muscle suppression on digital mammogramsIn: Pattern Recognition and Image Analysis 2005 :471-78.10.1007/11492542_58 [Google Scholar] [CrossRef]
[25]. Zhang Z, Lu J, Yip YJ, Automatic segmentation for breast skin-lineIn: 2010 10th IEEE International Conference on Computer and Information Technology 2010 1604:159910.1109/CIT.2010.283 [Google Scholar] [CrossRef]
[26]. Chen Z, Zwiggelaar R, A combined method for automatic identification of the breast boundary in mammogramsIn: Biomedical Engineering and Informatics (BMEI), 2012 5th International Conference 2012 :12510.1109/BMEI.2012.6513144 [Google Scholar] [CrossRef]
[27]. Wei K, Guangzhi W, Hui D, Segmentation of the breast region in mammograms using watershed transformationIn: Engineering in Medicine and Biology Society, 2005. IEEE-EMBS 2005. 27th Annual International Conference 2006 :6500-03. [Google Scholar]
[28]. Mustra M, Bozek J, Grgic M, Breast border extraction and pectoral muscle detection using wavelet decompositionIn: EUROCON 2009, EUROCON’09. IEEE 2009 :1426-33.10.1109/EURCON.2009.5167827 [Google Scholar] [CrossRef]
[29]. Rahmati P, Hamarneh G, Nussbaum D, Adler A, A new preprocessing filter for digital mammogramsIn: Image and Signal Processing 2010 :585-92.10.1007/978-3-642-13681-8_68 [Google Scholar] [CrossRef]
[30]. Loukas C, Kostopoulos S, Tanoglidi A, Glotsos D, Sfikas C, Cavouras D, Breast cancer Characterisation based on image classification of tissue sections visualised under low magnificationComput Math Methods Med 2013 2013:82946110.1155/2013/82946124069067 [Google Scholar] [CrossRef] [PubMed]
[31]. Tomar RS, Singh T, Wadhwani S, Bhadoria SS, “Analysis of Breast Cancer Using Image Processing Techniques,”2009 Third UKSim European Symposium on Computer Modeling and Simulation, Athens 2009 :251-56.10.1109/EMS.2009.103 [Google Scholar] [CrossRef]