Dengue is a severe, flu-like febrile illness caused by an arbovirus that affects infants, children and adults equally [1]. In India, the incidence of dengue has been on rise since 2006. One of the worst outbreaks occurred in 2015 in Delhi.
It follows an incubation period of 4-10 days after the bite from an infected mosquito of the genus Aedes aegypti [2]. Haematology analyzers along with routine complete hemograms provide VCS white cell positional parameters which have been reported to be of clinical utility in few benign and malignant diseases. Each of the normal White Blood Cell (WBC) type has a characteristic volume, conductivity, and light scatter. Variations from normal values are thought to reflect cellular changes. The differences in cellular size and complexity for a particular cell type may be indicative of a potential disease process or specific morphological characteristics in various disease processes [3].
Zhu Y et al., introduced a new haematological parameter, the lymph index, based on Coulter LH750 lymphocyte positional parameters in order to distinguish bacterial cause of febrile illness from viral, the lymph index being significantly increased in the latter [4]. Sharma P et al., assessed the Coulter LH750 VCS parameters to differentiae malaria from dengue [5]. Choccalingam C found that the Coulter LH780 VCS parameters for acute febrile illnesses like dengue were significantly different from the malignancies like acute lymphoblastic leukaemia [6]. A study done by Jaykar HH et al., calculated the diagnostic validity of lymph index in diagnosing dengue by taking the cut-off value at 13.51 [7].
The aim of the present study was to evaluate the utility of VCS parameters and lymph index in the prediction of dengue.
Materials and Methods
The present study was a one year prospective study carried out in the Department of Pathology of a tertiary care hospital in Karnataka, India, from January 2017 to December 2017. The Institutional Ethical Committee clearance was obtained prior to commencement of the study. The demographic data and other relevant data were recorded from the medical records. Hundred cases of dengue diagnosed by IgM ELISA assays or NS1 antigen positivity and fifty controls consisting of normal blood picture were included in the study. Twenty five cases of malaria confirmed by demonstration of plasmodium in the peripheral blood smear were included as the differential diagnosis of acute febrile illness. The peripheral blood sample was collected after day 5 of the fever; and on day 2 to day 5 of fever, for the cases confirmed by IgM ELISA and by NS1 antigen respectively. The peripheral blood samples were collected in EDTA vacutainers.
The samples were analysed on automated analyser DxH 800 (Beckman Coulter Inc., Miami, FL, USA). The various parameters including the VCS parameters such as WBC histogram, Differential Count (DC) scatterplots and positional parameters for lymphocytes, neutrophils, and monocytes of dengue positive cases and control were recorded and analysed.
The lymph index was calculated using the formula: {Mean Lymphocyte Volume (LVM) × Standard Deviation of Lymphocyte Volume (LVSD)}/Mean Lymphocyte Conductance Mean (LCM) [4].
Statistical Analysis
The cut-off value of lymph index in the present study was taken as 13.51 [7]. Data was analysed using SPSS software version 23 and a p-value was calculated for each group by applying the statistical tool, the Mann Whitney U-test. A p-value of <0.05 was considered to be statistically significant.
Results
The present study included 100 dengue positive cases and 50 healthy controls and 25 cases of malaria. The age ranged from 17-81 years in dengue patients (mean: 44.2 years). Males were more commonly affected than females (male to female ratio: 1.5) in cases of dengue with males accounting for 60% of the cases.
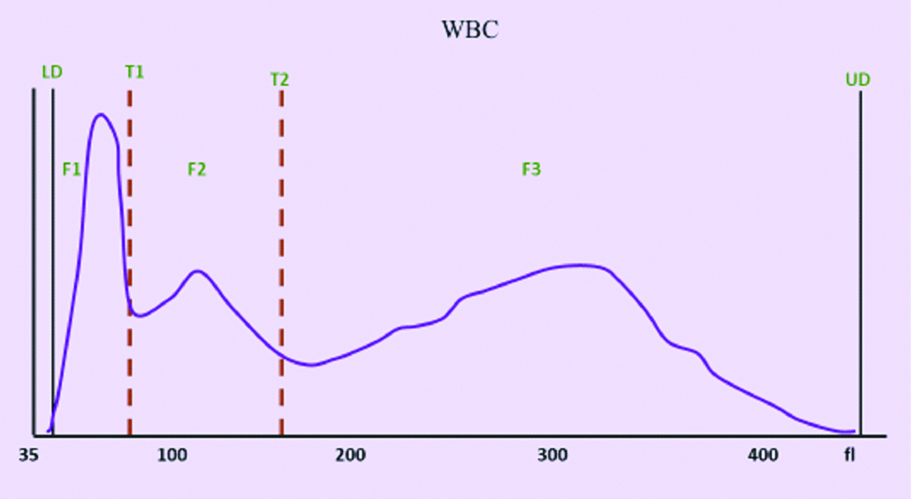
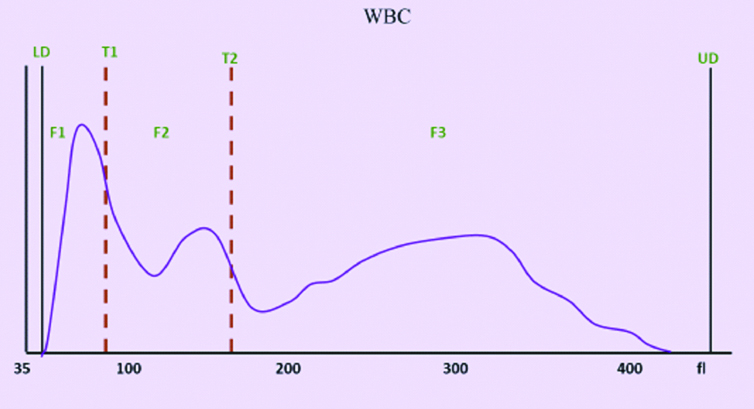
The WBC histograms were analysed in relation to normal histogram [Table/Fig-1]. The WBC histogram in dengue showed slight right shift of T1 trough (mean: 108 fL, range: 100 to 130 fL) and T2 trough (mean: at 180 fL). The F1 curve widened. However, the width of the F2 curve remained the same as the control group, but the curve shifted to the right, as shown in [Table/Fig-2].
WBC Histogram from a healthy donor shows LD at 30 fL, T1 at 78-114 fL, T2 at 150 fL, UD at 400 fL. The F1 peak represents lymphocytes, F2 peak represents monocytes, F3 peak represents neutrophils.
WBC Histogram from a patient of dengue shows shift to the right of T1 trough (at 100 to 130 fL), shift to the right of T2 trough (at 180 fL), widening of F1 curve, shifts to the right of F2 curve with normal width.
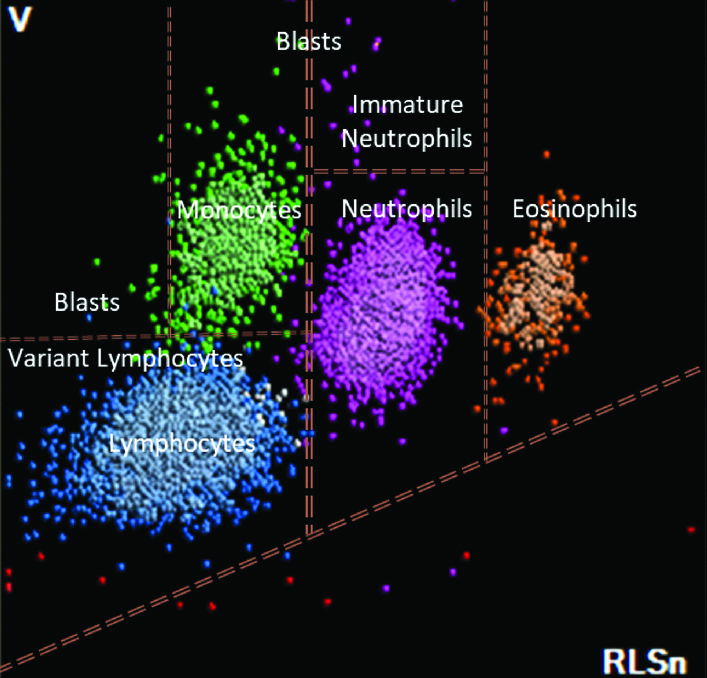
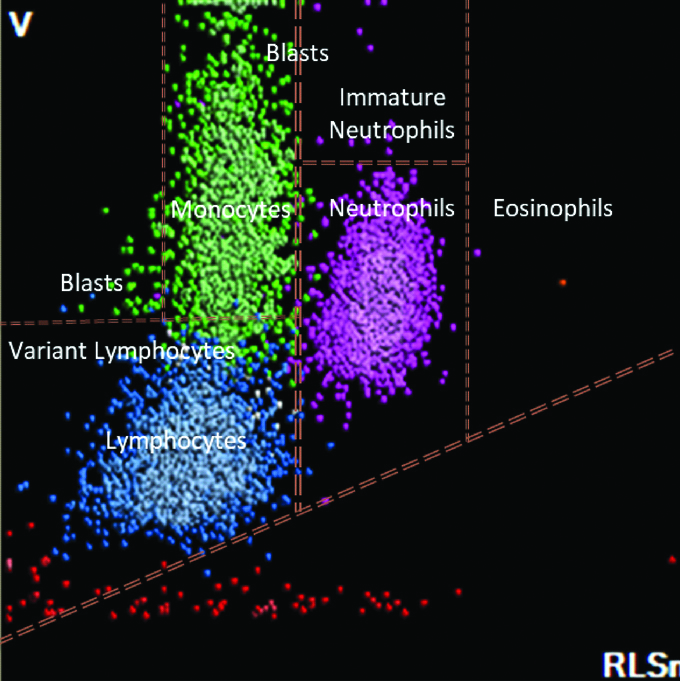
The DC scatterplot was studied in dengue in comparison to the normal control [Table/Fig-3]. In patients with dengue, the dots representing lymphocytes were seen extending into the variant lymphocyte window. The dots representing monocytes were seen extending into the blast window which is situated above the monocyte window, as depicted in [Table/Fig-4].
DC scatterplot with labelled WBC populations from a healthy individual. The blue dots represent lymphocytes, green dots represent monocytes, pink dots represent neutrophils and orange dots represent eosinophils.
DC scatterplot from a patient with Dengue which shows extension of lymphocytes into the variant lymphocyte window, extension of monocytes into the blast window.
The positional parameters of lymphocytes, neutrophils and monocytes in dengue, control and malaria group is shown in [Table/Fig-5,6 and 7]. The lymph index was calculated in patients with dengue, normal control and malaria and the comparison between them is depicted in [Table/Fig-8].
The VCS positional parameters for lymphocytes in the dengue and control groups.
| VCS positional parameters | Dengue (n=100) | Normal (n=50) | Malaria (n=25) |
|---|
| Mean±SD (Range) | Mean±SD (Range) | p-value | Mean±SD (Range) | p-value |
|---|
| LVM | 89.35±7.91 (63-120) | 86.1±3.52 (79-95) | 0.003* | 89.16±6.96 (78-103) | 0.913 |
| LVSD | 19.85±4.42 (10.38-44.94) | 14.88±1.79 (10.88-20.45) | <0.001* | 22.87±4.41 (14.84-29.74) | 0.002* |
| LCM | 108.51±6.68 (96-133) | 111.08±3.54 (106-120) | <0.001* | 110.12±2.52 (105-115) | 0.239 |
| LCSD | 9.90±3.90 (5.77-34.89) | 7.61±1.57 (5.25-13.59) | <0.001* | 12.81±3.62 (7.08-18.85) | 0.001* |
| LSM | 65.12±6.67 (48-96) | 62±9 (46-74) | 0.050* | 62.64±7.91 (49.77) | 0.112 |
| LSSD | 18.48±2.33 (12.89-27.51) | 19.31±2.41 (15.04-22.72) | 0.998 | 19..87±2.73 (15.01-25.07) | 0.011* |
*p-value significant; LVM: Mean lymphocyte volume; LVSD: Standard deviation of lymphocyte volume; LCM: Mean lymphocyte conductivity; LCSD: Standard deviation of lymphocyte conductivity, LSM: Mean scatter of lymphocyte; LSSD: Standard deviation of scatter of lymphocyte
The VCS positional parameters for neutrophils in the dengue and control groups.
| VCS positional parameters | Dengue (n=100) | Normal (n=50) | Malaria (n=25) |
|---|
| Mean±SD (Range) | Mean±SD (Range) | p-value | Mean±SD (Range) | p-value |
|---|
| NeVM | 147.28±8.52 (120-173) | 144.32±6.3 (131-170) | 0.007* | 157.56±9.76 (143-178) | <0.001* |
| NeVSD | 19.56±3.22 (14.87-30.00) | 16.54±1.45 (13.99-22.44) | <0.001* | 19.96±3.36 (15.90-28.82) | 0.582 |
| NeCM | 137.31±8.00 (125-170) | 143.92±3.85 (137-152) | <0.001* | 139.36±2.99 (132-144) | 0.211 |
| NeCSD | 5.29±1.07 (3.79-8.89) | 4.53±0.66 (3.52-6.43) | <0.001* | 4.88±0.48 (4.21-5.94) | 0.034* |
| NeSM | 138.57±5.04 (122-148) | 138±5 (128-145) | 0.095 | 134.2±7.39 (120-146) | 0.001* |
| NeSSD | 12.24±3.35 (8.21-27.87) | 10.76±1.73 (9.0-14.32) | 0.003* | 13.33±3.26 (10.13-23.33) | 0.146 |
*p-value significant; NeVM: Mean neutrophil volume; NeVSD: Standard Deviation of neutrophil volume; NeCM: Mean neutrophil conductivity; NeCSD: Standard deviation of neutrophil conductivity; NeSM: Mean scatter of neutrophil; NeSSD: Standard deviation of scatter of neutrophil
The VCS positional parameters for monocytes in the dengue and control groups.
| VCS positional parameters | Dengue (n=100) | Normal (n=50) | Malaria (n=25) |
|---|
| Mean±SD (Range) | Mean±SD (Range) | p-value | Mean±SD (Range) | p-value |
|---|
| MoVM | 183.16±15.88 (100-218) | 168.54±7.17 (158-198) | <0.001* | 191.48±12.87 (176-231) | 0.017* |
| MoVSD | 28.61±5.04 (16.63-45.76) | 18.64±2.44 (14.43-28.91) | <0.001* | 26.22±5.45 (21.45-37.40) | 0.039* |
| MoCM | 118.36±6.57 (108-142) | 120.74±3.72 (116-130) | <0.001* | 120.32±3.46 (110-126) | 0.152 |
| MoCSD | 8.52±11.96 (3.82-38.74) | 5.16±1.87 (3.89-17.02) | <0.001* | 7.41±5.13 (3.99-21.99) | 0.965 |
| MoSM | 82.81±7.11 (61-96) | 81.42±5.64 (65-90) | 0.063 | 81.2±10.37 (43-92) | 0.361 |
| MoSSD | 13.38±1.70 (10.35-21.07) | 13.07±1.82 (10.83-15.94) | 0.062 | 13.71±2.24 (9.58-18.7) | 0.418 |
*p-value significant; MoVM: Mean volume of monocyte; MoVSD: Standard deviation of volume of monocyte; MoCM: Mean Conductivity of Monocyte; MoCSD: Standard deviation of conductivity of monocyte, MoSM: Mean scatter of monocyte; MoSSD: Standard deviation of scatter of monocyte
Lymph index in dengue compared to normal.
| Category | Mean | SD | p-value (Compared to Dengue) |
|---|
| Dengue | 16.64 | 5.63 | |
| Normal | 11.56 | 1.68 | <0.001* |
*p-value significant
The sensitivity of lymph index in predicting dengue in the present study was 73% and the specificity was 88%.
The Positive Predictive Value (PPV) of lymph index in predicting dengue was 92.4% and the Negative Predictive Value (NPV) of lymph index in predicting dengue was 61.97%. The diagnostic validity of lymph index in predicting dengue is shown in [Table/Fig-9].
Diagnostic validity of lymph index in predicting dengue.
| Dengue serology | Total |
|---|
| Positive | Negative |
|---|
| Cut-off lymph index | >13.51 | 73 | 6 | 79 |
| <13.51 | 27 | 44 | 71 |
| Total | 100 | 50 | 150 |
Discussion
Early detection of dengue is crucial for timely intervention. In a case of unexplained fever, complete blood count is the first sought investigation. In patients with dengue viral infection, the quantitative deviation from normal limits is also accompanied by morphological changes within the leucocytes. Researchers have quantified these changes of VCS parameters and have found them useful in early detection and differentiation between bacterial, viral, malaria and dengue fevers [8-10]. In our study, we also evaluated patients with malaria, in view of it being most common differential for dengue fever.
In the present study, dengue was prevalent in males, similar to the findings of Anker M et al., [11].
The WBC histogram pattern in dengue was analysed. It showed a slight right shift of T1 trough (mean: 108 fL, range: 100 to 130 fl), with slightly widened F1 curve (range: 35 to 100-130 fL). This is accounted to the presence of lymphocytosis in dengue. Similar findings were reported by Choccalingam C [6].
Analysis of the DC scatterplot pattern in dengue showed extension of lymphocytes into the variant lymphocyte window, and extension of monocytes into the blast window situated above the monocyte window, as seen by other authors [6]. This change can be attributed to the presence of reactive lymphocytes in dengue, which are seen to localise to the variant lymphocyte window.
A significant increase in LVM (mean: 89.35±7.91), LVSD (mean: 19.85±4.42), LCSD (mean: 9.90±3.90) and LSM (mean: 65.12±6.67) was noted in dengue as compared to the normal control. A significant increase in LVSD (mean: 22.87±4.41), LCSD (mean: 12.81±3.62), LSSD (mean: 19.87±2.73) was noted in cases of malaria when compared to dengue. Increase in LVM reflected the presence of reactive lymphocytes with an increased volume. The LVSD was increased due to the variation in the size of lymphocytes, which is attributed to the presence of reactive change in few of the lymphocytes in dengue and malaria. The increase in LSM can be explained by the presence of pathological changes in the leucocytes which increased the complexity of the internal structure of the cell, resulting in an increase in the light scatter. Similar findings were reported by Justin J et al., [12].
However, the LCM (mean: 108.51±6.68) was significantly decreased in dengue when compared to the normal control. This can be explained by the presence of increased number of reactive cells, where the proportion of cytoplasm and nucleus decreases, thus reducing the conductivity of the cells.
A significant increase in NeVM (mean: 147.28±8.52), NeVSD (mean: 19.56±3.22), NeCSD (mean: 5.29±1.07) and NeSSD (mean: 12.24±3.35) was noted in dengue as compared to the normal control. The NeCM (mean: 137.31±8.00) was decreased in dengue when compared to the normal control. This decrease was found to be statistically significant. There was a significant decrease in NeVM (mean: 157.56±9.76) and a significant increase in NeCSD (mean: 4.88±0.48) and NeSM (mean: 134.2±7.39) when dengue was compared with malaria. It was similar to the findings of Raj BP et al., [13].
The MoVM (mean: 183.16±15.88), MoVSD (mean: 28.61±5.04) and MoCSD (mean: 8.52±11.96) were significantly increased in dengue as compared to the normal. These findings were comparable to a studies by Justin J et al., and Raj BP et al., [12,13].
In the present study, the MoCM (mean: 118.36±6.57) was decreased in dengue when compared to the normal control. This finding was significant, however in the study by Justin J et al., a significant increase in MoCM was reported [12]. When compared with malaria, MoVM (mean: 191.48±12.87) showed a significant increase while MoVSD (mean: 26.22±5.45) decreased significantly. These changes in positional parameters of neutrophils and monocytes are partially in agreement with the study by Sharma et al. The NeSM and MoVSD parameters showed opposite trend to the data published by Sharma P et al., and were showing similar changes in other positional parameters [5].
The lymph index was first formulated by Zhu Y et al., and was used for detection and differentiation of viral and bacterial infection, wherein they found that lymph index was mildly increased in bacterial infection, while it was significantly increased in viral infections like dengue [4].
The present study also found that there was a significant increase in lymph index (16.64) in dengue cases as compared to the normal control. A significant increase in lymph index in dengue was also reported by Ranjana H et al., who found the specificity to be similar (88%) while the sensitivity was lower (60%) as compared to the present study [8]. Present study also found out that lymph index in malaria was significantly higher than dengue. A higher specificity and sensitivity, 97.2% and 97.1% respectively, was found by Zhu Y et al., with the lymph index cut-off value of >12.92 [4].
The lymph index had a PPV of 92.4% and NPV of 61.97%, thus establishing the lymph index to be a fairly accurate parameter to predict dengue viral infection.
Limitation
The authors do realise that the study is not without its limitations. The VCS parameters for dengue patients is only compared to malaria due to the limitations of acquired data. The sample size though is statistically calculated, a larger cohort involving various causes of febrile illness would have given better differentiating characteristics for dengue.
Future recommendations of the study: The authors recommend the lymph index to be used as one of the screening parameters for dengue, while further studies on VCS parameters are to be conducted to establish differentiation of common causes of febrile illnesses.
Conclusion
In dengue, the WBC histogram showed slight right shift of T1 trough, with slightly widened F1 curve. The DC scatterplot showed extension of lymphocytes into the variant lymphocyte window and extension of monocytes into the blast window above monocyte window. The mean LVM (89.35±7.91), LVSD (19.85±4.42), LCSD (9.90±3.90), LSM (108.51±6.68), NeVM (147.28±8.52), NeVSD (19.56±3.22), NeCSD (5.29±1.07), NeSSD (12.24±3.35), MoVM (183.16±15.88), MoVSD (28.61±5.04) and MoCSD (8.52±11.96) were significantly increased in dengue when compared to the normal control. The mean NeCM (137.31±8.00), LCM (108.51±6.68) and MoCM (118.36±6.57) were significantly decreased in dengue when compared to the normal control. All these positional parameters together with the lymph index (mean: 16.64) forms a fairly accurate screening parameter to indicate dengue infection.
*p-value significant; LVM: Mean lymphocyte volume; LVSD: Standard deviation of lymphocyte volume; LCM: Mean lymphocyte conductivity; LCSD: Standard deviation of lymphocyte conductivity, LSM: Mean scatter of lymphocyte; LSSD: Standard deviation of scatter of lymphocyte
*p-value significant; NeVM: Mean neutrophil volume; NeVSD: Standard Deviation of neutrophil volume; NeCM: Mean neutrophil conductivity; NeCSD: Standard deviation of neutrophil conductivity; NeSM: Mean scatter of neutrophil; NeSSD: Standard deviation of scatter of neutrophil
*p-value significant; MoVM: Mean volume of monocyte; MoVSD: Standard deviation of volume of monocyte; MoCM: Mean Conductivity of Monocyte; MoCSD: Standard deviation of conductivity of monocyte, MoSM: Mean scatter of monocyte; MoSSD: Standard deviation of scatter of monocyte
*p-value significant