Introduction
Low Birth Weight (LBW) is an important decisive factor for most of the neonatal deaths, hence, Birth Weight (BW) is essential to identify immediately after birth for neonate survival and post-natal growth. The proper neonatal care and logistics are not available in every situation, especially in non-institutional or home deliveries bear’s difficulties to identify the relative risks of intra-uterine growth retardations and/or of newborns LBW.
Aim
To identify the surrogate anthropometric measurements of Birth length (BL) and Head circumference (HC) as a proxy measure of newborns LBW and determine the operational cut-off points among the Bengali Hindu population of Kolkata, West Bengal, India.
Materials and Methods
A total of 495 newborn BW data were collected from the hospital records from August 2016 to March 2017. Data were collected among Bengali Hindu mothers completed full gestational periods and delivered a normal singleton newborn. The data comprises of BW, BL and HC which were recorded using standard anthropometric procedures. The data were analysed in terms of descriptive statistics, correlation coefficients, linear and Binary logistic regression (BLR) and AUC-ROC analysis using SPSS (version, 16.0).
Results
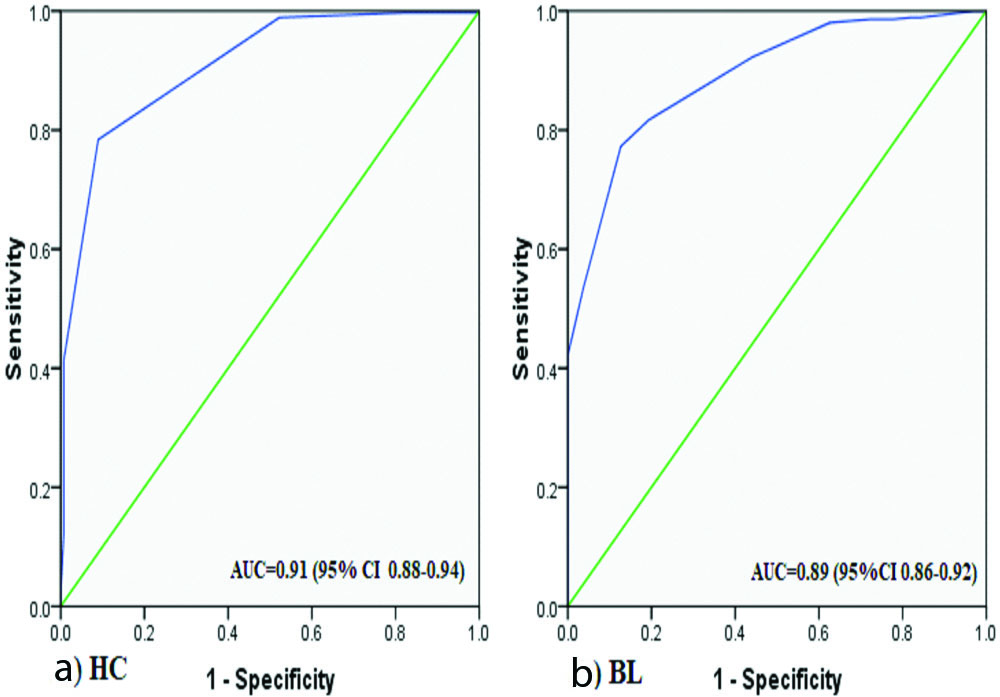
Out of 495 newborns included mean BW and LBW were 2.72±0.44 kg and 27.10%, respectively. The BW was correlated with BL (r=0.791) than HC (r=0.757) (p<0.001). Linear and BLR analysis showed that BL and HC exhibited significant influences on newborns BW (p<0.01). ROC-AUC analyses of BL (AUC=0.89, 95% CI 0.86-0.92) and HC (AUC=0.91, 95% CI 0.88-0.94) showed optimal surrogate indicators with LBW (p<0.01). The optimal cut-points for BL and HC to identify LBW newborns were <46.5 cm and <32.5 cm, respectively.
Conclusion
BL is the best suitable anthropometric measure followed by HC to predict LBW newborns. These proxies anthropometric indicators would help to identify the relative risks LBW and neonates requiring intervention in field situations.
Introduction
Birth Weight (BW) is measured as the outcome variable of intra-uterine growth which is considered to be one of the most vital processes of human life-cycle and its aberration can cause a profound effect on later life of a newborn [1]. The BW is considered the sensitive predictor of Intra-Uterine Growth Retardation (IUGR), newborns survival chance, long-term physical and psychological development [1,2]. It has negative implications for neonate survival, post-natal growth, cognitive development and anthropometric dimensions in different stages of lifecycle [3-5]. Low birth weight (LBW) is defined as a BW of <2500 gm regardless of the gestational period [3]. The LBW newborns’ are born due to pre-term gestational periods and/or secondary IUGR accounts for the greater mortality, morbidity and economic burden in population [3,4,6]. It is considered to be one of the major public health problems attributed to perinatal and neonatal mortality in developing countries including India [5,7-11]. It is estimated that out of 22 million newborns, about 16.0% of all babies born are LBW and 96.5% of them are found in the developing countries [4]. The highest prevalence of LBW (i.e., 27.0%) occurs in the sub-region of South-Central Asia, where India and Bangladesh have showen the highest prevalence of LBW (i.e., 30.0%) [4]. The LBW infants are 40 times more likely to develop the mortality risks within the first four weeks of life than Normal birth weight (NBW) [6]. Several socio-economic, demographic, lifestyle variables and maternal conditions (e.g., maternal age, gestational age, maternal nutrition status or anaemia, anthropometric characteristics, body composition, pre-term or multiple pregnancies, maternal environment, physical activity and healthcare services) have greater risks of newborns LBW [8-12].
The LBW causes several ill-health conditions, perinatal survival, prenatal, neonatal and infant morbidity and mortality, developmental disabilities and illness among newborns and manifested as neurological disabilities, chronic diseases, retarded cognitive development and lower school achievement in children [5,12]. It is being considered as the high-risk factor of chronic diseases at later life (i.e., infant and children) resulting in more frequent morbidity, hospitalisations and outpatient visits [10,12]. It is evident that many deliveries of low-income countries are still taking place at home and the newborns are often not being weighed [5,13]. However, the relative risks of neonatal survival of these home deliveries, including maternal, fetal and neonatal mortality and morbidities were reported worse or higher than those occurring in the institutional deliveries [13-16]. The anthropometric measurements play a pivotal role in identifying the relative risk of LBW in newborns [5,7] and the measurements of Head circumference (HC), Mid-upper arm circumference (MUAC) [17,18], chest circumference, thigh circumference, BL or crown-heel length, crown-rump length and foot length [18,19] are used as proxy measures to identify the relative risk of newborns LBW [5,20-23]. Several researchers have reported that the chest circumference have the highest sensitivity followed by HC, MUAC, BL and foot length to predict the LBW [18,20,22]. The mortality of newborns born in rural areas was observed to be twice that in urban areas (i.e., 34 and 17 per 1,000 live births, respectively) with neonatal mortality rates exceeding than the national average in the poor and larger states (e.g., Madhya Pradesh, Uttar Pradesh, Odisha, Rajasthan, Jammu and Kashmir, and Chhattisgarh) in India [23]. In resource-poor settings, a large proportion of deliveries took place at home by traditional birth attendants and birth-weight is most often not been recorded [5,13,24]. Therefore, there is an urgent need to develop simple, inexpensive and practical anthropometric measures to identify the relative risks of newborn’s LBW. Moreover, India has recorded the unsatisfactory/poor progress in institutional maternal deliveries among vulnerable segments (e.g., rural) of the population [23,25,26]. Therefore, the early diagnosis and its relative risk of mortality and morbidity of LBW are considered being essential to provide any comprehensive initiative in order to improve the overall chances of newborns survival [5,20,22]. Hence, the present study was conducted to determine the prevalence of LBW, suitable surrogate and/or proxy anthropometric measurement (e.g., BL and HC) and the cut-off values to identify the relative risk of LBW newborns among the Bengali speaking Hindu population of West Bengal, India.
Materials and Methods
The present cross-sectional study was carried out from August 2016 to March 2017 in the MR Bangur Government Hospital, the district hospital of South 24 Paraganas, West Bengal, India. A total of 495 newborn births records and anthropometric measurements were recorded using standard anthropometric procedures [27]. The cases of non-institutional or home deliveries and mother who reported any chronic disease and/or any complications were excluded. However, the newborns born with the full gestational period was taken into consideration in this study. The calculation of sample size (N) was done using criteria of anticipated population proportion (i.e., LBW prevalence) of 34% [28], the minimum absolute precision of marginal error was 5% and the confidence interval (i.e., the maximum amount of tolerance) of 95% was taken into consideration. The standard equation was used to calculate sample size as follows:
N=(z/Δ)2p (1-p)where, p=0.34, Δ=0.05 and z=1.96.
The minimum number of subjects required for reliably estimation of the prevalence/effect in a health investigation was determined using the standard sample size estimation method [29]. Thus, the minimum sample size was estimated to be 345 for the present investigation. If the response rate considered being 75% at the sample size estimation is assured, therefore the minimum number required to be N=431.
Therefore, a total of 500 newborns were identified and initially approached for the present study and a total of 5 (1.00%) cases were excluded due to the listed selection criteria. Hence, final subject of the present research investigation comprised of 495 newborns of both cesarean and vaginal deliveries, which was found to be appreciably higher than the estimated sample size. There was no case of any macrosomic baby (≥4000 gm) in the analysed samples. The necessary permission of the present study was obtained from the Ethical Research Committee of University of Calcutta, Kolkata, and MR Bangur Government Hospital, South 24 Paraganas, West Bengal, India. The inform consent was obtained from the mothers/guardians before the collection of the anthropometric measurements among newborns. The present study was conducted in accordance with the ethical guidelines of human experiments as laid down the Helsinki Declaration [30].
Collection of Data
The present study was a hospital-based quantitative cross-sectional study, based on both hospital records and direct anthropometric measurements collection. The caste and religious beliefs of mothers were recorded at the time of admission and as per hospital register, only the data of the Bengali speaking Hindu population were selected for an identical and homogenous ethnic composition in this investigation. Mothers who delivered a normal singleton newborn completing full gestational period (i.e., 37 weeks) were included in the study. The mothers residing in the nearby rural and urban areas, belonging to lower and middle socio-economic strata predominatly participated. The collected data comprised of newborn sex, BW, BL and HC. The anthropometric measurements were obtained within 24 hours of birth by one of the authors. The BW of the newborn was recorded to the nearest of 50 gm by using standard neonatal weighing machine within 15-30 minutes of birth. The newborns crown to heel length naming as BL was measured by infantometer, with knees extended and soles to feet held against the footboard. HC was measured by placing measuring tape on glabella and posteriorly along the most prominent point opisthocranium using non-stretchable measuring tape the nearest to 0.1 cm [27].
Statistical Analysis
Data were analysed using the Statistical Package of Social Sciences (SPSS) (Version 16.0). The anthropometric variables were presented in terms of descriptive statistics {mean and standard deviation (SD)}. The sex specific-mean comparisons of the anthropometric variables were done using One-Way Analysis of Variance (ANOVA). Pearson’s correlation coefficient and linear regression analyses were done to examine the linear relationship between two or more continuous variables (e.g., BL and HC). The chi-square (χ2) analysis was done to assess the sex-specific prevalence of LBW among newborns. BLR analysis was fitted into estimating the odds of being an LBW which allows controlling the different independent variables. To create the dependency newborn BW of ≤2.49 kg was coded as ‘0’ and BW ≥2.50 kg and above were coded as ‘1’. The predictor variables used in the BLR model analysis the newborn’s BL and HC. Receiver operating characteristic curve (ROC) analysis was done to compare the overall predictability of anthropometric measurements (i.e., BL and HC) for the identification of LBW newborn and calculate the 95% confidence intervals of Areas Under the Curve (AUC) that was to determine the overall accuracy and the sensitivity of the cut-off points to identify best surrogate anthropometric measurement. Finally, the predictive performances of the cut-off points were calculated. A p-value of <0.05 and <0.01 were considered being significant and 95% Confidence Interval (CI) was used to show the strength of association between independent and dependent variables.
Results
The descriptive statistics of newborns BW and anthropometric variables are presented in [Table/Fig-1]. A total of 495 newborns were recorded and of the 241 (48.7%) and 254 (51.3%) were male and female newborn, respectively. The sex-specific mean BW was observed to be significantly higher among boys than girls in NBW (p<0.05), but found contrary in LBW (p<0.05). Sex-specific mean BL (48.01 cm vs. 47.54 cm) and HC (32.80 cm vs. 32.74 cm) was observed to be significantly higher among male than female newborns (p<0.05). Sex-specific mean differences were observed to be statistically significant in BW, BL and HC using ANOVA (p<0.05). The mean anthropometric variables of BW, BL and HC were observed to be significantly greater in NBW than LBW newborns (p<0.01). The results indicated that the mean BW was 2.72±0.44 kg and 134 (27.07%) newborn were found to be LBW [Table/Fig-2]. The sex-specific prevalence of LBW was observed to be insignificantly higher among boys (28.23%) than the girls (25.98%) (χ2-value: 0.179; p>0.05).
Descriptive statistics of birth weight, BL and HC among newborn.
| Variables | Overall | LBW (N=134) | NBW (N=361) | F-value |
|---|
| BW (kg) | 2.72±0.44 | 2.18±0.29 | 2.91±0.30 | - |
| BL (cm) | 47.77±3.42 | 44.50±2.81 | 48.98±2.75 | 255.54* |
| HC (cm) | 32.77±1.55 | 31.26±1.39 | 33.33±1.19 | 267.74* |
*p<0.001
Sex-specific classification of birth weight (NBW vs. LBW) among newborn.
| BW categories | Male (N=241) | Female (N=254) | Total (N=495) | Sex difference (F-value) |
|---|
| Frequency | Mean ±SD | Frequency | Mean±SD |
|---|
| NBW | 173 (71.78) | 2.96±0.31 | 188 (74.02) | 2.88±0.29 | 361 (72.93) | 5.936* |
| LBW | 68 (28.23) | 2.13±0.31 | 66 (25.98) | 2.25±0.22 | 134 (27.07) | 5.945* |
Values are in parenthesis indicates percentages, *p<0.05
Correlation Coefficients and Regression Analysis
Linear regression models analysis for BL and HC as independent variables and BW as the dependent variable were performed and results are depicted in [Table/Fig-3]. The anthropometric measurements were correlated with BW, the maximum correlation with BW was observed for BL (r=0.791; p<0.01) than HC (R=0.757; p<0.01). The BL had the lowest Standard error of the estimate (SEE) and it had a higher coefficient of determination (R2) when compared with HC (0.625 vs. 0.572). The results of the BLR analysis showed that anthropometric variables (e.g., BL and HC) exhibited significant influences on LBW (p<0.01) [Table/Fig-4]. The [Table/Fig-4] provides the regression coefficient (R), the Wald statistic and the Odds Ratio {(Exp (β)} for each variable. The Wald values of BL and HC are 96.39 and 95.67 and the odd ratios (β) are 0.50 and 0.14 for BL and HC, respectively (<0.001). The values of coefficient of domination were observed to be significantly higher in HC (R2=0.392) and HC (R2=0.352) with LBW using BLR analysis (p<0.01) [Table/Fig-4].
Linear regression equation for estimation of birth weight among newborn.
| Variables | Regression equation | R | R | t-value | p-value |
|---|
| BL (cm) | -2.175+0.102 (BL) | 0.791 | 0.625 | 28.42 | <0.01 |
| HC (cm) | -4.347+0.261 (HC) | 0.757 | 0.572 | 25.73 | <0.01 |
| BL (cm)+HC (cm) | -4.292+0.067 (BL)+0.117 (HC) | 0.847 | 0.718 | -19.18 | <0.01 |
Binary logistic regression analysis for estimation of birth weight among newborn.
| Variables | Regression equation | Wald | R2 | Exp (B) | p-value |
|---|
| BL (cm) | 31.10-0.69(BL) | 96.39 | 0.352 | 0.50 | <0.01 |
| HC (cm) | 62.27-1.95(HC) | 95.67 | 0.392 | 0.14 | <0.01 |
| HC (cm)+BL (cm) | 62.66-1.37 (HC)-0.42 (BL) | 95.98 | 0.436 | 0.37 | <0.01 |
ROC-AUC Curve Analysis and Sensitivity and Specificity
ROC analysis was performed to diagnose the accuracy of the different anthropometric measures (e.g., BL and HC) to predict the LBW showed that HC had the significantly greater than the BL predictability to identify the LBW newborns (p<0.01) [Table/Fig-5]. For each anthropometric measure, sensitivity and specificity for the ranged values were calculated and operational cut-off points determined by considering the value with the highest average of sensitivity and specificity. At the proposed cut-offs, HC has the lower sensitivity (78.4%) and higher specificity (81.0%) where BL has the higher sensitivity (81.7%) and lower specificity (80.6%) respectively for screening LBW newborns (p<0.01) [Table/Fig-6]. The best discrimination of LBW, as detected by ROC-AUC, was obtained by HC (AUC=0.91, 95% CI 0.88 to 0.94) followed by BL (AUC=0.86, 95% CI- 0.86 to 0.92). An optimum cut-off point was estimated to identifying LBW newborn were <32.5 cm and <46.5 cm for HC and BL, respectively. The Correct prediction percentage (CPP) in the determination of LBW based on ROC-AUC analysis showed that the overall CPP was observed to be higher in HC (91.0%) than BL (80.6%). Sex-specific CPP was ranging between 76.5% and 84.8% (in BL) and between 91.1% and 90.9% (in HC) among boys and girls newborn, respectively [Table/Fig-7].
ROC-AUC analysis to predict the sensitivity and specificity and cut-off estimation of anthropometric measurements for predicting LBW among newborn.
| Variables | Cut-off (cm) | LBW | NBW | Sensitivity | Specificity | AUC | SE | 95% CI | p-value |
|---|
| HC | <32.5 | 122 | 78 | 78.4% | 81% | 0.91 | 0.014 | (0.88-0.94) | <0.01 |
| BL | <46.5 | 108 | 66 | 81.7% | 80.6% | 0.89 | 0.015 | (0.86-0.92) | <0.01 |
ROC-AUC analysis of HC (A) and BL (B) with the birth weight or LBW among newborns.
Correct prediction percentage (CPP) in determination of LBW based on ROC-AUC cut-off analysis among newborns.
| Variables | Male (N=68) | Female (N=66) | Total (N=134) |
|---|
| BL (cm) | 76.5 | 84.8 | 80.6 |
| HC (cm) | 91.1 | 90.9 | 91.0 |
Discussion
The LBW is the single most significant reproductive outcome of IUGR and determinant of newborns mortality, morbidity and the chances of a newborn to experience healthy development and/or survival. The prevalence of LBW appears as a major public health issue in several developing countries and reported being the highest among South-Asian countries including India [5,8,11,31,32]. The present study was undertaken to identify the best suitable surrogate anthropometric measure to predict LBW, which could be useful for the health personnel of domiciliary outreach to identify the maximum number of at-risk newborns for providing the timely and needed intervention strategies in the target population [5,22]. The Bengali speaking Hindu Population is the major dominant caste ethnic group in West Bengal, India and the present investigation has reported the overall mean BW was 2.72±0.44 kg and the overall prevalence of LBW was 27.07% [Table/Fig-2]. Similar studies have shown that the lower prevalence of LBW and mean BW were 17.3% and 2.75±0.40 kg [8], and 19.1% and 2.71±0.41 kg [11] in hospital-based investigations in West Bengal, India [Table/Fig-8]. However, the mean BW comparison was observed to be higher than the reported mean BW among the newborns of Rural Karnataka [1]; Puruliya, West Bengal [2]; and Slum-area, Mumbai [33]. The sex-specific LBW was observed being higher among male than female newborns (p>0.05) [Table/Fig-2]. The comparative evaluation of the LBW prevalence in India [1,2,5,8,11,17,19,22,24,33-38] with present study was observed being similar than those reported from investigations were undertaken in Darjeeling (17.30%) [8], Indian population (28.00%) [9], West Bengal (19.19%) [11], Maharastra (44.60%) [18], Kolkata (34.00%) [28], Maharastra (47.00%) [32], Mumbai (45.20%) [33] and Haryana (28.8%) [34] [Table/Fig-8].
Comparative evaluation of descriptive statistics (mean±SD) of BW and LBW with present study [1,2,5,8,11,17,19,22,24,33-38].
| Area | N | BW (kg) | LBW (%) | Chi2-value | Reference |
|---|
| Rural Karnataka, India | 1138 | 2.60±0.45 | 261 (22.90) | 1.93 | Metgud CS et al., [1] |
| Puruliya, West Bengal, India | 487 | 2.59±0.45 | 152 (31.30) | 1.12 | Biswas R et al., [2] |
| Mekelle, Ethiopia | 422 | 2.80±0.69 | 114 (27.00) | 0.0002 | Hadush MY et al., [5] |
| Siliguri, West Bengal, India | 503 | 2.75±0.40 | 87 (17.30) | 8.82* | Sen J et al., [8] |
| Siliguri, West Bengal, India | 13,423 | 2.71±0.41 | 2576 (19.10) | 12.01** | Mondal N et al., [11] |
| Dhaka, Bangladesh | 316 | 2.80±0.46 | 48 (15.18) | 10.15** | Dhar B et al., [17] |
| Uganda | 706 | 3.05±0.53 | 85 (12.00) | 29.94** | Elizabeth NL et al., [19] |
| Tehran | 500 | 3.19±0.39 | 19 (3.80) | 76.63** | Sajjadian N et al., [22] |
| Sarlahi, Nepal | 1640 | - | 469 (28.60) | 0.25 | Mullany LC et al., [24] |
| Slum Area, Mumbai, India | 282 | 2.61±0.48 | 114 (45.20) | 7.42* | Velankar DH [33] |
| Haryana, North India | 500 | 2.56±0.41 | 144 (28.80) | 0.20 | Saini S et al., [34] |
| Pokhara, Nepal | 400 | 3.29±0.43 | 34 (8.50) | 35.01** | Sreeramareddy CT et al., [35] |
| Haryana, North India | 800 | 2.83±0.52 | 136 (17.00) | 12.09** | Kumar M et al., [36] |
| Rural Maharashtra, India | 655 | 2.83±0.44 | 91 (13.80) | 20.67** | Pawar A et al., [37] |
| Nigeria | 299 | - | 64 (21.41) | 1.94 | Chukwudi NK et al., [38] |
| Kolkata, West Bengal, India | 495 | 2.72±0.44 | 134 (27.07) | - | Present study |
Values are in parenthesis indicates percentage, *p<0.05; **p<0.01
Moreover, several researchers have reported the magnitude of newborns LBW in different ethnic/caste populations were ranged from 17.30% to 34.00% in West Bengal [8,9,11,28]. The results of the present study showed the lower prevalence of LBW than the estimated national average {i.e., 28.00% [8]} maybe attributed to the selection of a homogenous ethnic population (i.e., Bengali Hindu population). Several researchers have reported that higher BW values could be attributed to inclusion of full-term singleton live birth babies [11,19,22]. Although, several researchers did not specify such inclusion criteria of the newborn and the newborns born before completion of the full-term gestation period (i.e., <37 weeks) may also have been considered in the above-mentioned study [39,40].
The BW is still considered being an important screening tool for detecting newborns with LBW and a high proportion of newborn LBW deliveries are performed at home especially in rural populations in India [26,41]. It is attributed to the inadequate and cultural inappropriateness of healthcare facilities, rural-urban differences, availability of the traditional birth attendant, family preferences, maternal autonomy or decision making with respect to movement and healthcare accesses and extrinsic factors (e.g., unavailability of transport, poor road conditions, financial conditions, poor awareness and ignorance of healthcare schemes or inadequate utilisation of antenatal care services and distant hospitals, health-related behaviours and decisions making) are promoting home deliveries in India [8,9,31,41]. Due to unavailability of logistic supports (e.g., inaccurate weighing scales/infant-meter) and the high prevalence of non-institutional or home deliveries, measuring newborns BW and the relative risks LBW newborn is considered being a difficult task in developing countries [5,42]. Therefore, researchers have advocated the need for alternative/proxy anthropometric measures to identify the LBW newborns. The results of the present study showed that the BW was significantly correlated with the anthropometric variables of BL and HC (p<0.01). The BL showed the best correlation with BW and HC (p<0.05) [Table/Fig-3]. The coefficient of determination model showed that BL was more precise than HC (p<0.01) to identify LBW newborns [Table/Fig-3]. However, the coefficient of determination in regression analysis (R2-value) which considered being the better means for evaluating the strength of a relationship was used to identify the best alternative measure of newborns BW. Several research studies have reported that significant correlation coefficient values in anthropometric measurements (e.g., BL and HC) and LBW among newborns [5,7,17-19,22,41]. The linear regression analysis of anthropometric variables showed that BL had the lowest and shown a higher coefficient of determination as compared with HC with BW (p<0.01) [Table/Fig-3]. Several research investigations have used linear regression analysis to identify the anthropometric measurements to determine the highest coefficient with BW in newborns [5,7,42]. A similar study has reported the significant positive correlation between BL and HC with BW among newborns in Tehran, Iran [22]. The results of the BLR regression analysis showed that both BL and HC have significant predictability of LBW among newborns (p<0.01) [Table/Fig-4]. Similar studies have reported that HC is relatively reliable surrogate anthropometric measures of LBW in newborns [5,22,38].
The AUC-ROC analyses showed that HC (AUC=0.91) is the most appropriate surrogate anthropometric measurement over BL (AUC=0.89) for identifying LBW newborns [Table/Fig-5]. A similar study has reported that HC (AUC=0.89) with cut-off ≤33.50 cm has shown optimal surrogacy with LBW among Nepalese newborns [35]. This is comparable with the cut-off points of HC is 32.5 cm, while the values of sensitivity and specificity are 78.4% and 81.0%, respectively (p<0.01) [Table/Fig-5]. Furthermore, the overall CPP was observed to be significantly higher in HC (91.0%) than BL (80.6%) to determine the LBW among newborns utilising the derived cut-offs values in present study [Table/Fig-7]. Jeyashree K et al., has confirmed that HC with the cut-off point of 33.8 cm (Sensitivity: 84.88%; Specificity: 68.14%) and BL with 45.7 cm (Sensitivity: 84.88%; Specificity: 68.14%) being a good surrogate anthropometric measure of LBW in India [41]. A similar study has reported that HC of 33.25 cm had the highest positive predictive value (AUC=0.93, specificity: 77.0%) of LBW in Ethiopia [5]. It is to be mentioned here that HC measurement may not be accurate due to the moulding of the head during birth in case of the prolonged and obstructed labour [17]. A recent study in Korea reported a high correlation coefficient between first-trimester crown-rump length and BW [43]. This is also true of findings from studies reported among newborn in Pune, India [21]. The present study has reported the cut-off point of BL is 46.5 cm, while the values of sensitivity and specificity are 81.7% and 80.6% [Table/Fig-6]. A similar study has also reported the cut-off point of BL (48.5 cm, 84.0% sensitivity and 88.0% specificity) and HC (33.25 cm, 73.0% sensitivity and 85.0% specificity) among newborns of Tehran, Iran [22]. Furthermore, this present study was conducted using a dataset from the regional hospital in Kolkata, West Bengal and the anthropometric data (i.e., BW) was collected and recorded by hospital staff, without the direct supervision, hence this situation might cause bias in data collection and management. Moreover, maternal determinant variables include anthropometric characteristics (e.g., height or BMI), socio-economic, demographic and lifestyle variables are considered to be very important determinants of newborns prenatal growth attainments or IUGR (e.g., LBW) [8,11,36,37].
Limitation
It is to be mention here that the present study did not consider the effect of maternal anthropometric, body composition, socio-economic, demographic and lifestyle variables on LBW among newborn. The variations in these determinant variables could have significant effect on the attainment of BW and/or LBW prevalence among newborns.
Conclusion
It is clear from present study that HC may be suitable and simple surrogate anthropometric measure may be used in the domiciliary outreach when it is impossible to record the weight of the newborn at birth, while BL is the next best parameter to identify the LBW. Moreover, the easiest way to record the HC or BL at home is to use a simple non-stretchable tape measurement. These proxies anthropometric measurements (e.g., BL and HC) have shown higher specificity and sensitivity to predict LBW in newborns. With this technique, measurement errors are likely to be less than the measurement of HC and BL are taken into consideration to screen the risk of LBW. Therefore, using such an indicator would help to identify neonates requiring intervention to prevent premature deaths, diseases, disability and this will be a viable example of practical and cost-effective healthcare strategy especially in field situations.
*p<0.001
Values are in parenthesis indicates percentages, *p<0.05
Values are in parenthesis indicates percentage, *p<0.05; **p<0.01
[1]. Metgud CS, Naik VA, Mallapur MD, Factors affecting birth weight of a newborn-a community based study in rural Karnataka, IndiaPLoS ONE 2012 :7.e4004010.1371/journal.pone.004004022792210 [Google Scholar] [CrossRef] [PubMed]
[2]. Biswas R, Dasgupta A, Sinha RN, Chaudhuri RN, An epidemiological study of low birth weight newborns in the district of Puruliya, West BengalIndian J Public Health 2008 52:65-71. [Google Scholar]
[3]. World Health Organization. Global Nutrition Targets 2025: low birth weight policy brief. Geneva: World Health Organization, 2014 [Google Scholar]
[4]. UNICEF 2014. UNICEF Data: Monitoring the Situation of Children and Women. Undernourishment in the womb can lead to diminished potential and predispose infants to early death. Available at: https://data.unicef.org/topic/nutrition/low-birthweight/#. Accessed on 6th April, 2018 [Google Scholar]
[5]. Hadush MY, Berhe AH, Medhanyie AA, Foot length, chest and head circumference measurements in detection of Low birth weight neonates in Mekelle, Ethiopia: a hospital based cross sectional studyBMC Pediatr 2017 17:11110.1186/s12887-017-0866-028431500 [Google Scholar] [CrossRef] [PubMed]
[6]. Goldenberg RL, Culhane JF, Low birth weight in the United StatesAm J Clin Nutr 2007 85:S584-90.10.1093/ajcn/85.2.584S17284760 [Google Scholar] [CrossRef] [PubMed]
[7]. Kadam YR, Somaiya P, Kakade SV, A study of surrogate parameters of birth weightIndian J Community Medicine 2005 30:89-91.10.4103/0970-0218.42857 [Google Scholar] [CrossRef]
[8]. Sen J, Roy A, Mondal N, Association of maternal nutritional status, body composition and socio-economic variables with low birth weight in IndiaJ Trop Pediatr 2010 56:254-59.10.1093/tropej/fmp10219880445 [Google Scholar] [CrossRef] [PubMed]
[9]. Bharati S, Pal M, Bandyopadhyay M, Bhakta A, Chakraborty S, Bharati P, Prevalence and causes of low birth weight in IndiaMalays J Nutr 2011 17:301-13. [Google Scholar]
[10]. Demelash H, Motbainor A, Nigatu D, Gashaw K, Melese A, Risk factors for low birth weight in bale zone hospitals, South-East Ethiopia: A case-control studyBMC Pregnancy Childbirth 2015 15:26410.1186/s12884-015-0677-y26463177 [Google Scholar] [CrossRef] [PubMed]
[11]. Mondal N, Dey S, Sen J, Association of maternal age, pregnancy order and seasonal variations in Low Birth Weight (LBW) in West Bengal, IndiaJ Life Sci 2018 10:1-9.10.31901/24566306.2018/10.01.221 [Google Scholar] [CrossRef]
[12]. Elshibly EM, Schmalisch G, The effect of maternal anthropometric characteristics and social factors on gestational age and birth weight in Sudanese newborn infantsBMC Public Health 2008 8:24410.1186/1471-2458-8-24418638377 [Google Scholar] [CrossRef] [PubMed]
[13]. Darmstadt GL, Lee AC, Cousens S, Sibley L, Bhutta ZA, Donnay F, 60 Million non-facility births: who can deliver in community settings to reduce intrapartum-related deaths?Int J Gynaecol Obstet 2009 107:S89-112.10.1016/j.ijgo.2009.07.01019815200 [Google Scholar] [CrossRef] [PubMed]
[14]. Lawn JE, Haws RA, Darmstadt GL, Yakoob MY, Menezes EV, Soomro T, Bhutta ZA, 3.2 million stillbirths: Epidemiology and framework for evaluation of interventions to prevent stillbirths in low and middle income settingsBMC Pregnancy and Childbirth 2009 9:S210.1186/1471-2393-9-S1-S219426465 [Google Scholar] [CrossRef] [PubMed]
[15]. de Jonge A, Geerts CC, van der Goes BY, Mol BW, Buitendijk SE, Nijhuis JG, Perinatal mortality and morbidity up to 28 days after birth among 743 070 low-risk planned home and hospital births: a cohort study based on three merged national perinatal databasesBJOG 2015 122:720-28.10.1111/1471-0528.1308425204886 [Google Scholar] [CrossRef] [PubMed]
[16]. Snowden JM, Tilden EL, Snyder J, Quigley B, Caughey AB, Cheng YW, Planned Out-of-Hospital Birth and Birth OutcomesN Engl J Med 2015 373:2642-53.10.1056/NEJMsa150173826716916 [Google Scholar] [CrossRef] [PubMed]
[17]. Dhar B, Mowlah G, Nahar S, Islam N, Birth-weight status of newborns and its relationship with other anthropometric parameters in a public maternity hospital in Dhaka, BangladeshJ Health Popul Nutr 2002 20:36-41. [Google Scholar]
[18]. Taksande A, Vilhekar KY, Chaturvedi P, Gupta S, Deshmukh P, Predictor of low birth weight babies by anthropometryJ Trop Pediatr 2007 53:420-23.10.1093/tropej/fmm05217573385 [Google Scholar] [CrossRef] [PubMed]
[19]. Elizabeth NL, Christopher OG, Patrick K, Determining an anthropometric surrogate measure for identifying low birth weight babies in Uganda: a hospital-based cross sectional studyBMC Pediatrics 2013 13:5410.1186/1471-2431-13-5423587297 [Google Scholar] [CrossRef] [PubMed]
[20]. Nabiwemba EL, Atuyambe L, Criel B, Kolsteren P, Orach CG, Recognition and home care of low birth weight neonates: a qualitative study of knowledge, beliefs and practices of mothers in Iganga-Mayuge Health and Demographic Surveillance Site, UgandaBMC Public Health 2014 14:54610.1186/1471-2458-14-54624888464 [Google Scholar] [CrossRef] [PubMed]
[21]. Kakrani V, Holambe V, Garad S, Gupte A, Alternative predictors of Low Birth WeightIndian J Prev Soc Med 2008 39:161-64. [Google Scholar]
[22]. Sajjadian N, Shajari H, Rahimi F, Jahadi R, Michael G, Barakat MG, Anthropometric measurements at birth as predictor of low birth weightHealth 2011 3:752-56.10.4236/health.2011.312125 [Google Scholar] [CrossRef]
[23]. Ashok A, Nandi A, Laxminarayan R, The benefits of a universal home-based neonatal care package in rural India: An extended cost-effectiveness analysis. reproductive, maternal, newborn, and child health: disease control priorities, In: Black RE, Laxminarayan R, Temmerman M, Walker N. Third Edition (Volume 2) 2016 Washington (DC)The International Bank for Reconstruction and Development/The World Bank10.1596/978-1-4648-0348-2_ch1827227228 [Google Scholar] [CrossRef] [PubMed]
[24]. Mullany LC, Darmstadt GL, Coffey P, Khatry SK, LeClerq SC, Tielsch JM, A low cost, colour coded, hand held spring scale accurately categories birth weight in low resource settingsArch Dis Child 2006 91:410-13.10.1136/adc.2005.08878116464960 [Google Scholar] [CrossRef] [PubMed]
[25]. Shah P, Shah S, Kutty RV, Modi D, Changing epidemiology of maternal mortality in rural India: time to reset strategies for MDG-5Trop Med Int Health 2014 19:568-75.10.1111/tmi.1228224533443 [Google Scholar] [CrossRef] [PubMed]
[26]. Sarkar A, Kharmujai OM, Lynrah W, Suokhrie NU, Factors influencing the place of delivery in rural Meghalaya, India: A qualitative studyJ Family Med Prim Care 2018 7:98-103.10.4103/jfmpc.jfmpc_45_1729915741 [Google Scholar] [CrossRef] [PubMed]
[27]. Hall JG, Allanson JE, Gripp KW, Slavotinek AM, Handbook of Physical Measurements 2007 Oxford, UKOxford University Press [Google Scholar]
[28]. Bisai S, Mahalanabis D, Sen A, Bose K, Datta N, Maternal early second trimester pregnancy weight in relation to birth outcome among Bengali Hindus of Kolkata, IndiaAnn Hum Biol 2007 34:91-101.10.1080/0301446060108072817536758 [Google Scholar] [CrossRef] [PubMed]
[29]. Naing NN, Determination of sample sizeMalays J Med Sci 2003 10(2):84-86. [Google Scholar]
[30]. Portaluppi F, Smolensky MH, Touitou Y, Ethics and methods for biological rhythm research on animals and human beingsChronobiol Int 2010 27:1911-29.10.3109/07420528.2010.51638120969531 [Google Scholar] [CrossRef] [PubMed]
[31]. Chakraborty P, Anderson AK, Maternal autonomy and low birth weight in IndiaJ Womens Health (Larchmt) 2011 20:1373-82.10.1089/jwh.2010.242821767141 [Google Scholar] [CrossRef] [PubMed]
[32]. Rao S, Raje S, Nutritional risk factors of low birth weight among poor rural mothers from Maharashtra, IndiaJ Nutrition Health Food Sci 2017 5:01-07.10.15226/jnhfs.2017.001104 [Google Scholar] [CrossRef]
[33]. Velankar DH, Maternal factors contribution to low birth weight babies in an urban Slum community of grater MumbaiBombay Hos J 2009 51:26-35. [Google Scholar]
[34]. Saini S, Singh M, Mittal A, A study to assess the association of maternal factors and the outcome of pregnancy among mothers delivering in a tertiary care hospital in Haryana, IndiaInt J Community Med Public Health 2016 3:1716-22.10.18203/2394-6040.ijcmph20162019 [Google Scholar] [CrossRef]
[35]. Sreeramareddy CT, Chuni N, Patil R, Singh D, Shakya B, Anthropometric surrogates to identify low birth weight Nepalese newborns: a hospital-based studyBMC Pediatr 2008 8:01-06.10.1186/1471-2431-8-1618439237 [Google Scholar] [CrossRef] [PubMed]
[36]. Kumar M, Verma R, Khanna P, Bhalla K, Kumar R, Dhaka R, Chayal V, Prevalence and associate factors of low birth weight in North Indian babies: a rural based studyInt J Community Med Public Health 2017 4:3212-17.10.18203/2394-6040.ijcmph20173815 [Google Scholar] [CrossRef]
[37]. Pawar A, Kumar D, Maternal factors associated with low birth weight: a case control study in rural KeralaInt J Community Med Public Health 2017 4:3793-95.10.18203/2394-6040.ijcmph20174252 [Google Scholar] [CrossRef]
[38]. Chukwudi NK, Nwokeukwu HI, Adimorah GN, Use of a simple anthropometric measurement to identify low-birth-weight infants in Enugu, NigeriaGlob Pediatr Health 2018 19(5):2333794X1878817410.1177/2333794X1878817410.1177/2333794X1878817430038954 [Google Scholar] [CrossRef] [CrossRef] [PubMed]
[39]. Samal GC, Swain AK, Calf circumference as an alternative to birth weight to predict low birth weight babiesIndian Pediatr 2001 38:275-77. [Google Scholar]
[40]. Ahmed FU, Karim E, Bhuiyan SN, Mid-arm circumference at birth as predictor of low birth weight and neonatal mortalityJ Biosoc Sci 2000 32:487-93.10.1017/S002193200000487911075641 [Google Scholar] [CrossRef] [PubMed]
[41]. Jeyashree K, Gupta M, Kathirvel S, Singh A, Home deliveries in Chandigarh, the beautiful city of India: a tug of war between culture and scienceBMJ Case Rep 2013 :pii: bcr201200790410.1136/bcr-2012-00790423365161 [Google Scholar] [CrossRef] [PubMed]
[42]. Nagargoje MM, Chaudhary SS, Deshmukh JS, Misra SK, An institutional study of anthropometric surrogates for birth weightIndian J Community Health 2012 24:215-21. [Google Scholar]
[43]. Kang JY, Park EJ, Yang YS, Park M, Par WI, Crown-rump length measured in the early first trimester as a predictor of low birth weightYonsei Med J 2013 54:1049-52.10.3349/ymj.2013.54.4.104923709444 [Google Scholar] [CrossRef] [PubMed]