Enlargement of the liver and spleen can occur due to various conditions which can be grouped into subheadings such as tumours, infiltrative diseases, infectious diseases, hematologic disorders, autoimmune and metabolic disorders, toxic and drug-related causes and venous congestion. Hepatosplenomegaly can be detected clinically by palpation and percussion methods. The liver span has been used to estimate liver size clinically. However, clinical methods, though a simple, useful bedside way of assessing liver and spleen size has not been found to be accurate [1].
Various radiologic techniques have been used to determine liver and spleen size, such as plain radiographs, Ultrasonography (USG), emission computed tomography, Computed tomography (CT) and MRI. CT-volumetry has proved to be accurate in assessing abdominal organ volumes when compared with autopsy studies [2,3].
With the increasing use of abdominal CT for the evaluation and staging of lymphomas and the evaluation of other conditions, it is important to have well-established parameters that can accurately determine the presence or absence of hepatosplenomegaly.
Several studies have characterised the normal measurements of the spleen on CT. Some studies use the splenic index as a numeric measure of splenomegaly. Others have measured the volumes of the spleen by summing the volumes of each cross-sectional image of the spleen. Similar attempts have been made to characterise the range of normal measurements that can be used as accurate markers of splenomegaly in the paediatric age group [4-6]. Studies have been done to provide a normal range of measurements of the liver on ultrasound. There are no studies to date that have described a simple standard method of measuring liver size on abdominal CT scans. Although there are several techniques that have been used to determine liver and splenic volumes/sizes with CT, there is a need to further identify a technique that is practical and accurate to determine the liver and spleen size while reporting a routine abdominal CT scan. Obtaining volumes is time consuming and not practical for day to day reporting.
The purpose of this study was to compare individual linear measurements, as well as combinations of measurements, with liver and spleen volume (as determined by the technique of summation of the volume of each axial section), to determine if a simple and practical method exists that can be used in the routine practice to reliably identify and follow-up patients with hepatosplenomegaly. These measurements, to the best of author’s knowledge, have not been described till date in the normal Indian population.
Materials and Methods
This was a retrospective study performed in a Tertiary Care Referral Centre in Southern India which caters to patients from all over the country over a period of six months from February 2008 to July 2008. CT scans of 256 patients performed during the period 2004-2008 for which patient height and weight were available from patient records were reviewed. Of these, a total of 100 patients fulfilled the inclusion criteria. The study was approved by the Institutional Review Board (IRB No. 6498).
Patients who had undergone contrast-enhanced CT scans of the abdomen for various indications, with no significant abnormality and no condition known to involve the liver or spleen were included in the study. All patients with significant focal lesions in the liver or spleen, i.e. any focal lesions other than small haemangiomas or simple cysts, patients who had suboptimal scans due to movement artefacts and patients with any malignancy or lympho-proliferative disorder were excluded.
The protocol for the CT scans of the abdomen included administration of oral and intravenous contrast media, followed by arterial phase images till the inferior margin of the liver and venous phase images through the entire abdomen and pelvis. The CT scans were performed using either a single slice helical scanner (Siemens, Somatom Emotion, Software- A31) or a 6-slice helical scanner (Philips, Brilliance 6, Software- Extended Brilliance workstation) with 5 mm section thickness in the venous phase during a single breath hold.
The CT scans were reviewed and only those which fulfilled the inclusion criteria were further assessed. The volumes of the liver and spleen were measured using contrast-enhanced axial CT images at 5 mm intervals using Siemens AG CT 3D Virtuoso CT/MR/AX workstation for advanced image processing. Free-hand outlining of the perimeter of the liver and spleen was done. While outlining the liver, the inferior vena cava, extra-parenchymal portal vein and the gall bladder were excluded from the outline. Hepatic veins and intra-parenchymal portal venous system and other fissures that did not open into the abdominal cavity were included in the outlining [2,3]. Small splenunculi adjacent the spleen were excluded while outlining the spleen. Volumes were obtained by multiplying the sum of all slices by the image reconstruction interval using available software.
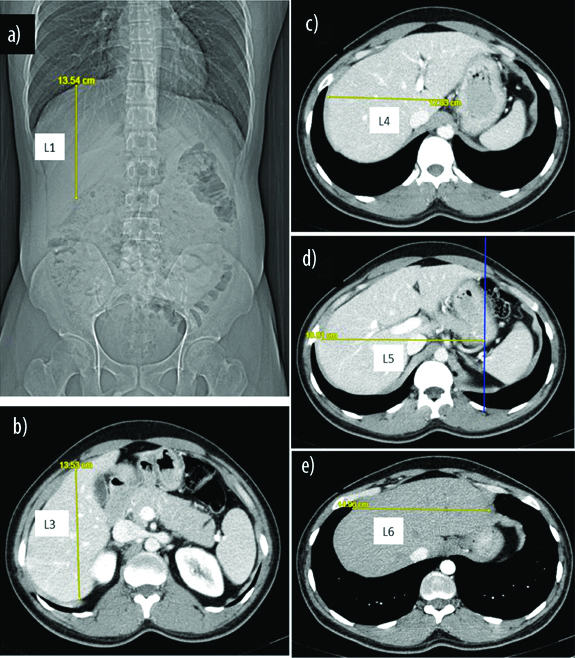
After the volumes of the liver and spleen were obtained, the images were reviewed at a 2X2K, full Picture Archiving and Communication System (PACS) workstation (Pathspeed, General Electric Medical Systems). The various measurements on the CT images as given in [Table/Fig-1] were then recorded. The measurements obtained on axial CT sections of the liver and spleen is demonstrated in [Table/Fig-2a-e,3a-c].
Unidimensional measurements of the liver and spleen.
| L1 | Liver span on the topogram at the midclavicular line [Table/Fig-2a] |
| L2 | Length of the liver, by summing the number of axial slices on which the liver is seen and multiplying this with slice thickness |
| L3 | Maximum anteroposterior diameter of the liver at any point [Table/Fig-2b] |
| L4 | Maximum transverse diameter of the right lobe and caudate lobe [Table/Fig-2c] |
| L5 | Maximum transverse diameter drawn through the right lobe, till a line extrapolated from the outermost edge of the left lobe of liver [Table/Fig-2d] |
| L6 | Maximum transverse diameter through the right lobe and left lobe [Table/Fig-2e] |
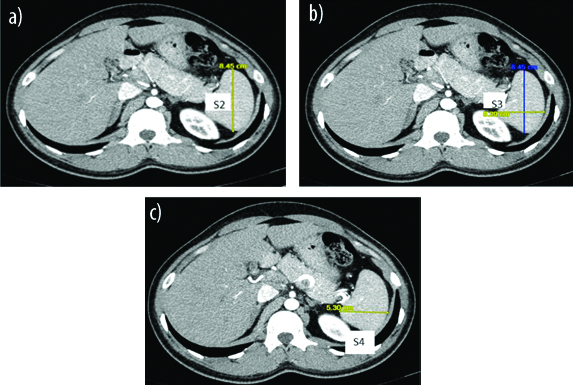
| S1 | Length of the spleen by summing the number of slices on which the spleen is seen and multiplying this with the slice thickness |
| S2 | Maximum width of the spleen [Table/Fig-3a] |
| S3 | Maximum thickness of the spleen on the same axial section as S2 and drawn perpendicular to the line formed by S2 [Table/Fig-3b] |
| S4 | Maximum thickness of the spleen in any section (drawn perpendicular to the maximum width) [Table/Fig-3c] |
Unidimensional measurements of the liver on CECT. a) L1- Liver span on the topogram at the midclavicular line; b) L3- Maximum anteroposterior diameter of the liver at any point; c) L4- Maximum transverse diameter of the right lobe and caudate lobe; d) L5- Maximum transverse diameter drawn through the right lobe, till a line extrapolated from the outermost edge of the left lobe of liver; e) L6- Maximum transverse diameter through the right lobe and left lobe.
Unidimensional measurements of the spleen on CECT. a) S2- Maximum width of the spleen; b) S3- Maximum thickness of the spleen on the same axial section as S2 and drawn perpendicular to the line formedby S2; c) S4- Maximum thickness of the spleen in any section (drawn perpendicular to the maximum width).
Statistical Analysis
The volume of the liver calculated by the summation-of-volumes technique on CT was considered to be the reference test. All study variables were summarised using means and standard deviations. The relationship between liver volumes with indexes and other variables were assessed using Pearson’s correlation coefficient. Simple regression analyses were done to obtain equations that describe the relationship between liver volumes with each of the unidimensional and multidimensional indexes. A p-value of <0.05 was considered statistically significant. All analysis was done using STATA 10.0. By substituting the upper limit of the normal liver volume in the equation for the unidimensional or multidimensional index that best correlated with the liver volume, a value was obtained that corresponded to the upper limit of normal, for that particular dimension [3]. Sensitivity and specificity values were calculated for the unidimensional and multidimensional indexes with the best correlation with liver/spleen volume. A chi-square test was used to determine the correlation between an enlarged spleen and the relationship it has with the left kidney and an enlarged liver and the relationship it has with the right kidney. Presence (sensitivity) and absence (specificity) of hepatomegaly or splenomegaly were considered when the relationship between the liver edge and the inferior-third of the right kidney or the splenic edge and the inferior-third of the left kidney were concordant with the reference test.
Results
The age range of the patients was 18 to 64 years with a mean of 39.15 years. The male: female ratio was 1:1. [Table/Fig-4] summarises patient demographics.
| Patient parameters | Mean±SD |
|---|
| Height (m) (mean±SD) | 1.60±0.079 |
| Weight (kg) (mean±SD) | 60.27±10.0 |
| BMI (kg/m2) | 23.56±4.10 |
| BSA (m2) | 1.63±0.51 |
| Liver volume (cm3) | 1281.26±219.22 |
| Splenic volume (cm3) | 194.64±78.09 |
A positive correlation was seen between the liver volume and height, weight, BMI and BSA {calculated by Mosteller’s formula- BSA=√ (Height × Weight/3600)} as seen in [Table/Fig-5]. A negative correlation was seen with liver volume and age, however it was not statistically significant (p=0.08). There was a statistically significant negative correlation between splenic volume and age (p-value=0.04), however, the rest of the parameters did not correlate significantly with splenic volumes [Table/Fig-5].
Correlation between liver and splenic volumes and the various patient parameters.
| Liver volume | Splenic volume |
|---|
| Correlation (r) | p-value | Correlation (r) | p-value |
|---|
| Age (years) | -0.18 | 0.08 | -0.20 | 0.04 |
| Height (m) | 0.2 | 0.04 | 0.05 | 0.5 |
| Weight (kg) | 0.56 | <0.001 | 0.15 | 0.13 |
| BMI (kg/m2) | 0.43 | <0.001 | 0.1 | 0.25 |
| BSA (m2) | 0.57 | <0.001 | 0.16 | 0.1 |
Correlation between the various unidimensional indices and the various patient parameters like height, weight, BSA and BMI were assessed. There was a negative correlation between the height of the patient and the length of the liver (L2) (r= -0.123, p-value=0.221). However, this was not significant. There was no significant correlation between the weight of the patient and the length of the liver (L2) (r=0.09, p-value=0.35). There was a mild positive correlation between the antero-posterior diameter (L3) and the height of the patient (r=0.22, p-value=0.027). A positive correlation was found between the weight of the patient and the antero-posterior diameter (r=0.544, p-value ≤0.001).
Simple regression analyses were done to obtain equations that describe the relationship between liver volumes with each of the unidimensional and multidimensional indexes [Table/Fig-6]. Among the unidimensional indexes, maximum antero-posterior diameter (L3) showed the best correlation with liver volumes (r=0.57) with a resulting linear regression equation expressed as- L3=(0.0043 × Volume) + 8.7400. Using the linear regression equation that was developed, a value of 16.15 cm was obtained as the upper limit of normal, for the antero-posterior diameter of the liver with a specificity of 89.58% and sensitivity of 25%. The next best unidimensional index that correlated with liver volume was L4 (r=0.455, p-value <0.001) with a resulting linear regression equation that was expressed as- L4=(0.0023 × Volume) + 9.7454. Using this linear regression equation, an upper limit of normal of 13.7 cm was obtained which had a sensitivity of 100% and specificity of 86.5%. The multi-dimensional index- H (L2×L3×L5) correlated best with liver volumes (r=0.75, p-value <0.01).
There was no significant correlation between the inferior margin of the liver and the lower-third of the right kidney as an indicator of hepatomegaly (p-value=0.414).
There was a negative correlation between the height of the patient and the length of the spleen (S1) (r=-0.05, p-value=0.61). However, this was not significant. There was no significant correlation between the weight of the patient and S1 (r=0.04, p-value=0.62). There was a positive correlation between the width of the spleen (S2) and height (r=0.16, p-value=0.12) and weight of the patient (r=0.13, p-value=0.2). However, this was not statistically significant. The unidimensional indexes that were obtained for the spleen and the linear regression equations were obtained and are given in [Table/Fig-7]. The p-values that were obtained were all statistically significant (p-value <0.001).
Correlation Coefficients and Linear regression equations between liver volumes and different indexes.
| Indexes | Correlation coefficient | p-value | Linear regression equation |
|---|
| L1 | 0.307 | 0.003 | L1=(0.0032 × Volume)+8.2431 |
| L2 | 0.437 | <0.001 | L2=(0.0039 × Volume)+11.7776 |
| L3 | 0.568 | <0.001 | L3=(0.0043 × Volume)+8.7400 |
| L4 | 0.455 | <0.001 | L4=(0.0023 × Volume)+9.7454 |
| L5 | 0.245 | 0.01 | L5=(0.0028 × Volume)+13.3964 |
| L6 | 0.292 | <0.001 | L6=(0.0038 × Volume)+12.203 |
| H (L2×L3×L5) | 0.75 | <0.01 | H=(2.8553 × Volume)+401.797 |
| I (L2×L3×L6) | 0.74 | <0.001 | I=(3.0424 × Volume)+173.9917 |
| J (L2×L5) | 0.47 | <0.001 | J=(0.1176 × Volume)+135.6669 |
| K (L2×L3) | 0.74 | <0.001 | K=(0.1287 × Volume)+71.7162 |
| L (L3×L4) | 0.58 | <0.001 | L=(0.0866 × Volume)+70.7836 |
| M (L3×L6) | 0.54 | <0.001 | M=(0.1231 × Volume)+84.5426 |
| N (L2×L6) | 0.51 | <0.001 | N=(0.1316 × Volume)+117.8991 |
Correlation Coefficients and Linear regression equations between spleen volumes and indexes.
| Indexes | Correlation coefficient | p-value | Linear regression equation |
|---|
| S1 | 0.74 | <0.001 | S1=(0.015 × Volume)+6.3805 |
| S2 | 0.7094 | <0.001 | S2=(0.0123 × Volume)+7.0535 |
| S3 | 0.4351 | <0.001 | S3=(0.0079 × Volume)+3.6875 |
| S4 | 0.6823 | <0.001 | S4=(0.0118 × Volume)+3.4107 |
| E (S1×S2×S4) | 0.9064 | <0.001 | E=(2.9041 × Volume)-40.3789 |
| F (S2×S4) | 0.7840 | <0.001 | F=(0.1982 × Volume)+16.6181 |
Among the unidimensional indexes, S1 (length) showed the best correlation with splenic volumes (r=0.70) with a resulting linear regression equation expressed as: S1=(0.015 × Volume) + 6.3805. S2 (width) showed the next best correlation with splenic volumes (r=0.70) with a resulting linear regression equation expressed as: S2=(0.0123 × Volume) + 7.0535.
Using the linear regression equation that was developed, a value of 10.81 cm was obtained as the upper limit of normal for splenic length (Sensitivity=81.82%, specificity=86.52%). The multi-dimensional index E (S1 × S2 × S4) correlated best with splenic volume (r=0.90, p<0.001).
The relation of the lowest point of the spleen to the inferior-third of the left kidney was very sensitive and specific. However, this was not statistically significant.
Discussion
The mean BSA in the present study population was 1.63 m2 which was in accordance with a study on 238 patients in the Indian population [2]. The mean value that was obtained for the liver volume was 1281±219.22 cm3. This was less than the values obtained by Henderson JM et al., who obtained a mean liver volume of 1493 cm3 in 11 patients and of 1560 cm3 by Geraghty EM et al., in 149 patients. In both these studies, the technique that was used to measure liver volumes was similar to the technique the present authors used [3,7]. The difference in the measurements we obtained may be because both these studies were performed on a Western population.
The mean splenic volume was 194.64±78.09 cm3. A study in north India on 21 subjects using abdominal CTs obtained splenic volumes of 161.57±90.2 cm3 [8]. Henderson JM et al., had obtained a mean value of 219 cm3 in 11 patients and Geraghty EM et al., a value of ~209 cm3 in 149 patients [3,7]. Hoefs JC et al., had found an average splenic volume of 201 cm3 in 11 normal subjects and Prassopoulos P et al., a value of 215 cm3 in 140 patients using a technique similar to the present study [9,10]. The difference between the present study values and the values obtained in the Western population was not very significant however studies from Japan found slightly lower splenic volumes of 112 cm3 and 123±45 cm3 [4,11].
A negative correlation was seen between liver volumes and the age of the patient as seen in other studies by Wynne HA et al., and Urata K et al., [12,13]. The liver volume increased with increase in height, weight, BMI and BSA of the patient. This increase in the liver volume with increase in BSA has been demonstrated earlier by Vauthey JN et al., [14]. Due to this positive correlation, BSA and weight of the patient have been used in various formulae for calculation of the liver volume.
A higher average liver volume of 42.84 cm3 was seen in males however it was not statistically significant and hence all further analysis was done combining data from both males and females. Kwo PY et al., also did not find a significant gender difference in their study, unlike Geraghty EM et al., who found a difference of 299 cm3 between the mean liver volumes in males and females [3,15].
There was a negative correlation between splenic volume and age of the patient with no significant correlation between splenic volume and height and weight. A study by Spielmann AL et al., in a group of tall healthy athletes showed a significant correlation between splenic size and height [16]. A positive correlation between splenic volume and height in 21 North Indian subjects was seen [8].
In the present study, no significant correlation was seen between splenic volume and the BMI and BSA, as also noted by Kaneko J et al., in a group of 150 healthy liver transplant donors [4].
In the present study, the maximum splenic volume was higher in females than in males. The mean volumes that were obtained by Geraghty EM et al., were 179.8 cm3 in females and 193.1 cm3 in males [3].
Among the various unidimensional indices measured, the maximum antero-posterior diameter of the liver correlated best with liver volume (Mean±SD=14.2±1.7 cm). Niederau C et al., obtained a lower value of 8.3±1.7 cm by ultrasound which may be due to obscuration of a part of the liver by bowel gas [17].
The multidimensional indexes correlated much better with liver volume. The value which best correlated with the liver volume was H (L2×L3×L5) (r=0.75). As the liver is a three-dimensional structure, it is simple to understand why this correlation would be better than that of the unidimensional indexes. The upper limit of H (L2×L3×L5) that can be used as the upper limit of normal is 5321.48 cm3. The sensitivity of this value was 50%, specificity of 95.83% and negative predictive value 97%. This however again would be too cumbersome to measure on a routine day to day basis.
The length of the spleen (S1) ranged from 4 cm to 13.5 cm (Mean±SD=9.3±1.6 cm). On ultrasound, the maximal length of the spleen as seen in the right lateral decubitus position, measured from the upper to lower pole is 12-13 cm [18]. Rosenberg HK et al., provided a range of values for the measurement of splenomegaly on ultrasound using splenic length which was correlated with weight, height and age [19]. In a study by Spielmann AL et al., in tall healthy athletes, they obtained a splenic length greater than 12 cm in 31.7% of the men (mean spleen length, 11.4±1.7 cm) and in 12.8% of the women (mean spleen length, 10.3±1.3 cm) [16]. The difference in the value that we obtained on the axial CT scans is probably due to the fact that the spleen is oriented obliquely in the coronal plane. Due to this orientation, measuring the length of the spleen on CT scans will underestimate the true length of the spleen.
There was no significant correlation between the length of the spleen and the height and weight of the patients in the present study. This was contradictory to previous studies on sonographic measurements of splenic length in tall healthy athletes, which showed positive correlations with the height of the patient and length of the spleen [16]. As the plane in which ultrasonographic measurements of the length of the spleen are taken and the way in which the length of the spleen was measured on the present study are different, it is difficult to accurately compare the two results. Another study in India performed among adults in Tripura using ultrasound obtained a value of 8.85±1.54 cm and 8.72±0.89 cm in males and females respectively [20].
The maximum width of the spleen on any axial section was measured (S2) as Niederau C et al., stated that the antero-posterior diameter/width of the spleen was greater in heavier subjects. The mean value we obtained was 9.5 cm with a standard deviation of 1.4 cm. Spielmann AL et al., obtained a value of 10.8±1.4 cm in a group of tall athletes. The average height and weight of these patients were significantly higher than in the present population and this can account for the difference. The positive correlation between the width of the spleen and the height and weight of the patient was as seen in other studies but was not statistically significant [16,17].
The unidimensional index which best correlated with splenic volume was the length. This correlation was also demonstrated in other studies using sonography, by Rosenberg HK et al., in children and by Lamb PM et al., in adults [19,21]. The study by Bezerra AS et al., in 249 adults using CT measurements also showed that the value which best correlated with the splenic volume was the length (r=0.81, p-value <0.01) [6]. Using the upper limit of normal volume of the spleen of 295 cm3 as found by Henderson JM et al., in the linear regression equation, a value of 10.81 cm was obtained as the upper limit of normal for the length of the spleen [7].
The next best unidimensional index which correlated with splenic volume was the width. This finding was similar to that seen by Bezerra AS et al. The measurement that we obtained as the upper limit of normal was 10.86 cm [6].
The multi-dimensional indexes showed a better correlation with splenic volume than the unidimensional indexes. The value “E” which was obtained by multiplying the length, the width, and thickness of the spleen, corresponds to the splenic index which was previously described by Herter M et al., showed the best correlation (r=0.90, p-value <0.05) with splenic volume [22]. Another study in the Indian population on one hundred twenty-six subjects with no evidence of disease which could alter the size of spleen obtained a mean splenic index of 494.82±226.83 cm3 without any sexual variation [23].
Limitation
The study is retrospective and inter-observer variation could not be accounted for as all measurements were obtained by a single radiologist.
Conclusion
The average liver and splenic volumes were less than the Western population and similar to other studies in the Indian population. Multi-dimensional indexes correlated better with liver and spleen volumes than uni-dimensional indices. Of the unidimensional indices, the maximum antero-posterior diameter of the liver at any point on an axial CT image and the splenic length could be used reliably during routine practice to evaluate for the presence of hepatomegaly or splenomegaly.