Water is a vital component of the human body that accounts for ~57-60% of the body weight [1]. Osmolality is a colligative property of a solution and a measure of solute concentration. Serum osmolality is tightly maintained in the narrow range of 280-295 mOsmol/kg by sufficient intake of water, thirst mechanism, appropriate water excretion by the kidneys and vasopressin or Anti-diuretic hormone (ADH) [2]. Serum (or plasma) Osmolal gap (OG) is the difference between the Measured Osmolality (MO) and Calculated osmolarity (CO), where MO is usually determined by freezing point depression and CO is determined using osmolarity equations [3]. Plasma or serum osmolality is a useful marker of static dehydration, Diabetes Insipidus, Syndrome of Inappropriate Anti-diuretic Hormone (SIADH), Alcohol intake and diabetic keto-acidosis [2,4,5].
Due to lack of automated laboratory protocol and high associated cost, monitoring hydration status via measurement of serum osmolality is often not feasible. In such cases, calculation of serum osmolarity by measurement of routinely screened baseline components like glucose, urea, sodium and potassium is recommended. Almost negligible osmolal gap between different osmolarity equations makes it one of the determinants of fitness for the study [6]. The calculated osmolarity and actual osmolality of human serum are roughly equivalent (i.e., 1 L≈1 kg) and can be used interchangeably [7].
Over the years, various equations have been documented and are currently being used for calculation of serum osmolarity but the equation that best predicts the serum osmolality remains debatable. Therefore, the present study was conducted to determine the most accurate equation for calculation of serum osmolarity and prediction of serum osmolality in Paediatric population. To the best of our knowledge, no such analysis has been carried out in Paediatric population in India.
Materials and Methods
The retrospective study was conducted on 50 apparently healthy children (aged ≤12 years) visiting the Department of Biochemistry at Chacha Nehru Bal Chikitsalya, Paediatric Government Hospital, Delhi. Children with history of known liver or kidney disease, dysproteinemia, visible lipemia, hemolysis, hemoglobinopathy, sepsis and hypotension were excluded from the study.
Serum urea, sodium, potassium, glucose (Glu) and osmolality values were obtained from the January 2016- December 2016 laboratory records. Osmolarity was calculated using various equations (Eq) which have been primarily documented in the literature [Table/Fig-1] [5,8-12].
Serum osmolarity equations evaluated in the study [5,8-12].
| S No | Equations | References |
|---|
| 1 | 1.86 (Na)+Glu+0.5 (Urea)+9 | Scott MG and Le grys VA, [5] |
| 2 | 1.86 (Na+K)+Glu+Urea+10 (Bhagat formula) | Bhagat CI et al., [8] |
| 3 | 2 (Na)+10 | Kruse JA and Cadnapaphornchai P, [9] |
| 4 | 0.985{2 (Na K)+Glu+0.5 (Urea)} | Fazekas AS et al., [10] |
| 5 | 1.89 (Na)+1.38 (K)+1.08 (Glu)+1.03 (Urea)+7.45 | Kruse JA and Cadnapaphornchai P, [9] |
| 6 | 2 (Na)+1.15 (Glu)+Urea | Fazekas AS et al., [10] |
| 7 | 2 (Na)+Glu+0.5 (Urea) | Fazekas AS et al., [10] |
| 8 | 2 (Na)+Glu+Urea (Smithline Gardner formula) | Smithline N and Gardner KD Jr, [11] |
| 9 | 1.86 (Na+K)+1.15 (Glu)+Urea+14 (Khajuria & Krahn) | Khajuria A and Krahn J, [12] |
Glu: Glucose, Na: Sodium, K: Potassium
Statistical Analysis
Students’ paired t-test was used to assess the statistical differences between measured and calculated osmolarity by different equations. The Bland Altman method was used to determine the agreement and differential bias between calculated osmolarity and measured osmolality with 95% lines of agreement. Regression analysis was performed for all equations and the equation which gave the highest r squared value along with the lowest error of regression. It was considered the best mathematical tool to calculate serum osmolarity. Mean values of osmolal gap closest to zero were considered best.
Results
The mean of measured osmolality was 293.86±10.89 mOsm/kg and the mean of calculated osmolarity by different formulas is mentioned in [Table/Fig-2]. The osmolal gaps were calculated for all the nine calculations [Table/Fig-2].
Calculated osmolarity and Osmolal gaps by different equations.
| S No. | Equations | Calculated osmolarity (mOsm/l) (Mean±SD) | Osmolal gap (mOsm) (Mean±SD) | p-value |
|---|
| 1 | 1.86 (Na)+Glu+0.5 (Urea)+9 | 279.96±9.83 | 13.89±1.493824 | 0.01* |
| 2 | 1.86 (Na+K)+Glu+Urea+10 (Bhagat formula) | 292.6±9.96 | 1.25±1.58 | 0.001** |
| 3 | 2 (Na)+10 | 283.49±10.48 | 4.74±2.04 | 0.001** |
| 4 | 0.985 {2 (Na+K)+Glu +0.5(Urea)} | 289.09±10.34 | -0.95±1.51 | 0.001** |
| 5 | 1.89 (Na)+1.38 (K)+1.08 (Glu)+1.03 (Urea)+7.45 | 287.30±10.14 | 0.88±1.37 | 0.001** |
| 6 | 2 (Na)+1.15 (Glu)+Urea | 289.46±10.74 | -1.29±0.96 | 0.06 |
| 7 | 2 (Na)+Glu+0.5 (Urea) | 284.82±10.55 | 3.35±1.15 | 0.001** |
| 8 | 2 (Na)+Glu+Urea (Smithline Gardner formula) | 293.96±10.73 | -0.10±0.94 | 0.44 |
| 9 | 1.86 (Na+K)+1.15 (Glu)+Urea+14 (Khajuria & Krahn formula) | 297.79±9.97 | -3.93±1.6 | 0.05* |
Glu: Glucose, Na: Sodium, K: Potassium
Students’ paired t-test, * significant p-value <0.05 ** highly significant p-value <0.01
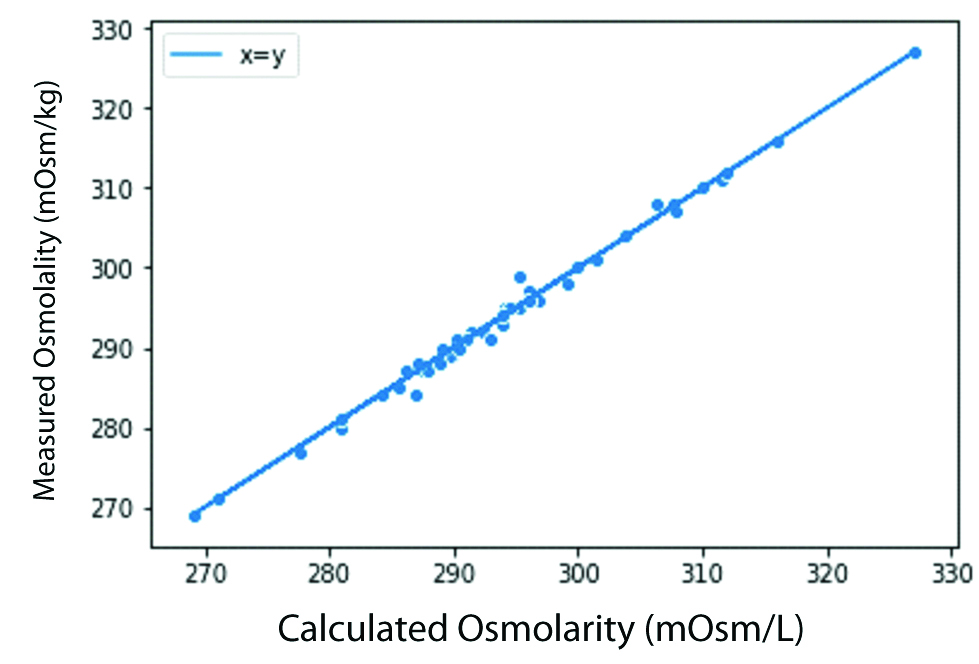
The statistical difference between the measured osmolality and calculated osmolarity using Smithline Gardner equation was insignificant (p-value>0.05). The same was observed by the scatter plots [Table/Fig-3].
Scatter plot of Smithline Gardner equation.
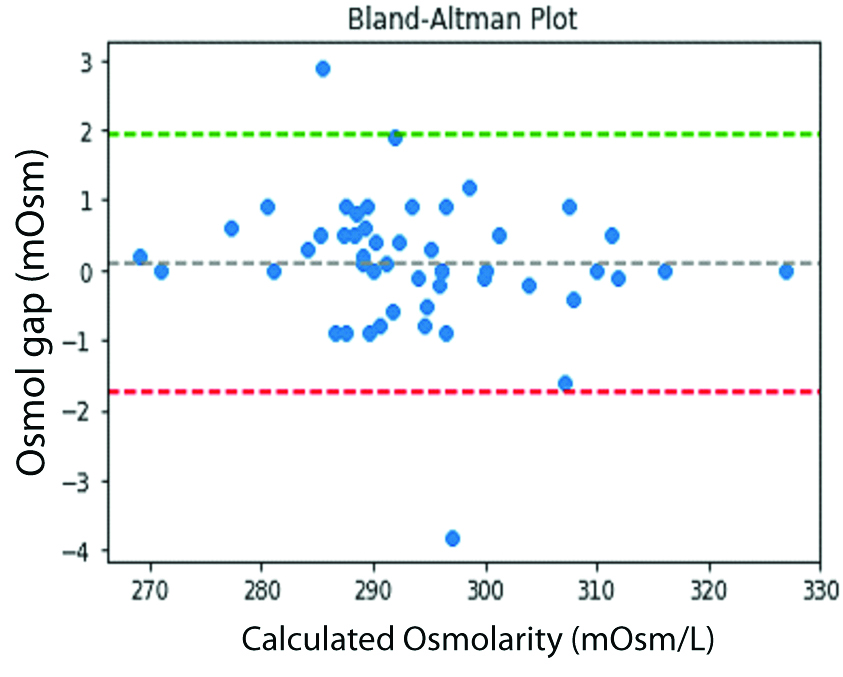
The Bland Altman plot for Smithline Garnder calculation showed that most of the values by the equation had difference of 0±2 mOsmol with the measured serum osmolality showing fitness of the equation for the purpose [Table/Fig-4]. The Smithline Gardner formula gave osmolal gap close to zero and maximum r squared value along with the lowest standard error [Table/Fig-5].
Bland Altman Plot for Smithline Gardner equation.
The r squared value and standard error of regression for different Equations as compared to the measured value
| S No. | Equations | r squared value | Standard error of regression |
|---|
| 1 | 1.86 (Na)+Glu+0.5 (Urea)+9 | 0.98 | 1.12 |
| 2 | 1.86 (Na+K)+Glu+Urea+10 (Bhagat formula) | 0.98 | 1.34 |
| 3 | 2 (Na)+10 | 0.96 | 2.05 |
| 4 | 0.985 [2 (Na+K)+Glu+0.5 (Urea)] | 0.94 | 1.9 |
| 5 | 1.89 (Na)+1.38 (K)+1.08 (Glu)+1.03 (Urea)+7.45 | 0.98 | 1.20 |
| 6 | 2 (Na)+1.15 (Glu)+Urea | 0.99 | 0.95 |
| 7 | 2 (Na)+Glu+0.5 (Urea) | 0.98 | 1.12 |
| 8 | 2 (Na)+Glu+Urea (Smithline Gardner formula) | 0.99 | 0.92 |
| 9 | 1.86 (Na+K)+1.15 (Glu)+Urea+14 (Khajuria & Krahn formula) | 0.98 | 1.36 |
Glu: Glucose, Na: Sodium, K: Potassium
Discussion
The primary purpose of the study was to determine which osmolarity equation best fit the purpose of prediction of serum osmolality. Among the nine equations evaluated, Smithline Gardner equation gave osmolal gap close to zero, maximum r squared value along with the lowest standard error and the statistical difference between the measured osmolality and calculated osmolarity was insignificant. Based on these findings, the authors suggest that Smithline Gardner is the best equation for the calculation of osmolarity and prediction of osmolality in Paediatric population.
Osmolarity is defined as the total concentration of dissolved solutes in a solution, while osmolality is the total concentration of dissolved solutes in a solvent. In practice, the difference between the absolute values of osmolarity and osmolality are negligible as the bodily fluids are typically aqueous solution [13].
In 1828, French researcher Rene Joachim Henri de Dutrochet developed the first osmometer based on the Charles Blagden study that demonstrated that depression in the freezing point of a solution was dependent on the concentration of the solute [14,15]. Till date, osmostat based on freezing point depression or vapour pressure depression assessment method are commonly used for the measurement of serum osmolality. However, the limited availability, longer processing time, higher cost, greater osmolal gap and high incidence of laboratory errors, limits its clinical use.
The serum osmolality profile of an individual serves as an essential diagnostic and prognostic parameter for evaluation of dehydration status, electrolyte imbalance and management of hydroelectrolytic disorders. Even minute changes in osmolality affect the water reabsorption, urine and blood plasma concentration and thirst response [5,6,8]. Therefore, for timely and accurate estimation of osmolality, osmolarity equations based on concentration of routinely screened plasma/urine components (glucose, urea, sodium and potassium) were derived.
Numerous studies reports diagnostic efficacy of various osmolarity equations, however these results vary significantly depending upon the age and health status of the study population [3-5, 8-18]. In 1975, Dorwart WW and Chalmers L, reviewed 13 equations and reported that 1.86 Na+Glu+Urea+9 equation, yielded most accurate calculated osmolarity values [3]. Later this equation was modified by Bhagat CI et al., to include potassium concentration for more accurate representation of serum [8]. Fazekas AS et al., and Khajuria A and Krahn J, both reported that simplified equations like 2(Na) + 10 had excellent concordance with measured osmolarity [10,12]. A 2014 study reported that Khajuria A and Krahn J (1.86(Na+K) + 1.15(Glu)+Urea+14) equation best predicted the serum osmolarity in frail old people with and without diabetes, while another study by Rasouli M recommends the use of simplest Worthley LI et al., equation (2{Sodium}+Glucose/1.8+ Blood urea Nitrogen /2.8), and suggests to withdraw Dorwart-Chalmers equation from the textbooks due to significant osmolal gaps and correction of osmolal gap to 0±2 mOsm/L [4,16,17].
In a recent study, 34 usable equations were applied to data procured from the Royal College of Pathologists of Australasia Quality Assurance Program (RCPAQAP) Liquid serum chemistry (LSC) Survey 2013. According to this study, Smithline-Gardner equation {2(Na)+Glu+Urea} was fit for purpose in both apparently healthy individuals and hospitalised patients [11,18]. These findings were similar to our results where osmlal gap was near zero.
Choy KW et al., also demonstrated that Smithline Gardner equation performs well across various analytical platforms, and be used for both rapid bedside mental calculation and automated laboratory autoanalysers [18]. In addition, the equation serves as an indirect tool for monitoring serum sodium levels beyond the reportable range of the analysers and thereby helps in screening of prognosis and treatment of hypernatremia [19].
Conclusion
The study provides strong evidence that Smithline Gardner equation fits the purpose of calculation of serum osmolarity and prediction of serum osmolality. Due to lack of resources in developing countries like India, estimation of osmolality with routinely screened parameters like glucose, urea, sodium and potassium, will not only reduce the treatment cost but will also help in timely initiation of appropriate treatment.
Limitation
The major limitation of this study pertains to the study population. Since the targeted group was Paediatric population, the results could not be compared to control group due to lack of availability of healthy population with osmolality requisitions in hospital-setting. The present research was a pilot study and further studies with relatively larger sample size are required to validate these equations in combinations of physiological and pathological conditions in Paediatric population.
Glu: Glucose, Na: Sodium, K: Potassium
Glu: Glucose, Na: Sodium, K: Potassium
Students’ paired t-test, * significant p-value <0.05 ** highly significant p-value <0.01
Glu: Glucose, Na: Sodium, K: Potassium