Chronic Obstructive Pulmonary Disease (COPD) is chronic, irreversible and fatal disease on a global scale [1]. Basic pathology of the disease is related to oxidative stress and inflammation [2] affecting airway and parenchymal cells. Previous reports strongly support that COPD patients have low physical function, with dyspnea and poor Health-Related Quality of Life (HRQoL) [3], as well as limited exercise tolerance [4], due to skeletal muscle wasting, respiratory and limb muscle weakness [5,6]. Therefore, low respiratory muscle strength involves all physical functions, Quality of Life (QoL) and exercise tolerance. It has been reported that improvement of respiratory muscle and general muscle limb strength could improve physical activity and QoL clinically [7,8]. Moreover, Nitric Oxide (NO) is released by Nitric Oxide Synthase (NOS) on endothelial cells and its function on vasodilation has been confirmed [9]. Of interest, a previous study showed that peroxynitrite correlated significantly to the ratio between FEV1 and FVC in COPD patients [10]. Therefore, it has been hypothesised that NO could possibly increase blood flow to respiratory and large muscles in order to improve pulmonary function, walking capacity and total QoL. The aim of this study was to evaluate the correlation between respiratory muscle strength, walking distance, total QoL score and plasma NO among stable COPD participants.
Materials and Methods
The present cross-sectional study was conducted on 35 subjects (28 males and 7 females) with stable COPD, who were living at home in Sansai district, Chiang Mai, Thailand. Data collection and evaluation was performed at Ban-Tor-Public Health Centre, Sansai district, Chiang Mai, Thailand during June and July 2018. The protocol in this study was approved by the Ethics Committee at the Faculty of Associated Medical Sciences, Chiang Mai University, Chiang Mai, Thailand (Study Code: AMSEC-60EX-060) and conducted in accordance with the Helsinki Declaration (2001). All participants gave a written consent form before starting the assessment. The sample size of the participants followed a previous study [11], which had an effect size of 0.92, alpha error of 0.05, and power of 0.95, calculated by the G*Power (3.1.9.2) program. As at least 30 participants should be included in this type of study, a total of 35 were enrolled. All of them were permitted to receive medication in the form of either a short or long-acting inhaled bronchodilator, prescribed by a physician if needed (when symptomatic aggravation occurred). None of the participants had any hospital evidence of uncontrolled hypertension, unstable cardiac disease, recurrent symptoms of acute exacerbation, recurrent pneumothorax, thoracic chest pain, as well as neuromuscular disorders, liver or renal dysfunction, endocrinal abnormalities for at least six months before data collection. Furthermore, any participants being administered with nutrients or supplements containing multi-vitamins or antioxidants, such as fruit juice or tablets, were excluded from this study. The stable condition of all the participants was confirmed before starting the protocol by screening the Complete Blood Count (CBC) using a fully automated Olympus AU400 Analyser (Olympus Diagnostics GmbH, Umkirch, Germany) as the protocol in the protocol the previous study [12], at the AMS Clinical Service Centre, Faculty of Associated Medical Sciences, Chiang Mai University, Thailand. Blood was taken from the anterior cubital vein for plasma NO by a Medical Technologist and kept in sterile Ethylene Diamine Tetraacetic Acid (EDTA). After the QoL was interviewed, pulmonary function, respiratory muscle strength and 6MWD were evaluated.
Respiratory Muscle Strength Test
Respiratory muscle strength was tested by measuring the maximal inspiratory mouth pressure (MIP or PImax) at residual volume, using a portable hand-held mouth pressure metre (Micro RPM, Micro Medical Ltd., Kent, UK). All the participants were seated wearing nose clips, and the flange of the mouthpiece on the mouth pressure metre to prevent air leaks. After three cycles of regular breathing and forceful inspiratory effort, holding breath for at least 3 seconds was requested when maximal exhalation had finished. The highest data of PImax in a unit of centimetre water (cm H2O) from three repeated evaluations was recorded [13,14]. An interval of 2-3 minutes or more rest was permitted during the test, if dyspnea symptoms were presented.
Six-Minute Walking Distance Test
The 6MWD test was a modification of the 20-metre straight line walking test, designed for an indoor corridor, and its evaluation followed the guideline of the American Thoracic Society (ATS) [15]. Any vigorous activities or eating two hours before the test were avoided and vital signs such as respiratory rate, oxygen saturation, heart rate and blood pressure were evaluated for safety reasons. The participants were instructed to walk at a comfortable pace for six minutes under supervision of a highly experience Physical Therapist, they could stop and rest during the test if they feel heavy symptoms of dyspnea (equal to six from a maximal 10 on the Borge scale), in accordance with the guideline of the American College Society of Medicine [16].
Pulmonary Function Test
FVC, FEV1 and the FEV1/FVC ratio were evaluated, in either litre or predicted normal value from the FVC maneuver in a pneumatic-flow sensor spirometre (HI-105, Chest MI, Inc., Japan), performed under instructions from the ATS pulmonary function test [17]. The criteria of severity were determined in the moderate stage, according to the Global Initiative for Chronic Obstructive Lung Disease [18], based on the value of predicted FEV1% (50%≤FEV1<80%).
All of the participants were required to sit on a chair with given for support. Careful instructions and coaching were by an experienced Physical Therapist who was certified as a pulmonary function tester. The evaluation protocol of three cycles of slow normal breaths were requested before maximal exhalation and quick inhalation. Finally, quickly forced exhalation and holding breath at the end of it was performed before returning to normal breathing. All of the data were printed after the test was completed. The highest litre and predicted percentage value of FEV1 (FEV1%), FVC (FVC%), and predicted value of the FEV1/FVC ratio from three repeated measurements, were selected finally in not more than eight tests.
Quality of Life Evaluation
QoL during past week before tests was assessed by interviewing with the Thai version of the Clinical COPD Questionnaire (CCQ), which was developed and freely provided by van der Molen T, et al., [19,20]. It consisted of ten questions in three domains; symptom (four questions of short of breath at rest, short of breath during physical activities, coughing and phlegm production), mental (two questions were concerned about getting cold and depressed because of breathing problems), and functional state limitation (four questions of strenuous physical activities, moderate physical activities, daily activities at home and social activities). Each question has a seven-point score from zero (never get symptoms or mental problems and no limitation on physical function) to six (almost all the time for symptoms, worst metal status and totally limited or unable to do all functions). The QoL scores from 10 questions were calculated as the mean sum of all items. The highest value indicated the worst health status, whereas the lowest presented the best QoL.
Plasma Nitric Oxide Evaluation
Fresh plasma from whole blood was collected in an EDTA tube and separated by centrifugation at 3,000 × g for 10 minutes, in order to evaluate the NO by Griess reagent [21], as modified in the previous protocol by Leelarungrayub J et al., [22]. In brief, 200 μL of plasma was mixed with 500 μL of sulfanilamide (0.1% W/V) and kept in dark for ten minutes to produce diazonium ion before adding 500 μL of N-(1-Naphthyl) ethylenediamine (1%). Slight colour of the chromophoric azo product was read by spectrophotometry at 540 nm after incubation in the dark for five minutes. The NO was calculated by comparing with standard sodium nitrite (NaNO3) (Sigma-Aldrich, AUS).
All parametres were evaluated experimentally at the Biomechanics Laboratory of the Department of Physical Therapy and Department of Medical Technology, Faculty of Associated Medical Sciences, Chiang Mai University, Thailand.
Statistical Analysis
All of the data were analysed statistically for normal distribution using the One-sample Kolomogorov-Smirnov test before presenting as mean, with Standard Deviation (SD), and minimal and maximal values. The correlation between the PImax and 6MWD with pulmonary function, plasma NO levels and total QoL score was analysed with the Pearson’s correlation test. All statistical analyses were carried out using the Statistical Package for Social Science Software (SPSS) version 17.0 (SPSS Inc., Chicago, IL, USA). All of the tests were used with significance at a p-value of less than 0.05.
Results
The demographic data of all 35 participants in this study was presented in [Table/Fig-1]. The results of the CBC screening test showed that all parametres such as White Blood Cells (WBC), Red Blood Cell (RBC), haemoglobin (Hb), haematocrite (Hct) and platelet (PLT) were within reference ranges.
Demographic data-age, sex, BMI, and CBC parametres (n=35).
| Parametres | Reference ranges | Mean±SD (min-max) |
|---|
| Demographics |
| Age (years) | - | 73.20±10.66 (42-90) |
| Sex (females: males) | - | 7:28 |
| BMI (Kg/m-2) | - | 22.37±4.12 (15.21-26.45) |
| CBC |
| WBC (103/μL) | 5-10 | 5.8±1.2 (5.1-9.9) |
| RBC (106/μL) | 3.8-5.3 | 5.1±0.9 (3.9-4.2) |
| Hb (gm/dL) | 10-16 | 10.3±1.2 (10.2-15.2) |
| Hct (%) | 36-50 | 39.5±1.3 (36.2-42.5) |
| PLT (103/μL) | 140-440 | 225±24 (151-435) |
BMI: Body mass index; CBC: Complete blood count; WBC: White blood cells; RBC: Red blood cells; Hb: Haemoglobin; Hct: Haematocrit; PLT: Platelet
The results of pulmonary function test, PImax, total QoL score and NO levels are shown in [Table/Fig-2]. The Pulmonary function were FVC at 2.12±0.67 (0.6-4.25) L, FVC % at 93.89±11.01 (71.43-115.21), FEV1 at 1.48±0.59 (0.65-3.37) L, FEV1% at 65.98±9.35 (30.06-79.50) and FEV1/FVC ratio % at 66.88±3.28 (59.56-70.10). All of the participants had an FEV1% of between 50 and 80, which was classified as moderate severity. The PImax was 63.02±26.83 (23-124 cm H2O) and 6MWD 304.14±89.88 (110-495) m, whereas, the total QoL score and NO level was 1.18±0.77 (0.0-2.8) and 5.76±3.85 (2.2-14.20) μmol, respectively.
Pulmonary Function test values, PImax 6MWD, NO, and Total QoL score (n=35).
| Parametres | Mean±SD (min-max) |
|---|
| Pulmonary function test |
| FVC (L) | 2.12±0.67 (0.6-4.25) |
| FVC (%) | 93.89±11.01 (71.43-115.21) |
| FEV1 (L) | 1.48±0.59 (0.65-3.37) |
| FEV1 (%) | 65.98±9.35 (30.06-79.50) |
| FEV1/FVC (%) | 66.88±3.28 (59.56-70.10) |
| PImax (cm H2O) | 63.02±26.83 (23-124) |
| 6MWD (m) | 304.14±89.88 (110-495) |
| NO (μmol/L) | 5.76±3.85 (2.2-14.20) |
| Total QoL score | 1.18±0.77 (0.0-2.8) |
FVC: Forced vital capacity; FEV1: Forced expiratory volume at one second; Pimax: Maximal inspiratory mouth pressure; MWD: Minute walking distance; Qol: Quality of life; NO: Nitric oxide
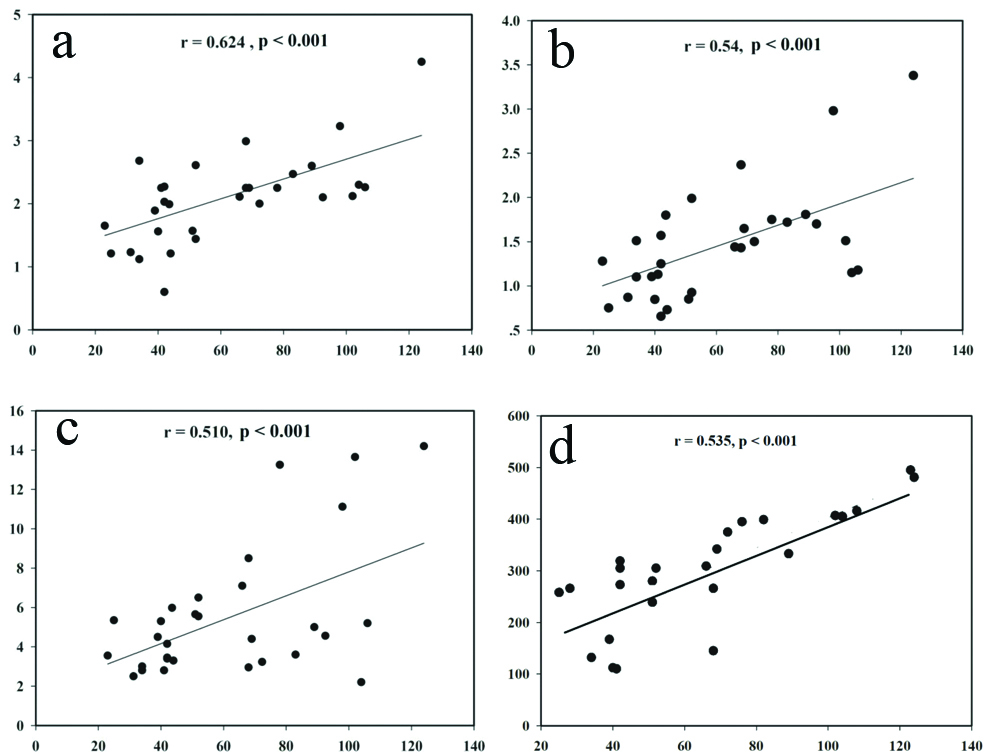
Results of the correlation analysis from the Pearson’s correlation test are presented in [Table/Fig-3,4 and 5]. PImax had a significantly positive linear relationship with the FVC (L) (r=0.624, p<0.001) [Table/Fig-4a], FEV1 (L) (r=0.539, p<0.001) [Table/Fig-4b], and NO level (r=0.51, p<0.001) [Table/Fig-4c], but it did not correlate to the FVC (% predicted) (r=0.237, p=0.170), FEV1 (% predicted) (0.167, p=0.337), FEV1/FVC ratio (% predicted) (r=0.115, p=0.512), or total QoL score (r=-0.328, p=0.054). Moreover, the result found the significant correlation between PImax and 6MWD (r=0.535, p<0.001) [Table/Fig-4d].
Correlation between PImax, the 6MWD and lung function, NO, and total QoL score (n=35).
| Parametres | FVC (L) | FEV (%) | FEV1 (L) | FEV1 (%) | FEV1/FVC (%) | NO (μmol/L) | Total QoL score |
|---|
| PImax (cm H2O) | r=0.624 p=<0.001 | r=0.237 p=0.170 | r=0.539 p<0.001 | r=0.167 p=0.337 | r=0.115 p=0.512 | r=0.51 p<0.001 | r=0.328 p=0.054 |
| 6 MWD (m) | r=0.396 p=0.018 | r=0.187 p=0.153 | r=0.548 p<0.001 | r=0.232 p=0.167 | r=0.55 p<0.001 | r=0.416 p=0.013 | r=-0.579 p<0.001 |
FVC: Functional vital capacity; FEV1: Forced expiratory volume at one second; Pimax: Maximal inspiratory mouth pressure; NO: Nitric oxide; QOL: Quality of life; R: Correlation efficient; M: Metre; Cm H2o: Centimetre of water
Correlation of PImax (cm H2O) (X-axis) to FVC (L) (a), FEV1 (L) (b) NO (μmol/L) (c), and 6MWD (d) (Y-axis) (n=35).
Correlation of the 6MWD (m) to FVC (L) (a); FEV1 (L) (b); FEV1/FVC (%) (c); total QoL score (d); and NO (μmol/L); (e) (Y-axis) (n=35).
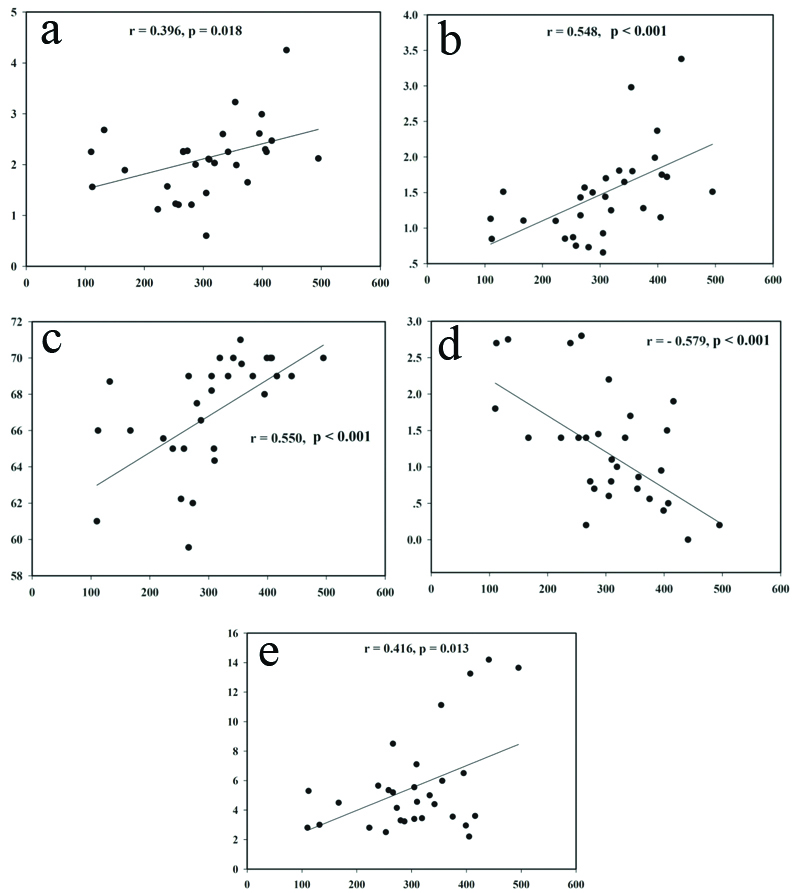
In addition, the 6MWD had a significantly positive linear relationship with the FVC (L) (r=0.396, p=0.018), FEV1 (L) (r=0.548, p<0.001), FEV1/FVC ratio (% predicted) (r=0.550, p<0.001), and NO level (r=0.416, p=0.013), the same as in the inverse linear relationship with the total QoL score (r=-0.579, p<0.001). Whereas, it did not correlate to the FVC (% predicted) (r=0.187, p=0.153) or FEV1 (% predicted) (r=0.232, p=0.167) [Table/Fig-5a-e].
Discussion
Results of the pulmonary function test in the 35 participants showed that severity of the disease can be classified as moderate because the mean percentages of FEV1 and FEV1/FVC ratio were 65.98±9.35 and 66.88±3.28, respectively, based on the reference value of predicted FEV1% (50%≤FEV1<80%) and ratio of FEV1/FVC (<70%), in accordance with the criteria of the Global Initiative for Chronic Obstructive Lung Disease (GOLD) [18]. PImax or maximal peak inspiratory pressure is important in evaluating respiratory muscle strength from the physiological outcome in the clinic, in order to investigate respiratory muscle weakness related to dyspnea or insufficient pulmonary ventilation. Previous evidence reported that an average PImax of less than 60 cm H2O is related to severe dyspnea [23]. Moreover, a previous study by Demedts M et al., reported that PImax was the single most sensitive result of respiratory muscle weakness [24], including the clinical value of PImax in humans, which was thought to be greater than 80 cm H2O, according to an ATS statement [25], or 60 cm H2O [26]. However, this study found the wide range of PImax from 23 to 124 cm H2O without dyspnea symptoms among stable COPD participants that may be adapted from stable chronic stage or behavior of daily life.
Although most of the participants in this study were classified as moderate severity, results found a positive correlation of PImax to FVC (L) and FEV1 (L). This implies that Vital Capacity (VC) should be one of many factors related to the PImax result. Previous evidence found that lower VC reflected on low PImax in neuromuscular disease [27], thus possibly referring to the correlated result between PImax and FVC (L) in this study. In addition, this can explain why PImax must be evaluated from quick inspiratory effort and Functional Residual Capacity (FRC) or Residual Volume (RV) in order that higher lung volume can provide higher PImax [28]. FEV1 (L) indicated severity of airway obstruction from the many parametres of the pulmonary function test. In the case of healthy people, FEV1 should be more than 80% or predicted according to the GOLD [18]. The result of FEV1 had various values of 0.65-3.37 L in the 35 participants of this study. The medication survey found that a bronchodilator was used in 19 participants, i.e., a Seretide™ Multiple Dose Inhaler (MDI) in 12 and Berodual® MDI in 7. All of these participants did not use bronchodilators regularly, but only when they were needed or on dyspnea aggravation. In addition, a bronchodilator was not permitted 6 hours before data evaluation. Therefore, the effects of a bronchodilator could not influence the results in this study, which were similar to those in a previous one that found a correlation between PImax and FEV1 (L) in COPD patients [29].
Moreover, the result showed significant correlation between PImax and 6MWD, which is consistent with previous studies by Kabitz HJ et al., and Khalil M et al., who found highly significant correlation between the percentage of MIP (MIP%) and 6MWD [30,31]. Previous evidence showed that Quadriceps Force (QF) significantly related to walking capacity. In addition, PImax and QF contributed to 6MWD significantly in stepwise multiple regression analysis [5]. Unfortunately, this study did not determine QF, although this muscle is in a large muscle group that involves walking capacity. On the other hand, an important factor for exercise tolerance is maximal oxygen consumption (VO2max) in the body. Although some evidence showed that the 6MWD did not correlate to VO2max in eight patients with Pulmonary Arterial Hypertension (PAH) [32], it did have a significant correlation with eight patients who were supported with Left Ventricular Assist Devices (LVAD) [33], as in COPD patients [34]. Furthermore, a previous study reported that the predicted percentage of VO2max also had significant FEV1% in COPD patients [35]. Therefore, the correlation between VO2max, 6MWD and PImax should be confirmed among COPD participants in future. However, this study proposed that better walking capacity and respiratory muscle strength possibly relate to higher pulmonary function from the relationship of PImax, 6MWD and pulmonary function.
The results of QoL showed an inverse linear relationship with the 6MWD. The CCQ was developed originally by van der Molen T et al., and consisted of ten questions relating to symptom, mental and functional states [19]. However, there was no statistical correlation between total QoL score and PImax, but they were related to 6MWD. The results of inverse relations interpreted that a total QoL score of higher value related to poor health status with shortened walking distance. On the other hand, a total QoL score of lower value related to good health status with longer walking distance [1]. Moreover, the analysed data from the correlation test also found a significantly related total QoL score and FVC (L) (r=0.346, p=0.042) or FEV1 (L) (r=0.494, p=0.002). Thus, it can be supported that pulmonary function should reflect on QoL, similar to a previous clinical study by O’Donnel DE et al., who demonstrated a marked difference in QoL in COPD patients [36].
Finally, the results of NO showed a positive relationship with PImax and the 6MWD. In basic terms, NO that is produced by NOS in endothelial cells induces dilatation of the vessels [9], which should involve walking capacity and respiratory muscle contraction from blood flow. However, a previous study proposed that NO associated with pathological pathways possibly predicts airway obstruction depending on its severity [37]. In contrast, a previous result showed that NO did not differ among severe COPD patients, due to NO inducible NO synthase being in any muscles when comparing with non-COPD patients [38], whereas, this study found a significant correlation of NO to either PImax or the 6MWD when performed in COPD participants with moderate severity. Although there has been no evidence to show correlation between NO level and PImax or the 6MWD, this preliminary study found a positive relationship. Therefore, it has been proposed that vessel vasodilation may occur possibly in respiratory muscles and large muscle groups in the legs.
Limitation
Although this study found a correlation at the moderate level in all significant results, a sample size of 35 stable COPD participants with moderate severity is possibly small. Therefore, application at different stages of mild and severe severity should not be applied exactly.
Conclusion
This preliminary study showed that respiratory muscle strength and walking capacity correlate with pulmonary function, QoL, and NO levels. Therefore, the status of pulmonary function, which depends on severity of COPD, should affect respiratory muscle strength, walking capacity and QoL. In this regard, the NO level possibly involves the blood flow to both respiratory and peripheral muscles.
BMI: Body mass index; CBC: Complete blood count; WBC: White blood cells; RBC: Red blood cells; Hb: Haemoglobin; Hct: Haematocrit; PLT: Platelet
FVC: Forced vital capacity; FEV1: Forced expiratory volume at one second; Pimax: Maximal inspiratory mouth pressure; MWD: Minute walking distance; Qol: Quality of life; NO: Nitric oxide
FVC: Functional vital capacity; FEV1: Forced expiratory volume at one second; Pimax: Maximal inspiratory mouth pressure; NO: Nitric oxide; QOL: Quality of life; R: Correlation efficient; M: Metre; Cm H2o: Centimetre of water