Solitary rim enhancing lesion in the brain parenchyma is a common diagnostic problem in neuroimaging. The differentials are very wide and include both neoplastic and non-neoplastic causes. In developing countries tuberculomas and NCC make up for majority of infectious cause. Clinically most of the times both present with similar symptoms [1]. It is difficult to differentiate them when they present with identical CT and conventional MR findings [2]. The primary route of CNS tuberculomas is via blood from a primary active focusor a dormant lesion present in other parts of the body [3]. Neurocysticercosis (NCC) of the Central Nervous System (CNS) is caused by the larval stage of the pork tapeworm Taenia solium. Both typically involve the gray-white junction. Many cases of solitary enhancing lesion caused by NCC are seronegative because the parasite is already dead or because a single parasite does not elicit a strong antibody response, similarly many cases of tuberculosis do not show any relevant evidence of systemic tuberculosis to confirm the diagnosis [4]. Both the conditions can present as a solitary lesion or multiple lesions [5,6]. On conventional MRI most tuberculomas typically appear as solitary ring enhancing lesions on gadolinium-enhanced T1-weighted images and infrequently as a conglomerated ring-enhancing mass [7]. NCC has four different stages the vesicular, colloidal vesicular, granular nodular and nodular calcified which are recognised on imaging. It is the colloidal vesicular and granular nodular stages which present as ring enhancing lesions with perilesional oedema which poses a diagnostic challenge with tuberculomas [8,9].
The main basis for deciding whether the lesions are inflammatory or not, are the CT or MRI picture. This radiological diagnosis is sometimes supported by the evidence of tuberculosis in some other parts of the body (commonly lung or lymph nodes). In which case evidence like fever, raised ESR may go along with radiological picture and suggest an inflammatory lesion. This evidence would only point to it being inflammatory and not being very specific or confirmatory. In such a scenario, techniques such as MRS that can provide additional biochemical information and diffusion imaging that is based on restriction of water molecules by lesion would increase the possibility of a correct diagnosis [10,11].
Materials and Methods
This was a retrospective study done where the MRI scans of 30 patients referred to our institution between January 2013 to December 2015 were reviewed. The patients were diagnosed as either tuberculomas or NCC. The study was approved by the Institutional Review Board. The clinical history, physical assessment, routine baseline investigation and prior CT scans were also reviewed in detail. MRI scans were acquired on 1.5 tesla MRI machine. Imaging sequences included T1W, T2W, FLAIR, DWI, MRS images and post contrast T1W FS images. The Volume Of Interest (VOI) from lesion was selected on SE-T2 weighted images for Single Voxel Spectroscopy (SVS). In 10 cases, spectra from uninvolved healthy brain parenchyma were taken for comparison. All the imaging findings were reviewed by two separate fellowship trained Radiologists who had more than 10 years’ experience in neuroimaging. Findings of conventional MR Sequences, MR Spectroscopic and DWI were analysed and then tabulated. Clinical diagnosis of the disease was confirmed by reasons to clinical trials (albendazole 15 mg/kg for one week for NCC and appropriate ATT for tuberculoma) in terms of remission of clinical symptoms (feeling of well-being, decreases seizure frequency) and follow-up imaging for decrease in size of lesion and perilesional oedema. Post treatment follow-up serial imaging were done for a period of six months and evaluated for its diagnostic value. The data was pooled and analysis of observations was done and the results were discussed. Statistical analysis included assessment of differences in the metabolic peaks on MRS in NCC and tuberculomas, likewise presence and degree of diffusion restriction in both these conditions.
Results
The study included 30 patients (21 male and 9 female) with newly diagnosed granulomatous lesions (NCC and tuberculoma). Mean age of presentation was 21.8 years with patients was ranging from 7 to 50 years. Supratentorial lesions (96.66%) were significantly greater than infratentorial (3.33%). Parietal lobe was the most common location in supratentorium closely followed by frontal lobe. Only one lesion was seen predominantly in the posterior fossa (left cerebellum).
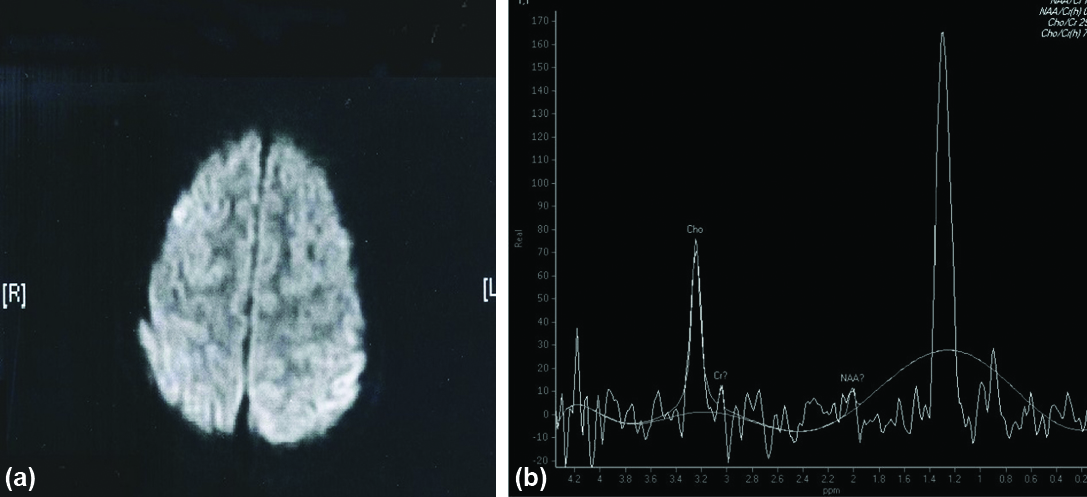
Spectroscopic pattern in control group and uninvolved healthy brain parenchyma of the affected patients were studied [Table/Fig-1,2]. Choline and creatinine levels were normal and choline/creatinine ratios were also normal in all cases of NCC. There was no lipid peak in NCC. Out of the 13 patients with NCC lesions 11 showed specific peaks [Table/Fig-3]. In four patients lesions had acetate peak at 1.9 ppm and in five patients lesions had succinate peak at 2.4 ppm and two patients had both the peaks in NCC [Table/Fig-4,5]. Extremely low level of metabolites with poor signal ratio was observed in two patients of NCC. In all the patients with tuberculoma expect for one lesions showed predominant lipid resonances at 0.9, 1.3, 2.0 ppm [Table/Fig-6]. In all tuberculoma lesions the succinate and acetate levels were normal. 7 out of 17 tuberculoma lesions showed increased Cho/creatinine ratio (greater than 1) and almost all the lesions showed elevated normalised Cho/Cr ratio reflecting increased membrane damage and cellularity tuberculoma. In 14 out of 17 patients with tuberculoma lesions showed diffusion restriction (hyperintense of DW) [Table/Fig-7]. In 3 out of 17 patients with tuberculoma lesions didn’t give diffusion restriction [Table/Fig-8,9,10,11 and 12]. Out of three patients with tuberculoma, in which lesions didn’t give diffusion restriction (hypointense) two lesions had hypointense core on T2 reflecting that diffusion restriction in tuberculoma depends on internal nature of the lesion (liquefaction and caseation). All the cases of NCC were hypointense on DWI (No Restriction) [Table/Fig-3]. Final diagnosis of NCC was emphasised on raised succinate (2.4), acetate (1.9) peak in MRS and negative restriction on DWI. In case of tuberculoma, diagnosis was based on raised lipid peak in MRS and raised Cho/Cr (>1) and restricted DW. Follow-up after treatment was done for a period of six months and evaluated for its diagnostic value [Table/Fig-13].
Spectroscopic pattern in control group and uninvolved healthy brain parenchyma of the affected patients.
| N | Age range | Mean age | Cho/cr. | Lipid | Lactate | Succinate | Acetate |
|---|
| White matter of healthy volunteer | 10 | 10-30 | 22 | 1.29 (0.20) | - | - | - | - |
| White matter of uninvolved healthy brain parenchyma in affected patients | 10 | 7-50 | 24 | 1.20 (0.19) | - | - | - | - |
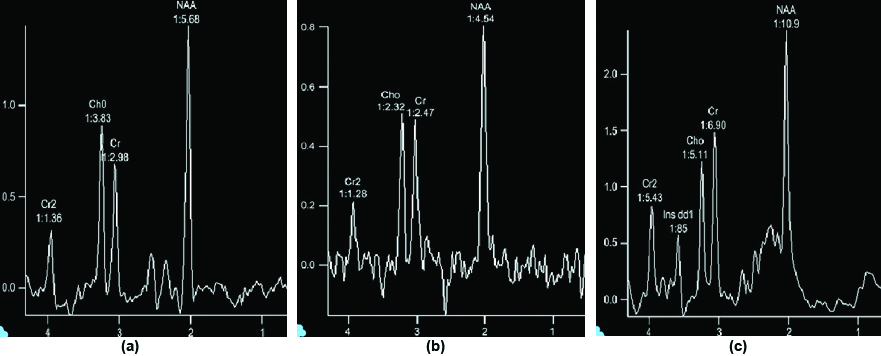
Normal MR spectroscopy (a,b,c) 30 ms, 135 ms and 270 ms respectively.
MRS and diffusion parameters of NCC.
| S. No. | Age/sex | Location | No. of Lesion | MRS | Diffusion |
|---|
| NAA | Cho | Cho/Cr. | Succinate | Acetate | Lipids |
|---|
| 1 | 10/M | Rt. Parietal | 1 | Low | N | N | - | + | - | Hypointense |
| 2 | 16/M | Rt. Parietal | 1 | Low | N | N | Extremely low level of metabolites with poor SNR | Hypointense |
| 3 | 12/M | Rt. Parietal | 1 | Low | N | N | + | + | - | Hypointense |
| 4 | 12/M | Lt. Frontal | 1 | Low | N | N | + | - | - | Hypointense |
| 5 | 14/M | Diffuse | Multiple | Low | N | N | + | - | - | Hypointense |
| 6 | 11/F | Rt. Frontal | 1 | Low | N | N | Extremely low level of metabolites with poor SNR | Hypointense |
| 7 | 8/M | Rt. Frontal | 2 | Low | N | N | - | + | - | Hypointense |
| 8 | 26/M | Diffuse | Multiple | Low | N | N | + | + | - | Hypointense |
| 9 | 46/M | Diffuse | Multiple | Low | N | N | + | - | - | Hypointense |
| 10 | 20/M | Rt. Frontal | 1 | Low | N | N | + | - | - | Hypointense |
| 11 | 27/M | Rt. Parietal | 1 | Low | N | N | - | + | - | Hypointense |
| 12 | 22/F | Lt. Frontal | 1 | Low | N | N | + | - | - | Hypointense |
| 13 | 18/M | Rt. Frontal | 1 | Low | N | N | - | + | - | Hypointense |
Axial DWI (a) showing hypointense lesion in left frontal lobe (NCC) [No Restriction]. MR spectroscopy (b) of above lesion shows prominent succinate peak at 2.4 ppm.
DWI (a) and T2W (b) images of NCC in Lt Frontal lobe shows no restriction (hypointense). MR spectroscopy (c) of the lesion shows prominent succinate peak at 2.4 ppm prominent acetate peak at 1.9 ppm. Succinate > Acetate indicate degenerating cysticerci.

MRS characteristic of tuberculoma.
| S. No. | Age/Sex | Location | MRS | MRS Normal brain | Normalised metabolite rations |
|---|
| Lipid | Cho/Cr. | Cho/Cr. | NAA/Cr | Cho/Cr. | NAA/Cr. |
|---|
| 1 | 49/M | Lt. Thalamus | 1.3,1.9 | 0.619 | 0.79 | 2.455 | 1.6904 | 0.252 |
| 2 | 7/F | Rt. Occipital | 1.3 | 0.646 | 1.041 | 1.316 | 1.483 | 0.491 |
| 3 | 50/F | Rt. Parietal | 1.3 | NQ | NP | NP | NQ | NQ |
| 4 | 36/M | Scattered all over | 1.3,1.9 | 1.593 | 0.77 | 2.410 | 1.3396 | 0.657 |
| 5 | 12/F | Rt. Occipital, Pons | NQ | NQ | NP | NP | NQ | NQ |
| 6 | 16/M | Lt. Post. frontal | 1.3 | 1.03 | 1.037 | 1.358 | 2.4727 | 0.7584 |
| 7 | 12/F | Rt. Occipital | 1.3 | NQ | NP | NP | NP | NQ |
| 8 | 18/F | Rt. Parietal | 1.3 | 1.441 | 0.85 | 1.455 | 1.6596 | 0.9906 |
| 9 | 8/F | Lt. Parietal | 1.3 | 0.4 | 0.79 | 2.50 | 2.05 | 0.16 |
| 10 | 22/M | Cerebellum | 1.3 | 0.428 | 0.81 | 2.47 | 1.744 | 0.173 |
| 11 | 28/F | Rt. Parietal | 1.3 | NQ | NP | NP | NQ | NQ |
| 12 | 42/M | Lt. Fronto-Parietal | 1.7 | 0.873 | 1.043 | 1.372 | 1.671 | 0.637 |
| 13 | 31/M | Lt. Temporal | 1.3,1.9 | 1.6 | 0.75 | 2.39 | 1.4 | 0.62 |
| 14 | 19/M | Lt. Frontal | 1.3,2.2 | 1.3262 | 0.857 | 1.461 | 1.547 | 0.908 |
| 15 | 26/M | Lt. Frontal-Parietal | 1.3 | 1.42 | 0.82 | 1.425 | 1.63 | 0.98 |
| 16 | 24/M | Rt. frontal | 1.3,2.0 | 1.007 | 0.785 | 2.467 | 1.034 | 0.409 |
| 17 | 12/M | Lt. Insular | 0.9,1.3 | NQ | NQ | NP | NQ | NQ |
NP: Not performed; NQ: Not quantifiable
Diffusion characteristic of tuberculoma.
| S. No. | Age/Sex | No. of lesion | Location | T2 appearance center | Diffusion (b=1000 s/mm2) |
|---|
| Periphery | Center |
|---|
| 1 | 49/M | 1 | Lt Thalamus | Hyperintense | Hypointense | Hyperintense |
| 2 | 7/F | 1 | Rt. Occipital | Hyperintense | Hypointense | Hyperintense |
| 3 | 50/F | 1 | Rt. Parietal | Hyperintense | Hypointense | Hyperintense |
| 4 | 36/M | Multiple | Scattered all over | Hyperintense | ND | Hyperintense |
| 5 | 12/F | 2 | Rt. Occipital and pons | Hyperintense | Hypointense | Hyperintense |
| 6 | 16/M | 1 | Lt. post. frontal | Hypointense | Hypointense | Hypointense |
| 7 | 12/F | 1 | Rt. Occipital | Hyperintense | Hypointense | Hyperintense |
| 8 | 18/F | 1 | Rt. Parietal | Hyperintense | Hypointense | Hyperintense |
| 9 | 8/F | 1 | Lt. Parietal | Hyperintense | Hypointense | Hypointense |
| 10 | 22/M | 3 | Cerebellum | Hyperintense | Hypointense | Hyperintense |
| 11 | 28/F | 1 | Rt. Parietal | Hyperintense | Hypointense | Hyperintense |
| 12 | 42/M | 1 | Lt. Fronto-parietal | Hyperintense | Hypointense | Hyperintense |
| 13 | 31/M | 1 | Lt. Temporal | Hyperintense | Hypointense | Hyperintense |
| 14 | 19/M | 1 | Lt. Frontal | Hyperintense | Hypointense | Hyperintense |
| 15 | 26/M | 1 | Lt. frontal-Parietal | Hyperintense | Hypointense | Hypointense |
| 16 | 24/M | 1 | Rt. Post frontal | Hyperintense | Hypointense | Hyperintense |
| 17 | 12/M | 1 | Lt. Insular cortex | Hyperintense | Hypointense | Hyperintense |
DWI (a) showing incomplete ring pattern of restricted diffusion. MR spectroscopy (b) shows prominent lipid peak at 1.3 ppm in tuberculoma.
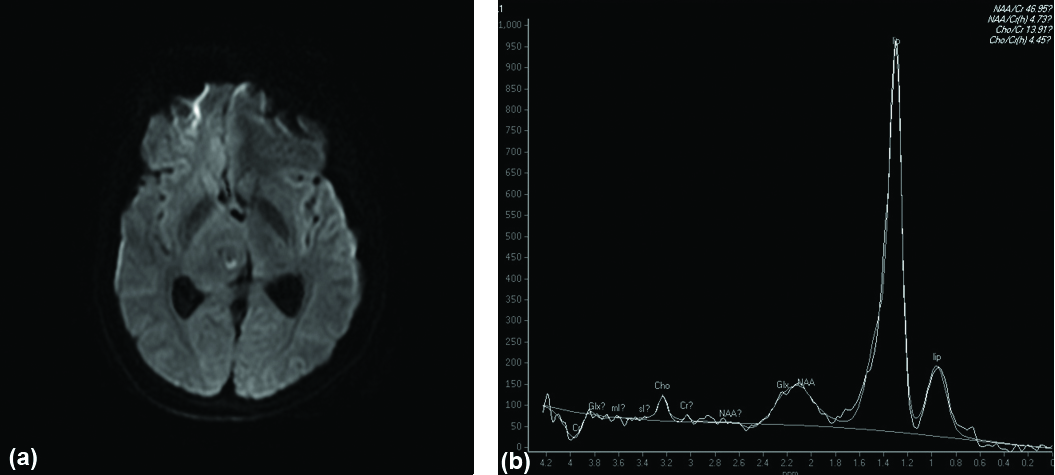
Axial ADC map (a) showing hypointensity in left fronto-parietal region in tuberculoma (Restricted Diffusion). Sagittal post contrast T1W image (b) shows conglomerate ring enhancement of the lesion. MR spectroscopy (c) of above lesion shows Choline/creatinine ratio >1 and prominent lipid peak at 1.3 ppm in tuberculoma.

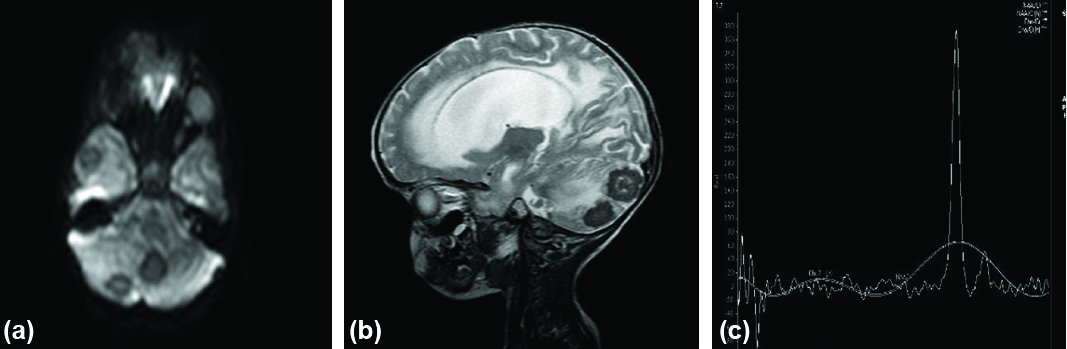
Axial DWI (a) showing lesions with central restricted diffusion in right cerebellar hemisphere, vermis and right temporal lobe. Sagittal T2W image (b) showing central hypointensity in tuberculoma (Caseating Necrosis). MR spectroscopy (c) of above lesion shows prominent lipid peak at 1.3 ppm in tuberculoma.
DWI sequence (a) shows restricted diffusion in right frontal lobe. MR spectroscopy (b) of above lesion shows prominent lipid lactate peak at 1.3 ppm in tuberculoma.
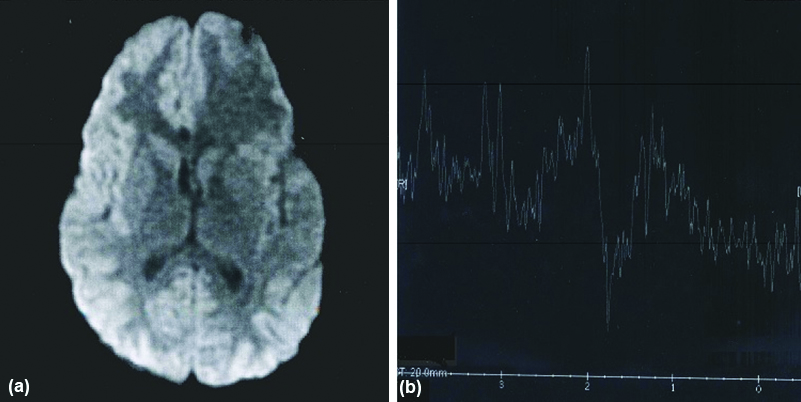
Axial FLAIR image (a) showing cystic lesion of NCC with eccentric speck (scolex) in Rt. frontal lobe. DWI (b) shows no diffusion restriction. MR spectroscopy (c) shows extremely low level of metabolites with poor signal noise ratio in NCC.

Final diagnosis on follow-up scans after therapy.
| Presumptive radiological diagnosis | Final diagnosis based on remission of clinical symptoms and reduction of the size of the lesion and perilesional edema on follow-up scan after therapy |
|---|
| + | - |
|---|
| Tuberculoma (n=17) | 16 | 1 |
| NCC (n=13) | 13 | 0 |
| Only 1 patient of tuberculoma didn’t respond well to treatment and the condition still deteriorated further. Follow-up scan revealed multiple additional lesions and diagnosis was revised as metastasis. |
Discussion
Our study included 30 patients with newly diagnosed inflammatory granulomas (NCC and tuberculoma). They were subjected to conventional MRI mainly with DW sequence and MRS. Spectroscopic measurements were also obtained from uninvolved healthy brain tissue in affected patients and healthy volunteers. Majority of cases were in the age group of 10-20 years (14 out of 30, 46.6%) with most falling between 10-30 years (21 out of 30, 70%). There were 21 male patients and 9 female patients suggesting significant male predilection. Age range of patients was between 7-50 years and mean age was 21.8 years. Supratentorial lesions (96.66%) were significantly greater than infratentorial (3.33%). Parietal lobe was the most common location in supratentorium closely followed by frontal lobe. Only one lesion was seen predominantly in the posterior fossa (left cerebellum). In four patients, lesions were scattered all over the brain parenchyma. Most common mode of presentation was seizure. Next in frequency was headache. Less common modes of presentations were focal neurological deficit, altered sensorium and cerebellar symptoms.
In our study, significant markers for NCC were raised amino acid peaks. In eight patients of which four patients had raised acetate peak (1.9), five had raised succinate (2.4) and two patients had both acetate and succinate peaks. Jayakumar PN et al., reported the MRS findings in racemose cysticercus cyst and found raised peak at 2.4 ppm (succinate) in these lesions which were similar to the results in our study [12]. Mishra AM et al., reported the same result in their study by concluding raised acetate, lactate and succinate in NCC [13]. Faria AV et al., studied the pattern of MRS in non-neoplastic encephalitic lesions (like NCC, MS infarct, heterotopias, neurofibromatosis, encephalitis) and found raised succinate peak (2.4 ppm) in NCC and total regression of the lesion was observed after treatment with albendazole [14]. Agrawal M et al., reported a similar kind of results when he evaluated three large intraparenchymal isolated degenerating cysticerci primarily based on in vivo MRS and subsequently confirmed histologically. He noted either succinate peak or more succinate than acetate in degenerating cysticerci and acetate alone or acetate in higher concentration than succinate in anaerobic brain abscesses [15]. Jayakumar PN et al., reported the similar kind of result in their study on 16 patients with intracranial cestodal cyst (3 hydatid and 13 NCC) and found large resonance at 2.4 ppm confirmed as succinate found in all cestodal cyst and concluded succinate as a metabolite in cestodal cyst infecting human CNS [16]. In two patients our study showed extremely low level of metabolites with poor Signal Noise Ratio (SNR) likely because the lesions are either cystic (viable) or calcified (dead). Jayasunder R et al., showed results similar to our study i.e., extremely low level of metabolites with poor SNR can itself act as a marker for NCC [17].
In our study, all the lesions diagnosed as NCC were hypointense on DW i.e., no restricted diffusion. Raffin LS et al, showed similar results in their study on DW findings in diagnosed NCC and concluded all lesions had hypointense signal on DW and similar ADC values as CSF [18]. However, our results were contradictory to study done by Shetty B et al., to analysed the diffusion finding in granulomatous lesions and concluded central diffusion restriction seen in vesicular stage of NCC and peripheral restriction in tuberculoma [19].
Intracranial tuberculoma are characterised by MR spectra pattern predominantly involving lipids. Lipid peaks are seen at 0.9, 1.3, 2.0, 2.8 ppm. A phosphoserine peak at 3.7 ppm is also commonly found. Lipid resonances at 0.9, 1.3 ppm are assigned to methylene groups and terminal methyl groups of fatty acids founds within the center of tuberculoma. Lipids as marker for tuberculoma were first suggested by Gupta RK et al., [20,21]. The major part of tubercle bacillus is known to contain lipids since saturated fatty acid are known to be involved in the production of tubercles. In vitro proton MRS studies on perchloric acid and lipid extracts of tubercular granuloma have shown resonances similar to those observed from mycobacterium bacilli. For the above-mentioned reasons and also since lipid resonance are not seen in proton spectrum from normal human brain, they have been noted as a possible marker of tuberculosis.
MRS has also been shown to be useful in differentiating tubercular from pyogenic abscess, while tubercular abscess reveals predominant lipid peak, pyogenic abscess reveals in addition amino acid at 0.9 ppm with variable combination of acetate, succinate and alanine glycine related to breakdown caused by proteolytic enzyme [20]. Although most tubercular lesions reveal lipid peak on MRS a similar pattern of dominant lipid peak with near depletion of normal metabolites may be seen in toxoplasmosis [22].
From our study, we found very specific markers for tuberculoma. Out of 17 patients with tuberculoma, 16 had raised lipid peak at 0.9, 1.3 and 2.0 ppm. Twelve had peak at 1.3 and 3 had 2.0 and 1 had peak at 0.9 and 1.3 ppm. All the lesions of tuberculoma in which spectra were acquired within the voxel including variable part of wall show elevated normalised choline/creatinine ratio ranging from (1.034 to 2.473), mean±SD (1.621±0.403) and normalised NAA/creatinine ratio ranged from (0.252 to 0.990), mean±SD (0.544±0.296).
Khanna PC et al., attempted differentiating giant extra axial tuberculoma and masquerading meningioma in one pregnant patient and concluded raised predominant lipid peak at 1.33 ppm raised choline and barely perceptible NAA in tuberculomas [23]. Javier PE et al., studied the roles of MRS in differentiating tuberculoma and NCC and found high peak of lipid, more choline, less NAA and creatinine [24]. Choline/creatinine ratio was >1 in all tuberculoma but none of the cysticerci, which were similar to our results. Mishra AM et al., reported the same result in their study by showing raised lipid lactate peak in tuberculoma [13]. Kanminogo M et al., studied the MRS findings in two cases of tuberculoma and reported similar kind of results i.e. raised lipid choline in one case and raised lipid lactate in another [25]. Gupta RK et al., studied the same results in their study on 33 cases of tuberculoma and concluded raised lipid at 0.9, 1.3, 2.0 and 2.8 ppm in 26 patients while lipid along with choline at 3.2 ppm in remaining seven patients [20].
Jayasunder R et al., showed results similar to our study, concluding the presence of lipid as a marker for differentiating tuberculoma from nonspecific inflammatory granuloma and NCC [17]. Large lesions having necrotic center can also give rise to lipid peaks, hence cases showing exclusively lipid peaks should be interpreted carefully.
Our study showed significant DW findings in tuberculoma. Out of the 17 patients, in 14 patients lesions had diffusion restriction (hyperintense) and three didn’t give diffusion restriction (hypointense). Shetty B et al., showed peripheral diffusion restriction in tuberculoma [19]. Mishra AM et al., reported the same results by concluding restricted diffusion with reduced ADC in tuberculoma [13]. Kanminogo M et al., studied the diffusion findings in two histologically proven tuberculoma and found that bright signal intensity in core of the lesion on DW [25]. Basoglu OK et al., reported the same result in their study on conventional and DW imaging of tuberculomas in multiple ring enhancing lesions with restricted diffusion and on follow-up normal DW and ADC values were obtained [26].
Our results were contradictory to the results by Vasudev MK et al., to conclude in their study as mostly no restriction of diffusion as a diagnostic parameter of tuberculoma [27]. Out of the three lesions which didn’t give tuberculoma (hypointense on DW), two lesions had hypointense center on T2; this was probably due to the caseation necrosis seen in tuberculoma. Batra A et al., showed similar kind of the results in the study by concluding that those lesions which had hyperintense center on T2 were hyperintense on DWI and those lesions which had hypointense center on T2 was hypointense on DWI [28]. There was no relation to the presence of lipid peak on MRS with signal intensity on center of lesion. A lipid peak in MR spectra was seen in both lesions with increased and decreased signal intensity center as seen on DW or T2 weighted imaging. The presence of lipid was seen in both lesions with increase and decreased signal intensity in center which amplifies both solid caseation and liquefaction necrosis in tuberculoma can yield lipid peak on MRS. The presence of lipids peak in liquefied necrosis is related to presence of lipid in tubercular bacilli as well as breakdown products of gray-white matter. While in solid caseation necrosis infiltration with lipid-laden macrophage probably contributes to lipid signal.
Limitation
Histopathological correlation of the diagnosis was not available. However, in endemic countries like in India presumptive diagnosis of the lesions followed by appropriate clinical trial (ATT for tuberculoma and albendazole for NCC) is preferred over biopsy. Non- availability of Diffusion tenser imaging. Non-availability of SWI (Susceptibility Weighted Imaging) or BOLD Venographic Imaging. It acquired at 4 Tesla MRI machine. Spectroscopy helps only in larger lesions and lesions which are far away from bony skull.
Thus, we concluded that addition of MRS and DWI to routine imaging rather than employing these studies alone will increase the diagnostic yield and obviates the need for unnecessary biopsy and help the clinician in immediate management.
Conclusion
Tuberculoma and NCC remains the two most common infectious cause of ring enhancing intracranial lesions in developing countries. Since the management of both these conditions are entirely different, it is important to diagnose them in the early course of the disease. Given similar clinical symptoms and imaging findings on CT and conventional MR it is most often difficult to differentiate these two conditions. MRS and DWI employed together helps to differentiate them and prevents delay in initiation of treatment.
NP: Not performed; NQ: Not quantifiable