Risk management is one of the most important concepts of clinical governance that, if it is done well may prevent latter problems. Risk management in health care includes various measures done in order to improve and ensure service safety for the clients [1]. Patient care environment is composed of three sections as follows: buildings, medical equipment and the staff [2]. Different statistics are published on incidence and prevalence of medical errors at different hospitals. According to estimations, one out of every 10 people referred to hospitals experience mishaps, half of which can be prevented. One third of such events hurt patients, the consequences of which can range from long-term hospitalisation to the death of clients [3,4]. Risk is a threat of event or measurement that adversely affects organisation abilities in achieving its aims. Actually, risk management includes recognition, evaluation and control of potential accidental risks whose consequences are clearly considerable losses [5].
In general, there are two views on human risks as the main faults of service systems in hospitals: personal views and systemic views. In personal view, human faults are focused and persons are blamed for their forgetfulness, lack of attention, low motivation, carelessness, negligence, lack of courage and moral weakness; that is because human faults result in mishaps based on this view’s assumptions: on the other hand, systemic view focuses on conditions under which man works [5]. Faults are inevitable even at great organisations; according to this idea, they try to improve work conditions instead of changing people in order to treat faults [6]. Risk management deals with reducing undesirable effects of internal and external events that affect organisational actions adversely [7,8]. To increase safety at hospitals, considering procedures based on prospective risk management are effective [9]. Risk management must include a set of continuous and developing processes that are used all over the hospital strategies and must consider past, present and future risks. It has been mentioned in other studies that implementing risk management has caused reduction of faults rate in urgency wards [3,4]. Introduction of systemic thinking in identification and correction of faults in health sector has been concurrent with using different methods of risk management in such sector [9]. Therefore, considering the importance of risk management, the researchers aimed to evaluate risk management status in state hospitals of medical training in Ilam, in 2015.
Materials and Methods
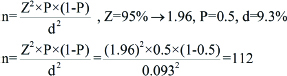
In the present descriptive analytic study, 112 registered nurses including Licensed Practical Nurse (LPN), BSc. and MSc. working at Ilam state hospitals of medical training {Imam Khomeini (47 N), Shahid Moastafa Khomeini (50 N) and Ayatollah Taleqani (15 N) Hospitals} were selected, randomly. Based on the following formula sample size was calculated:
The data collection form was of two sections, the first section included demographic information of nurses (age, sex, marital status, educational level, job experience, work-site and weekly shifts rate) and the second section included 6 dimensions of risk management evaluation. The staff’s knowledge about risk management (8 items), organising how to manage risks (8 items), policies and procedures (6 items), risk training (8 items), risk management status (6 items), monitor and analysis, evaluation and risk control (9 items). In total, our questionnaire of 45 items of 5-choices was in accordance to the LIKERT SCALE (very high, high, mean, low, very low) (10). Each item carried a score of 1 to 5, so that the least score was 45, while the most total score was 225, divided into 4 levels of weak (45-89), average descending (90-134), average ascending (135-179), and good (180-225).
Inclusion and exclusion criteria: The inclusion criteria for the staff nurses who filled out the questionnaire fully was holding a BSc or MSc degree in nursing besides working at the hospital with a least precedence of work in the administrative or clinical positions. Exclusion criteria included the nurses who filled out the questionnaire incompletely or were reluctant to take part in the study.
To collect necessary data, the researchers referred to hospitals at round-the-clock shifts and distributed questionnaires among the staff nurses, then collected the filled-out questionnaires. The process of distribution and collection of questionnaires lasted from July to August 2015. Data analysis was done using SPSS V.19. Descriptive statistics (frequency) and inferential statistics (independent T-student and ANOVA Tests) were used to determine the relationship between risk management variables and demographic characteristics of the nurses (significance level was p<0.05).
Results
According to the results, 56 (50%) were male and 56 (50%) were female; 106 of them (98.2%) worked at hospital wards and 6 (1.8%) worked at the administrative section of the hospital [Table/Fig-1]. [Table/Fig-2] shows statistical relationship between risk management dimensions and demographic variables (age, sex, marital status, education rate, work record, work-site and weekly shifts rate).
Baseline variables of participants.
| Demographic variables | | Number (Percent) |
|---|
| Age | 22-29.9 year | 48 (42.9%) |
| 30-39.9 year | 42 (37.5%) |
| 40 year and older | 22 (19.6%) |
| Sex | Male | 56 (50%) |
| Female | 56 (50%) |
| Marital status | Single | 30 (26.8%) |
| Married | 82 (73.2%) |
| Education level | L.P.N | 10 (8.9%) |
| BS.C | 96 (85.7%) |
| MS.C | 6 (5.4%) |
| Job experience | Less than 5 years | 34 (30.4%) |
| 5-9.9 years | 38 (33.9%) |
| 10-14.9 years | 6 (14.3%) |
| 15 years and more | 24 (21.4%) |
| Nurse’s function | Administrative | 6 (1.8%) |
| Clinical | 106 (98.2%) |
| Weekly shift rate | Less than 7 shifts | 28 (25%) |
| 7 shifts | 28 (25%) |
| More than 7 shifts | 56 (50%) |
| Position | Supervisor* | 6 (5%) |
| Head nurse** | 12 (10%) |
| Nurse | 94 (85%) |
*Supervisor: supervises the performance of all the medical staff and head nurses on duty
**Head nurses are responsible to monitor the nurses’ functions at hospital wards
Correlation between demographic variables and dimensions of risk management.
| Demographic aspects of risk management | The staff knowledge p-value | Regulatorystatus p-value | The policies and procedures p-value | Management education p-value | Management position p-value | Monitoring analysis-evaluation p-value | Risk management (overall score) p-value |
|---|
| Age | 0.14 | 0.11 | 0.42 | 0.59 | 0.91 | 0.43 | 0.284 |
| Sex | 0.34 | 0.007 | 0.001 | 0.001 | 0.73 | 0.58 | 0.08 |
| Marital status | 0.74 | 0.007 | 0.04 | 0.74 | 0.81 | 0.15 | 0.64 |
| Education level | 0.72 | 0.002 | 0.91 | 0.36 | 0.35 | 0.33 | 0.41 |
| Job experience | 0.007 | 0.06 | 0.72 | 0.77 | 0.65 | 0.71 | 0.288 |
| The work-site | 0.97 | 0.86 | 0.61 | 0.76 | 0.003 | 0.91 | 0.01 |
| Number of shifts | 0.07 | 0.29 | 0.54 | 0.45 | 0.20 | 0.002 | 0.32 |
| Position (Supervisor, head nurse, staff nurse) | 0.17 | 0.79 | 0.79 | 0.97 | 0.73 | 0.88 | 0.92 |
Notes: pes of implant
As [Table/Fig-2] shows, there was significant correlation between organisation status of risk management and education (p=0.002), furthermore, there was significant correlation between policies, procedures and education level of management and sex (p=0.001). Accordingly, the female scores were more than those of the male. There was a significant correlation between management status and work-site (p=0.003). The administrative nurses obtained higher scores. There was a significant correlation between monitor, analysis, evaluation against weekly shifts rate (p=0.002). Nurses with more work shifts achieved more scores. Other information has been provided in [Table/Fig-2].
[Table/Fig-3] illustrates under-demographic variables rate which shows that the scores gained by the age group of 22-29.9-year-old, female as well as single nurses, MSc. degree holders, nurses with 5-9.9 years of work experience, administration staff, nurses with 7 shifts weekly, and head nurses were more than those gained by the other groups.
Risk Management scores based on demographic data.
| Demographic variables | | The average score on risk management |
|---|
| Age | 22-29.9-year-old | 118.58 |
| 30-39.9-year-old | 118.14 |
| 40 years and older | 104 |
| Sex | Male | 114.96 |
| Female | 116.14 |
| Marital status | Single | 120.94 |
| Married | 113.55 |
| Educational level | L.P.N | 96.4 |
| BS.C | 116.28 |
| MS.C | 135.3 |
| Job experience | Less than 5 years | 110.88 |
| 5-9.9 years | 120.63 |
| 10-14.9 years | 120.5 |
| 15 years and more | 103.08 |
| Nurse’s function | Administrator | 135.33 |
| Clinical | 114.40 |
| Weekly shift rate | Less than 7 shifts | 113.14 |
| 7 shifts | 127.57 |
| More than 7 shifts | 110.07 |
| Position | Nurse | 113.84 |
| Head nurse | 130.80 |
| Supervisor | 116.25 |
[Table/Fig-4] presents the risk management mean and standard deviation which shows risk management mean and standard deviation in total is 115.53±29.4, the highest score was 194 and the least score were 52. The nurses knowledge on risk management were 22.62±5.32 (the highest score) and mean and standard deviation of policies and procedures on risk management were 14.60±5 (the lowest score of risk management items).
Mean±SD of risk management dimensions.
| Dimension | Min | Max | Mean±SD |
|---|
| The staff knowledge about risk management | 8 | 33 | 22.62±5.32 |
| Concerning the organisation of risk management | 8 | 38 | 20.48±5.7 |
| The policies and procedures in the field of risk management | 6 | 28 | 14.6±5 |
| Training in risk management | 8 | 39 | 10.73±6.27 |
| Risk management status | 6 | 28 | 14.94±4.85 |
| Monitoring, analysis-evaluation and risk control | 9 | 39 | 22.16±6.84 |
| Risk management score (in total) | 45 | 205 | 115.53±29.4 |
Discussion
Results showed that the majority of nurses obtained the mean descending score of 90-134, which was consistent with other investigations already accomplished in Iran [10-12]. In the case of risk management dimensions, the nurses knowledge on risk management was 22.62±5.32 (the highest) and policies and procedures score was 14.60±5 (the lowest). But Farokhzadian J et al., showed that approximately, 57% of samples in at least one of training sessions regarding risk management. The status of risk management system was weak to moderate score (2.93±0.72-3.18±0.66). Among the domains of risk management, the highest mean was related to domain of monitoring, evaluation and risk control (3.18±0.72); the lowest mean was related to domain the staff’s knowledge about risk management (2.93±0.66) [13]. These results were not consistent with the results demonstrated by Zarezade M et al., [10]. Varieties in statistical population besides the time and location of the research can be considered a reason for such a difference. Verbano C et al. concluded that different cultures resulted in different attentions to risk management [11]. In a study on risk assessment of Isfahan hospitals radiology sections, the risk management status ranged from weak to average [12].
Human errors can reduce through providing regulations and standards of risk management and availability of them at hospitals. Taking into consideration the risk management role and position in managing risks at hospitals and their sections as well as providing organisational associations can not only prevent mistakes and probable faults in hospitals, but they may also provide more security for the clients [10,14]. Furthermore, Handel DA et al., noted that preventive plans of risk management and its running quality can be effective in reduction of medical errors [4].
According to the index study, there was no significant relationship between the total score of risk management and education (p>0.005), which is in consistent with the results demonstrated by Zaboli RK et al., [8].
Our study results showed that policies and procedures of risk management at Ilam hospitals had low scores which were inconsistent with the results claimed by Verbano C et al., [11]. It can also be claimed that such hospitals’ attempts to improve their quality of risk management is very low. A fact that proves the high necessity to improve their potentialities in medical service quality and increase the clients’ and staffs’ security equally.
To have a data homogenity, our study did not include other health care providers (such as physicians, administrators of nursing services, hospital managers and other medical professionals).
Limitation
The number of similar or related studies in the country are limited and thus the lack of comparisons of their results with the present study existed.
Recommendations
Workshops on risk management is proposed to be held for clinical staff, especially doctors and nurses.
Conclusion
According to the scores gained on the 6 dimensions of risk management, risk management status at Ilam hospitals was low. Thus, it seems necessary to take further steps in providing the clinical staff with more information on the risk management. In this regard, clinical governance system, providing training programs, taking appropriate policies and procedures, and establishment of supervising programs on risk management are suggested to be followed at the hospitals.
Source of funding: Ilam University of Medical Sciences (ILUMS).
Ethical approval: This article has been adopted as the output of a research project approved by the ILUMS Ethics Committee.
*Supervisor: supervises the performance of all the medical staff and head nurses on duty
**Head nurses are responsible to monitor the nurses’ functions at hospital wards
Notes: pes of implant