Periodontal disease is the most prevalent in worldwide adult population, but the severity and the susceptibility differ among individual subjects [1]. CPITN is widely adopted in many epidemiological studies of periodontal disease and used to assess disease distribution and trends [2]. In addition, the progression does not occur evenly in all teeth in same dentition and varies with respect to tooth type. Typically, periodontal tissue destruction seems to be frequently observed in posterior teeth, as compared to anterior teeth [3,4]. These differences of susceptibility are difficult to explain accurately, because periodontal disease is multifactorial and affected by numerous disease-related factors, including such as tooth anatomy, tooth alignment and microbial species [1-4]. So far, various epidemiological studies have proven the difference of severity among tooth sites [5], however have not taken into account of all variables related to periodontal disease. CSA defines these variables including unmeasurable factors as latent variables and analyses complex relationship among variables [6]. In this article a latent environment variable, named ‘Intraoral Circumstances’, is newly introduced, which is directly affecting CPITN data and indirectly affecting the number of remaining teeth.
To understand the actual state of these deviations, the following statistical analysis method, CSA, is utilised to clarify the quantitative differences of the positional relationship of six positions in the oral cavity, i.e., Upper, Lower, Right / Front and Left, which has not been attempted till now. Fortunately, there are CPITN data [7], which is easily evaluating the affected condition of the group’s periodontal disease and has the feature of high reproducibility, so this is able to be carried out the precise analysis. The clinical use of CPITN data so far was useful for the record of individual’s disease condition, the evaluation of the time-series progress situation, and the mutual comparison of the pathology between small groups. However, it was not possible to quantitatively evaluate the disease condition of a large group exceeding hundreds of patients.
The aim of the study was to understand the quantitative actual condition as the epidemiological characteristics. Furthermore, from a broad perspective, it is attempted to distinctly show the characteristics of patients living in Tokyo area. And it is also meant as an example of the possibilities of elucidating the epidemiological characteristics of a subject’s group. To be more precise, the actual purpose is to assess the epidemiological situation in susceptibility by quantitatively evaluating between the sensitivity to periodontal disease and the tooth loss among six tooth positions using CPITN and CSA.
Materials and Methods
This retrospective cross-sectional study utilised the data of 1,003 first visit patients attending the periodontics clinic of the Dental Hospital in Tokyo Medical and Dental University (TMDU) from March 2014 to July 2014. This population consisted of both healthy and systemically compromised patients. Inclusion criteria were aged 20 or over and dentate subjects. No other inclusion criteria were used for patient’s selection. Subjects who visited not only voluntarily with periodontal symptoms such as gum pain, swelling, loose teeth, and so on, but also to be referred for specialised treatment by periodontists from another dental clinic, were recruited.
Exclusion criteria were as follows: age <20 and edentulous. A total of 112 subjects were excluded from the study due to their age (<20 years) and incomplete clinical data (age, sex or partial CPITN value).
CPI codes were recorded as follows: healthy and absence of gingival bleeding (score 0), gingival bleeding (score 1), presence of supra or subgingival calculus (score 2), probing pocket depth of 4-5 mm (score 3) or probing pocket depth >6 mm (score 4) [9]. CPITN assessment was conducted for each of the six positions in the oral cavity, represented by 10 index teeth (17 and 16: upper right molar, 11: upper anterior, 26 and 27: upper left molar, 36 and 37: lower left molar, 31: lower anterior, 46 and 47: lower right molar) [7]. In these sextants with no teeth for missing, these sites were defined as blank.
This study was collated with the approval of the Ethical Committee of TMDU Dental Hospital (number, 1085, May 21, 2014). Subject data are shown in [Table/Fig-1]. All procedures performed in studies involving human participants were in accordance with the institutional ethical standards and/or national research committee and with the 1964 Helsinki declaration and its later amendments or comparable ethical standards.
Data related to 891 subjects.
| Age years | 20-29 | 30-39 | 40-49 | 50-59 | 60-69 | 70-79 | 80- | Total |
|---|
| Number of subjects | 24 | 54 | 124 | 212 | 280 | 163 | 34 | 891 |
| Age, years | | | | | | | | 58.9±13.1 |
| Male gender (%) | 13 (54.2) | 23 (42.6) | 41 (33.1) | 58 (27.4) | 83 (29.6) | 53 (32.5) | 13 (38.2) | 284 (31.9) |
| Tooth count | 28.6±1.3 | 27.4±4.1 | 26.1±3.3 | 25.4±4.2 | 23.9±5.0 | 22.0±6.9 | 21.3±6.8 | 24.4±5.3 |
| CPI≥3 (%) | 15 (62.5) | 43 (79.6) | 89 (71.8) | 170 (80.2) | 229 (81.8) | 134 (82.2) | 34 (100) | 714 (80.1) |
| CPI=4 (%) | 5 (20.8) | 31 (57.4) | 58 (46.8) | 126 (59.4) | 158 (56.4) | 96 (58.9) | 29 (85.3) | 503 (56.5) |
| Blank (%) | 3 (12.5) | 3 (5.6) | 22 (17.7) | 49 (23.1) | 112 (40.0) | 77 (47.2) | 21 (61.8) | 287 (32.2) |
| Number of CPITN>3 | 1.6±1.7 | 2.6±2.0 | 2.3±2.0 | 2.6±1.8 | 2.4±1.7 | 2.3±1.7 | 2.8±1.3 | 2.4±1.8 |
| Number of CPITN=4 | 0.4±1.2 | 1.4±1.7 | 1.2±1.7 | 1.3±1.5 | 1.1±1.3 | 1.1±1.3 | 1.3±1.0 | 1.2±1.4 |
| Number of BLANK | 0.1±0.3 | 0.1±0.6 | 0.2±0.7 | 0.4±1.0 | 0.8±1.2 | 1.2±1.6 | 1.3±1.6 | 0.7±1.2 |
Numbers after ± indicate standard deviations
The proposed CSA model is statistically examined for the propriety. Practical CSA operations, which is considered to be the most suitable for analyses of the cases, was performed using the Amos-17.0 software (IBM-SPSS, Tokyo, Japan), and the values for evaluating the goodness of fit with the model were determined by the same software.
In order to verify the accuracy of the model used in this analysis, there are three evaluating indicators. Namely, Goodness of Fit Index (GFI) shows the suitability of applied model [8], which takes a value from 0 to 1, between the worst and the best, and how the model is able to explain the present phenomena. If GFI becomes higher, then the applied model has large fitness. Adjusted GFI (AGFI) is the second opinion of GFI and has the following feature. GFI≥AGFI If AGFI is much reduced compared to the GFI, the model is not a desirable one. Residual Mean Square Root (RMR) designates that if its value is the smaller, then the larger becomes the goodness of fit of the model. If RMR is 0, it shows the full goodness of fit [8].
Statistical Analysis
CSA by Amos-17.0 is one of the statistical methods that can examine the relationship between multiple construct concepts and is characterised by being able to perform factor analysis and multiple regression analysis at the same time. This software implements a general approach to data analysis known as structural equation modelling, which highlights the simplicity underlying this powerful approach to data analysis. It can analyse data from several groups at the same time, and can also estimate the mean of exogenous variables and the intercepts of the regression equations. Amos accepts the path diagram as a model specification and graphically exhibit the parameter estimate in the path diagram.
Results
The simplest model exhibited a one-way structure from the proposed ‘Intraoral Circumstances’, at the centre, to the ‘Number of Remaining Teeth’ via CPITN of six positions and the obtained quantitative results are shown in [Table/Fig-2]. The flow of the computed scheme ran from the centre towards the peripheries in [Table/Fig-2]. The important components of [Table/Fig-2] were the standardised partial regression coefficients between Intraoral Circumstances and CPITN of six positions (middle figures at dotted lines) and between CPITN of six positions and the number of remaining teeth (top and bottom numeral figures in [Table/Fig-2]). The former, between Intraoral Circumstances and CPITN of six positions, i.e., 0.72, 0.64 to 0.70, comparatively reveals the individual factors from Intraoral Circumstances to CPITN of six positions. The latter, between CPITN of six positions and the number of remaining teeth, i.e., -0.06, -0.27 to -0.07, exhibits the separate factors from CPITN of six positions to the number of remaining teeth. These quantitative values in [Table/Fig-2], were very novel which have not been obtained so far, and the relative differences between the six positions were an interesting value based on 891 subjects.
Computed scheme and results of CSA with 891 subjects.
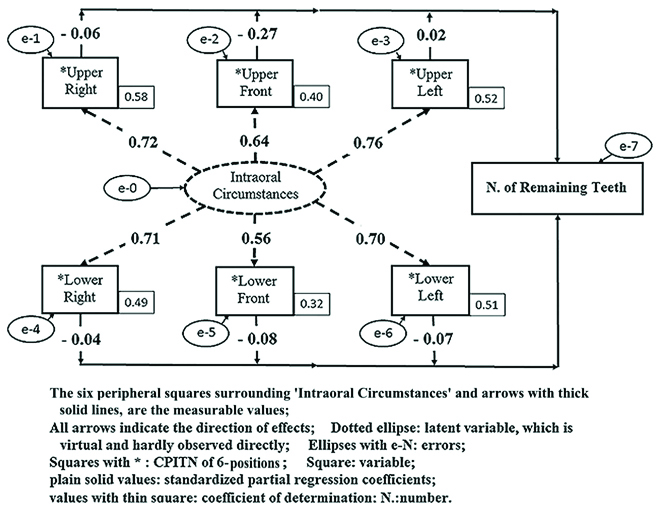
The coefficients of determination which evaluate the reliabilities of the values, thin squares attached at the lower right of six positions, represents the associations between variables. If these coefficients were much <1.0, then the predictive ability of the multiple regression equation was not high. The values obtained, i.e., 0.58, 0.40 to 0.51 of six positions, were modest, particularly when one considers these biological phenomena involved and the very large sample size of 891.
Small ellipses with the e-N (N: 0 to 7) in [Table/Fig-2], mean errors accompany the various noise factors of actual measurements. CSA considers measurement errors and aims to balance the entire model; this feature helps us in obtaining comprehensive and appropriate results.
The [Table/Fig-3] exhibits the three evaluating indicators of this model and analysis which shows how the proposed model is properly explained the immediate phenomena. According to [Table/Fig-3] consequently, the proposed model shown in [Table/Fig-2] was acceptable to explain the quantitative relations between Intraoral Circumstances and Number of Remaining Teeth via CPITN.
The goodness of fit values after CSA.
| GFI | AGFI | RMR |
|---|
| 0.981 | 0.941 | 0.075 |
GFI: Goodness of fit index for CSA; AGFI: Adjusted GFI; RMR: Root mean square residual
Discussion
Although there are many epidemiological studies showing the distribution of periodontal disease progression with respect to tooth type [4,10,11], the main objective of this paper was to perform statistical analysis by recognising the existence of latent variables, Intraoral Circumstances, that cannot be measured directly through experiments and to indicate individual values per tooth position related to periodontal severity and affecting the number of remaining teeth. The use of CSA, which is sometimes called SEM, was essential to carry it out. Even in the many previous cases, CSA excels in the ability to model potential variables that cannot be observed directly, and has provided many results in various social scientific analyses, also including some clinical data. Christ SL et al., were introducing results in ocular and other health research [9], Stein CM et al., provided examples of SEM analysis in genetic variants [12] and the successful construction of SEM models were described by Tarka P [13]. The method of CSA is believed to be used more in epidemiological fields which are also including partly social science factors [14].
In this study, the Intraoral Circumstances are defined as latent images and represent both the oral environment and condition related to disease susceptibility, such as environmental and host-modifying elements [15]. These contained both physiochemical components and virtual and global concepts, including wider epidemiological elements which are difficult to directly measure and clearly define. In CSA, the Intraoral Circumstances are conceptually described as directly affecting the CPITN values and indirectly affecting the number of remaining teeth. The three typical indicators showing the goodness of fit in [Table/Fig-3], suggest that the images and quantitative results are shown in [Table/Fig-2] are acceptable.
The important results of these analyses are the quantitative associations of comparative differences, shown as standardised partial regression coefficients, with plain solid values in [Table/Fig-2], between Intraoral Circumstances and CPITN of six positions and between CPITN of six positions and the number of remaining teeth. Actually, the standardised partial regression coefficients between Intraoral Circumstances and CPITN of six positions are higher in posterior teeth than anterior teeth. In addition, the coefficient of upper anterior teeth between CPITN of this section and the number of remaining teeth is the lowest in the six positions and negatively affects the number of remaining teeth in [Table/Fig-2]. These results suggest that molar teeth are susceptible to periodontal disease and the periodontal progression into upper anterior region is related to a small number of remaining teeth. Molar teeth, located on the distal portion of the dental arch and having multiple roots, are susceptible to periodontal disease and exhibit poor prognosis [16]. Furcation involvement, caused by periodontal progression in the inter-radicular septum of multiple rooted teeth, is refractory due to morphological complexity and limited accessibility [17]. The results of this study, based on the limited population size, should be interpreted with caution, but are consistent with those reported in earlier studies.
Limitation
This study is preliminary and has some limitations. The population in this study was limited to the patients visited periodontal clinic in TMDU dental hospital. CPITN was proposed in 1985 [7] and a widely used periodontal screening test, but has led to underestimation of periodontal severity due to partial recording system [18]. In addition, this study is not considered about various modifying factors of periodontal disease and define Intraoral Circumstances as a latent variable. However, the authors clarify the difference of the disease severity and the impact or risk factors on the number of remaining teeth among six positions by using CSA.
Conclusion
Statistical analysis using CSA successfully demonstrate the susceptibility of six positions in the oral cavity to periodontal diseases and tooth loss. It is possible to distinctly show the characteristics of patients living in Tokyo area. And, it is also meant as an example of the possibilities of elucidating the epidemiological characteristics of subjects, not limited to periodontal disease.
Funding
The work was supported by the Operational expenses of Tokyo Medical and Dental Univ.
Numbers after ± indicate standard deviations
GFI: Goodness of fit index for CSA; AGFI: Adjusted GFI; RMR: Root mean square residual