RA presents with deforming arthritis that is accompanied by systemic involvement in many patients. It affects multiple joints, most commonly hand and wrist. Morning stiffness, fatigue and loss of energy are usually observed in patients with RA. RA develops between the ages of 30 to 50 years and more than 75% of those affected are women. The prevalence of RA is 0.5% to 1.0% worldwide and 0.3% to 0.9% in India [1].
Autoimmunity is the basic pathogenesis in the development of RA and triggering of autoimmunity is influenced by the individual’s genetic makeup and environmental factors. T-cells are activated in response to auto-antigen that leads to joint destruction. Therefore, RA develops in response to an environmental agent in a genetically susceptible host. The total genetic risk for RA contributes to 60% of the disease burden and Human Leucocyte Antigen (HLA) alone are responsible for about 30-40% of genetic contribution in disease development, thus highlighting the role of other genes located in close proximity to DRB1. Some of the other genes that attribute to susceptibility of disease development are PTPN22, TFAIP3, STAT4, TRAF1/C5, IL2RB and CTLA4 [2].
The important cytokines in RA pathogenesis are TNF, interferons and interleukins. TNF-α, a proinflammatory cytokine plays a dominant role in RA pathogenesis as over expression of human TNF-α cytokine in transgenic mice has been shown to develop a polyarthritis which is very similar to RA [3]. Cytokine TNF-α level were found to be elevated in both serum and synovial fluid of RA cases and high level of TNF-α in RA cases was correlated with disease activity [4].
The level of circulating TNF-α, primary mediators of immune and inflammatory response, is partially genetically determined by TNF-α gene. Some reports suggest that around 60% variation in production of TNF-α is genetically determined [8]. The TNF-α gene is positioned between HLA-B and HLA-DRB1 genes; this led to speculation about its role in RA development [9]. Genetic regulation of TNF-α production is strictly controlled at all levels i.e., during transcription, post transcription, translation and post translation. Studies reports various SNPs in TNF-α gene, mainly in promoter region at positions -1031T/C, -863 C/A, -857 C/T, -575G/A, -376G/A, -308G/A, -244G/A and -238G/A [10,11]. These SNPs in promoter region are responsible for disease susceptibility and severity of RA [12]. Among these SNPs, TNFα-308G/A (rs1800629) polymorphisms, where wild allele is G and mutant allele is A, is most extensively studied with respect to its role in development, but the results from various populations are contradictory and data of RA cases Indian population is scarce. Therefore, the study was conducted to evaluate the frequency of TNF-α-308 G/A polymorphism among RA cases and healthy controls and its association with disease biomarkers, cytokine TNF-α, oxidative stress-antioxidant parameters and lipid profile.
Materials and Methods
In this analytical case-control study hundred (n=100) cases of RA were recruited from Medicine Outpatient Department at Guru Teg Bahadur Hospital, Delhi from January 2013 to July 2016. Guidelines of American College of Rheumatology Classification criteria (ACR, 2010) were followed for clinical diagnosis of RA [13]. Required sample size was computed with the help of genetic power calculator where ‘α’ level was fixed as 0.05 with 80% power of the study. Equal number (n=100) of age and sex-matched apparently Healthy Controls (HC), recruited from staff of University College of Medical Sciences and GTB Hospital were enrolled in the study. Prior to commencement of experimentation, the purpose of study was explained to every participant and informed written consent was obtained. All procedures performed in the studies involving human participants were in accordance with the ethical standards of the Institutional Research Committee and in the year 1964 Helsinki’s declaration and its later amendments or comparable ethical standards. The ethical clearance was obtained from Institutional Ethical Committee for Human Research (IEC-HR).
The effect of possible confounders was eliminated by excluding pregnant women and subjects with history of alcoholism, smoking, hypertension, diabetes, endocrinal disorders, deranged renal function, cardiac disease, chronic lung disease, current malignancy and other chronic inflammatory conditions.
Blood Sampling and Routine Parameters
Fasting blood sample were collected in Ethylenediaminetetraacetic Acid (EDTA) and plain vials for genomic study, estimation of oxidative stress-antioxidant parameters, Complete Blood Count (CBC), biochemical parameters, biomarkers of disease and cytokine level. For DNA isolation, 500 μL of whole blood from EDTA vial was aliquoted and stored at 4°C. Plasma was separated from rest of blood from EDTA vial by centrifugation of blood sample at 3000 rpm for 10 minutes. Small aliquots were stored at -80°C for further analysis of RF, a-CCP, TNF-α and CRP. Routine biochemical investigations such as kidney function test (urea and creatinine), uric acid, lipid profile test and liver function test were carried out as per standard laboratory protocols using commercial kits on autoanalyser UnicelDxC 600, Synchron Clinical System from Beckman Coulter Pvt., Ltd., USA. CBC was determined on Mythic 18 blood cell counter. Modified Westergreen method was used for Erythrocyte Sedimentation Rate (ESR) estimation.
DNA Isolation and TNF-A Genotyping
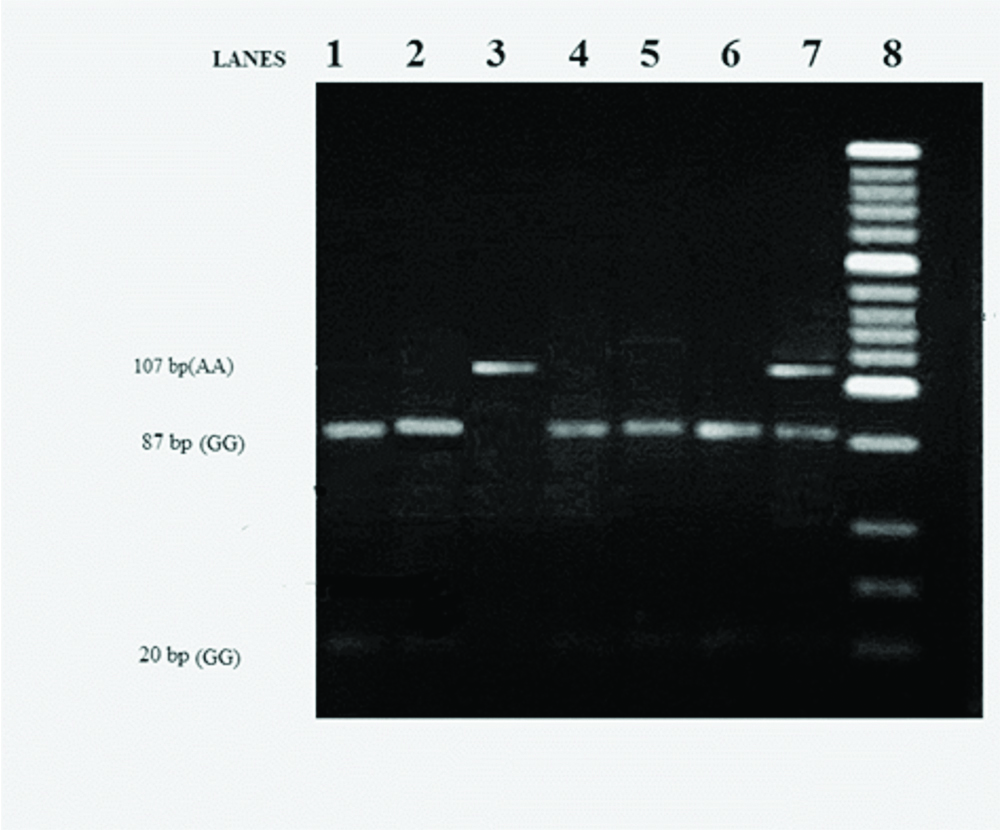
Genomic DNA extraction was performed from whole blood stored in small aliquots of 500 μL using commercially available DNA extraction kit (Zymoresearch, USA). The PCR of 107 base pair (bp) TNF-α gene at -308 in promoter region was carried out in a thermocycler (Mastercycler Gradient-5331, Eppendorf). Reagents were purchased from Bangalore Genei, Bangalore, India. Amplification was carried out with 50 ng DNA in a 50 μL reaction volume containing 0.75 mM each of the forward primer 5’-AGGCAATAGGTTlTGAGGGCCAT-3’ and reverse primer 5’TCCTCCCTGCTCCGATTCCG-3’. In the reaction mixture 1.25 U of Taq polymerase, 0.2 μmol/L of each deoxynucleotide (dNTPs), 2.5 mmol/L of MgCl2, 50 mmol/L of KCL, 10 mmol/L of Tris/HCl (pH 9.0) and 1% Triton X-100 was added. The reaction mixture was subjected to a defined PCR protocol, with initial denaturation at 94°C for 3 mins followed by 35 cycles of 94°C for 35s, 60°C for 45s and 72°C for 60s, with final extension at 72°C for 5 mins. After electrophoresis, the final PCR product of TNFα-308 G→A (107 bp) was visualised on 2% agarose gel stained with ethidium bromide (EtBr). After the confirmation of amplified PCR product, it was digested with NcoI (Fermentas) for 16 hours at 37°C. The final restriction fragments were visualised on 4% agarose gel stained with EtBr dye. Gel documentation system (UVP DIGI DOC-IT) was used for visualisation and documentation of bands. The digestion resulted in 20 bp and 87 bp fragments for -308 GG (wild type), 20 bp, 87 bp and 107 bp for -308 GA (heterozygote), and 107 bp for 308 AA (mutant) genotype [Table/Fig-1].
Gel electrophoresis image of PCR product after digestion of TNFα-308 SNP. Lanes 1-7 are RA samples where 87 bp and 20 bp bands in lane 1, 2, 4, 5 and 6 depicts -308 GG genotype; 107 bp band in lane 3 depicts -308 AA genotype; three 20 bp, 87 bp and 107 bp bands in lane 7 depicts -308 GA genotype; Lane 8, 20 bp DNA ladder.
Disease Specific Markers of RA and Cytokine Level
Assay for IgG antibodies to citrullinated protein and RF were done by ELISA using commercial kits (Omega Diagnostics Ltd., Alva, UK). TNF-α levels was measured using ELISA kit from Diaclone diagnostics (France). CRP level was measured by using ELISA kit (Ray Biotech, Norcross GA). Each parameter was assayed in duplicate.
Oxidative Stress-Antioxidant Parameters
Serum Malondialdehyde (MDA) level analysis, an indicator of lipid peroxidation, was done by standard reference method [14]. Ferric Reducing Ability of Plasma (FRAP), a measure of total antioxidant capacity, was measured as described by Benzie IF and Strain JJ [15]. Reduced Glutathione (GSH) analysis was done as described by Tietz F [16]. The activity of Glutathione S-Transferase (GST) was assayed spectrophotometrically using the method described by Habig WH et al., [17].
Statistical Analysis
All statistical analysis was done by using the Statistical Package of Social Sciences (SPSS; version 17). For the comparative analysis of demographic profile, routine biochemical parameters and biomarkers specific for RA, unpaired student’s t-test was used. The genotype prevalence of TNFα-308 in both groups was compared by calculating the odds ratio with 95% confidence interval using simple binary logistic regression analysis. The level of biomarkers (RF, anti-CCP, CRP, ESR), cytokine TNF-α, MDA and antioxidant parameters was compared in RA patients with different genotype by using one-way analysis of variance (ANOVA) test. A correlation between plasma TNF-α level and disease biomarkers (RF, anti-CCP, CRP, ESR) in RA cases was studied using Pearson’s correlation coefficient. Correlation between different parameters of oxidative stress and lipid profile were studied with the help of Pearson’s correlation. The significance of differences of TNF-α gene polymorphism from Hardy-Weinberg Equilibrium was tested using χ2 test. The observed frequency of TNF-α polymorphism in RA cases is in agreement with Hardy Weinberg equilibrium (Cases χ2=1.49, p>0.05; Controls χ2=1.83, p>0.05). The p-value less than 0.05 was considered significant.
Results
Baseline Demographic and Biochemical Parameters
The basic demographic profile and routine biochemical parameters of the RA cases and HC groups are presented in [Table/Fig-2]. BMI was significantly higher in RA cases than HC. The disease is more prevalent in females as evident from sex distribution in cases. Haemoglobin (Hb) level was significantly lower (p<0.001) in RA cases than HC. TC, LDL-C, TAG, and Very Low-Density Cholesterol (VLDL-C) were significantly higher (p<0.001), whereas HDL-C level was significantly (p<0.001) lower in RA cases than HC. Alkaline Phosphatase (ALP) activity and total protein levels were found to be significantly high (p<0.001) in RA cases than HC.
Demographic characteristics and Biochemical parameters of healthy controls and RA cases.
| Parameters | Healthy controls (n=100) | RA cases (n=100) | p-value |
|---|
| Age (years) | 40.8±6.7 | 41.6±6.3 | 0.70 |
| Sex ratio (female/male) | 84/16 | 87/13 | 0.66 |
| BMI (kg/m2) | 22.2±2.0 | 25.3±2.7 | 0.009* |
| Haemoglobin (gm/dL) | 12.6±1.2 | 11.2±1.7 | <0.001* |
| TC (mg/dL) | 162.4±21.0 | 237±25.0 | <0.001* |
| LDL-C (mg/dL) | 88.7±15.8 | 146.8±15.3 | <0.001* |
| TAG (mg/dL) | 126.3±22.2 | 184.7±20.5 | <0.001* |
| HDL-C (mg/dL) | 49.3±6.5 | 35.8±4.5 | <0.001* |
| VLDL-C (mg/dL) | 24.1±7.8 | 36.5±4.3 | <0.001* |
| ALP (IU/L) | 71.0±16.0 | 177.0±37.6 | <0.001* |
| Total bilirubin (mg/dL) | 0.67±0.19 | 0.68±0.18 | 1.00 |
| Direct bilirubin (mg/dL) | 0.37±0.10 | 0.38±0.10 | 1.00 |
| Serum albumin (gm/dL) | 4.4±0.7 | 4.4±0.6 | 0.021 |
| Total protein (gm/dL) | 7.1±0.6 | 7.3±0.6 | 0.008* |
Data are expressed as mean±SD. Unpaired t-test was applied for comparison. *Significantly different from healthy control at p<0.01.
BMI: Body mass index; TC: Total cholesterol; HDL-C: High density lipoprotein cholesterol; TAG: Triacylglycerol; VLDL-C: Very low-density lipoprotein cholesterol; LDL-C: Low density lipoprotein cholesterol
The disease specific markers, cytokine TNF-α and oxidative stress-antioxidant parameters of the two study groups are presented in [Table/Fig-3]. Specific markers of RA (ESR, RF, anti-CCP and CRP) along with cytokine TNF-α were significantly higher (p<0.001) in RA cases. MDA level and GST activity were significantly higher (p<0.001), whereas antioxidant parameters FRAP and GSH were significantly lower (p<0.001) in RA case than HC.
Disease biomarkers, TNF-α and oxidative stress-antioxidant parameters of healthy control and RA cases.
| Parameters | Healthy controls (n=100) | RA cases (n=100) | p-value |
|---|
| ESR (mm/hr) | 10.9±7.1 | 37.9±12.8 | <0.001* |
| RF(U/mL) | 48.2±25.4 | 126.6±23.3 | <0.001* |
| a-CCP(U/mL) | 0.37±0.6 | 19.4±6.3 | <0.001* |
| TNF-α (pg/mL) | 14.2±6.2 | 35.0±10.1 | <0.001* |
| CRP (mg/L) | 2.5±1.7 | 16.9±7.3 | <0.001* |
| MDA (nmol/mL) | 1.4±0.2 | 4.6±0.6 | <0.001* |
| GSH (μmol/mL) | 224.0±35.0 | 145.6±27.1 | <0.001* |
| GST (nmol/mg protein) | 0.97±0.26 | 3.1±0.80 | <0.001* |
| FRAP (μmol/L) | 537.4±57.7 | 223.6±25.4 | <0.001* |
Data are expressed as mean±SD. Unpaired t-test was applied for comparison. *Significantly different from healthy control at p<0.001.
ESR: Erythrocyte sedimentation rate; RF: Rheumatoid factor; A-CCP: Anti cyclic citrullinated peptide; TNF-α: Tumor necrosis factor alpha; CRP: C-reactive protein; MDA: Malondialdehyde; GSH: Reduced glutathione; GST: Glutathione-S-transferase; FRAP: Ferric reducing ability of plasma
TNF α-308G/A SNP and Disease Susceptibility
The genotypic frequency of TNF-308G/A polymorphism and the association of this SNP in disease development are depicted in [Table/Fig-4]. The genotypic frequency of wild homozygous (G/G), heterozygous (G/A) and mutant homozygous (A/A) in RA cases and HC were 45%, 48%, 7%; 61%, 37% and 2% respectively whereas allele frequencies are 0.69/0.31 in RA patients and 0.79/0.21 in HC. To evaluate the association of disease development with genotypes, the homozygous mutant (A/A) group was clubbed with the heterozygous group (GA) and Odds Ratio (OR) calculated. A positive and significant association of this SNP in disease development (OR=1.9, p=0.02) was observed.
Genotypic distribution of TNF-α-308 gene polymorphism in healthy controls and RA cases and association with disease development.
| Genotype TNF-308 G→A | Healthy controls (n=100) | RA cases (n=100) | Odds ratio | 95% Confidence interval | p-value |
|---|
| GG | 61 (61%) | 45 (45%) | ref | 0.99-3.1 | 0.06 |
| GA | 37 (37%) | 48 (48%) | 4.7 | 0.94-23.9 | 0.06 |
| AA | 2 (2%) | 7 (7%) | 1.9 | 1.09-3.4 | 0.02 |
The logistic regression analysis was performed for polymorphic analysis of TNFα-308 gene. Values were significant at p<0.05, GG=wild type, AA=mutants, G/A=heterozygous. Figures in parenthesis indicate percent values
TNF-308G/A SNP, Disease Specific Markers and Cytokine TNF-α Levels
The association between TNF polymorphisms (-308G/A) and the plasma levels of TNF-α, RF, anti-CCP, CRP and ESR are presented in [Table/Fig-5]. The presence of mutant allele A shows a significant increasing trend in plasma levels of disease markers that is anti-CCP (p=0.044), CRP (p=0.041) and TNF-α (p=0.034) in RA patients.
Levels of TNF-α and disease specific markers (RF, Anti-CCP, CRP, ESR) in context of different TNF genotypes in RA cases.
| Genotypes | RA cases (n=100) | TNF-α (pg/mL) | RF (u/mL) | Anti-CCP (u/mL) | CRP (mg/L) | ESR(mm/hr) |
|---|
| GG | 45 | 31.35±11.9 | 124.98±21.5 | 19.59±7.0 | 15.41±6.7 | 35.97±11.4 |
| GA | 48 | 33.69±10.9 | 127.98±25.8 | 19.09±5.3 | 17.59±7.4 | 38.42±10.6 |
| AA | 7 | 41.81±7.7 | 128.33±17.1 | 25.55±5.8 | 24.11±4.3 | 39.57±27.4 |
| p-value | 0.034* | 0.631 | 0.044* | 0.041* | 0.721 |
Data are expressed as mean±SD. One-way ANOVA test was performed in RA cases. *Significantly different from GG genotype at p<0.05
TNF-308G/A SNP and Oxidative Stress-Antioxidant Parameters
Oxidative stress marker and antioxidant parameter levels with reference to TNF genotype are presented in [Table/Fig-6]. Both MDA (p=0.016) level and GST (p=0.038) activity were found elevated significantly while antioxidant parameters (GSH and FRAP) showed a non-significant decrease in RA cases with AA genotype.
MDA, GST, GSH and FRAP levels in relation to different TNF genotypes in RA cases.
| Genotypes | RA cases (n=100) | MDA (nmol/mL) | GST (nmoles/mg protein) | GSH (μmol/mL) | FRAP (μmol/L) |
|---|
| GG | 45 | 4.39±0.6 | 2.98±0.8 | 149.90±23.3 | 226.56±23.1 |
| GA | 48 | 4.65±0.4 | 3.01±0.8 | 143.59±31.1 | 219.08.3±27.2 |
| AA | 7 | 5.36±0.4 | 3.88±0.5 | 137.28±29.14 | 235.63.7±23.1.5 |
| p-value | 0.016* | 0.038* | 0.316 | 0.215 |
Data are expressed as mean±SD. One-way ANOVA test was performed in RA cases. *Significantly different from GG genotype at p<0.05
Correlation
In this study, there was a positive correlation between serum TNF-α concentration and the serum level of anti-CCP (r=0.21, p<0.05) and ESR (r=0.22, p<0.05) were observed. MDA was found to have a significant and positive correlation with LDL (r=0.32, p<0.05) [Table/Fig-7].
Correlation between lipid profile and oxidative stress-antioxidant parameters in RA cases.
| Parameters | MDA | FRAP | GSH | GST |
|---|
| r-value | p-value | r-value | p-value | r-value | p-value | r-value | p-value |
|---|
| TC | 0.131 | 0.234 | -0.083 | 0.354 | 0.028 | 0.631 | 0.187 | 0.210 |
| TAG | 0.039 | 0.456 | 0.037 | 0.404 | 0.106 | 0.281 | -0.047 | 0.413 |
| LDL-C | 0.321 | 0.021* | -0.081 | 0.381 | -0.002 | 0.936 | 0.117 | 0.197 |
| HDL-C | -0.015 | 0.632 | 0.001 | 0.991 | 0.037 | 0.571 | 0.051 | 0.389 |
| VLDL-C | 0.003 | 0.981 | -0.024 | 0.615 | -0.103 | 0.273 | 0.069 | 0.402 |
*Correlation (r) is significant at the 0.01 level (2-tailed). Pearson’s correlation was applied to determine the correlation between lipid profile parameters and oxidative stress parameters in RA cases.
MDA: Malondialdehyde; GSH: Reduced glutathione; GST: Glutathione-S-transferase; FRAP: Ferric reducing ability of plasma; TC: Total cholesterol; HDL-C: High density lipoprotein cholesterol; TAG: Triacylglycerol; VLDL-C: Very low-density lipoprotein cholesterol; LDL-C: Low density lipoprotein cholesterol
Discussion
TNF-α gene polymorphism at -308 G/A within the promoter region has been found to be involved in the pathogenesis of many inflammatory diseases. Although, TNFα-308G/A polymorphism analysis have been done in RA patients in different populations, the reported results are conflicting. Along with detection of frequency of this polymorphism in RA cases and association with TNFα oxidative stress parameters, we attempted to determine correlation between levels of GSH, GST, MDA, FRAP and the lipid profile parameters. To the best of our knowledge, this is the first study reporting the association of TNFα-308G/A SNP with oxidative stress parameters, disease biomarkers and cytokine TNF-α levels in patients with RA. The correlation between levels of GSH, GST, MDA and FRAP with parameters of lipid profile in RA patients has also been reported for the first time.
Rheumatoid arthritis was observed to be more prevalent in females as evident from sex distribution in RA patients. Obesity was correlated with RA as BMI of RA cases was significantly higher which indicates that obesity was associated with development or it may be a sequel due to low physical activity. The significantly high total cholesterol, LDL-C, TAG, VLDL-C and decreased HDL-C observed in RA cases than HC, are in accordance with previous studies, wherein presence of significant dyslipidemia in RA patients has been reported [18]. Physical inactivity and proinflammatory cytokines are known to play a significant role in inducing dyslipidemia in RA [5].
Haemoglobin level was significantly lower in RA cases than HC. Proinflammatory cytokine TNF-α may have a role in apoptosis of erythroid cells in the bone marrow and anti-TNF-α agents may reduce the apoptosis of erythroid cells [19]. ALP activity and total protein levels were also high in RA cases Nanke Y et al., have also reported elevated serum ALP activity in rheumatoid arthritis although its aetiology is not clear [20]. This may be due to increase in bone disorders mainly osteoporosis in RA cases, leading to high ALP levels (Bone type ALP). Increased plasma total protein might be due to increased immunoglobulin levels.
In the present study, the absolute concentration of diagnostic markers anti-CCP, RF, CRP, ESR and cytokine TNF-α level were in RA cases. The elevation of disease biomarkers is usually linear with disease activity and correlated with clinical and radiological progression and disease outcome [21,22]. There was a significant rise in cytokine TNF-α level in RA cases. A meta-analysis by Wie ST et al., has shown similar results [23].
Elevated levels of lipid peroxides and impaired antioxidant defense system (increased GST and reduced GSH, FRAP) in the present study indicates extensive oxidative stress in RA cases. Chronic inflammation causes increased production of ROS that causes peroxidation of membrane lipids that leads to the formation of MDA, the marker of lipid peroxidation. GST is an antioxidant enzyme, that causes detoxification by inducing conjugation [24]. When there is increased ROS production, glutathione peroxidase detoxifies ROS by using GSH as a co-substrate, resulting in increased consumption of GSH, thereby leading to decreased GSH level. Moreover, increase in GST activity also uses GSH to act as a protective mechanism to combat increased ROS. FRAP is a marker of total antioxidant capacity of plasma. In the present study, a significantly low level of FRAP in RA cases was observed that might be either a sequel of increased oxidative stress or disabled antioxidant capacity. In a study conducted by in 2016 Mateen S et al., increased MDA and GST with reduced GSH and FRAP in RA patients was reported [25].
The present study reported that frequency of A allele (-308G/A) is 31% in RA cases and 21% in HC, whereas the frequency of G allele is 69% and 79% respectively. The mutant homozygous was pooled with the heterozygous mutant (G/A) to find out the association of this SNP in disease development. Results from present study suggest a significant association of A allele in disease development. These findings were similar to Lee YH et al., results who concluded that the subjects carrying -308A allele had increased susceptibility to RA [12]. Contrary to this, Gambhir D et al., have reported that TNF-α polymorphism at -308 for A allele was less frequent in RA cases than HC in north Indian population, whereas in a meta-analysis by Song GG et al., have reported that there was no association between TNF -308 A allele and RA [26,27].
Interestingly, in present study presence of A allele was found to be linked with increased TNF-α, anti-CCP, and CRP levels in RA. Our findings were similar to the results of another study which reported that this polymorphism is associated with increased plasma and synovial fluid TNF-α levels in RA cases [28]. In addition, A allele was also associated with higher MDA level and increased GST activity in RA cases. These findings indicate the involvement of this SNP in disease development, probably by increasing oxidative stress as well as the level of inflammatory cytokine TNF-α. Kundu S et al., have reported that MDA levels in synovial fluid were positively correlated with ROS and •OH radicals levels and also with the DAS-28 score, suggesting an association with disease activity [29]. The present study suggests that plasma TNF-α level is positively correlated with anti-CCP and ESR in RA cases. Presumably, MDA modification of constitutive proteins into RA-related neoantigens could have a significant effect on development of autoimmunity in RA cases.
It is known that inflammation coupled with increased oxidative stress may amplify dyslipidemia in RA cases which increase the risk for coronary heart diseases. Therefore, we attempted to define the correlation between increased oxidative stress and altered lipid profile parameters. In this study, MDA was found to be significantly correlated with LDL-C and it had a negative non-significant correlation with HDL-C. It was found that high levels of LDL-C in RA cases, however LDL-C is prone to get oxidised and forms oxidised LDL, thus leading to high level of oxidative stress marker (MDA). Mishra R et al., have also concluded that MDA and CRP correlated positively with cholesterol in RA [30]. Hence, free radical mediated oxidative stress can influence the plasma lipid concentrations and vice-versa. The present study suggests a decline in the activity of antioxidant markers with altered lipid profile and augmented lipid peroxides level in RA cases that is similar to earlier reports [31,32].
Limitation
The sample size was relatively small. The samples were collected from only one institute and therefore, the research findings cannot be generalised. In addition, the disease activity score of the RA cases was not taken into account. Other genes in close proximity to TNF-α in more severe cases of RA were not analysed. Further analysis of relatively larger and more diverse sample size along with detection of other relevant genetic polymorphisms are required to establish the practicability of this polymorphism as a budding genetic marker for RA susceptibility.
Conclusion
Genetic polymorphism studies can identify the susceptible people along with other risk factor and provide the opportunity for suitable interventions which may include alternate drugs/alternate drug dosage prior to, or shortly after therapy commences, thereby delaying or preventing the development of life-threatening disease. TNFα-308G/A appears to increase the probability for development of RA. To the best of our knowledge we believe that this is the first study reporting the association of TNFα-308G/A polymorphism with MDA and GST activity in RA cases. The plasma TNF-α levels had a positive and significant correlation with anti-CCP and ESR. Serum MDA level was also positively correlated with LDL-C in RA cases in Indian population.