Pre-Eclampsia (PE) is a pregnancy-specific hypertensive disorder that manifests after 20 weeks of gestation and is clinically identified by early onset of proteinuria and often oedema [1,2]. Although, it is the most frequently encountered medical complication during pregnancy, associated with high maternal mortality and morbidity, yet it lacks a reliable early means of diagnosis or prediction [3,4].
Proteinuria and hypertension in pre-eclampsia dominate the clinical condition since the chief organ involved is the kidney. Altered renal function is seen due to glomerular endotheliosis which is an essential component of pathophysiology of the disorder [5]. A sensitive Glomerular Filtration Rate (GFR) marker is needed to reflect the degree of glomerular endotheliosis and in turn pre-eclamptic status [6]. Measurement of serum creatinine is simple but up to 50% of GFR can be lost before significant elevation of serum creatinine can be observed and its accuracy is also hampered by assay interference and factors like age, gender and muscle mass [7]. The estimation of GFR by clearance test or radionucleotide based techniques, though reliable but are expensive and time-consuming which makes them unfavourable for routine monitoring. Therefore, development of a simple, accurate endogenous marker to estimate GFR is the need of the hour. Previous studies document the role of serum cystatin C as an endogenous renal indicator of early renal function decline and sensitive marker of degree of endotheliosis [8,9].
Cystatin C is a non-glycosylated, Low Molecular Weight (LMW) (13.3 kD) protein that is reabsorbed and catabolised by the proximal convoluted tubules. Serum cystatin-C is reported to be independent of muscle mass, diet, sex and age above 1 year [10,11]. Serum cystatin C increases considerably in patients with renal failure, like other LMW plasma proteins and even minute decline in GFR can significantly increase serum cystatin C levels [12]. Pre-eclampsia is characterised by a decrease in GFR and altered renal handling of cysteine protease inhibitors [9,13]. The renal structural changes allow the assessment of the pathogenesis of PE and remains central to its diagnosis and management.
However, the problem arises when renal impairment has to be diagnosed at an early stage or in a low-risk population. The transition between normal and seriously complicated pregnancy is gradual, renal dysfunction in PE remains undetermined and a delayed diagnosis often can lead to progressive renal failure and vascular disorders. Thus a sensitive means of detection of this multi-organ system disorder transition is essential for adequate screening and routine check-up to impend complications and improve maternal and foetal health [14].
Due to paucity of information on estimation of serum cystatin C levels in pregnant women in Indian population, the study was conducted to estimate the levels of serum cystatin C and creatinine in pre-eclamptic and healthy pregnant women and to assess the role of cystatin-C in determining the severity of PE.
Materials and Methods
Study Population
This case-control study was conducted from January 2014 to June 2014 in the Department of Biochemistry, Rajarajeswari Medical College and Hospital, Bengaluru, Karnataka, India. The study was approved by the institutional ethical clearance committee. Written informed consent was obtained from all subjects included in the study. Complete medical history was recorded and physical examination of each individual was done.
Inclusion Criteria
Clinically, diagnosed 50 pre-eclampsia women (primi and multigravida), aged 18 to 35 years were included as cases. Age-matched 50 apparently healthy pregnant women with >20 weeks gestation were included as controls.
Exclusion Criteria
Women with a history of diabetes mellitus, hypertension, thyroid disorders, twin/multiple pregnancies, any evidence of kidney, liver disease, chronic inflammatory diseases, or smoking habits were excluded.
Fasting venous blood samples (5 mL) were collected from antecubital vein in clot activator tubes while taking all aseptic precautions. The samples were allowed to clot and then centrifuged at 2000 rpm for 10 minutes. The serum was separated and stored at -20°C untill further analysis. Spot random urine sample was collected for urine albumin determination by dipstick method. Blood Pressure (BP) was measured by sphygmomanometry in supine relaxed position. Patients were not in labour when samples were collected. Mindray BS 300, fully automated analyser was used for estimation of serum cystatin-C levels by particle enhanced immunoturbidimetric method, as mentioned in the International Federation of Clinical Chemistry and Laboratory (IFCC) reference material ERM®DA471 from Diasys [15]. Fasting Blood Glucose (FBG) was estimated by Glucose Oxidase-Peroxidase (GOD-POD) method [16]. Serum creatinine was measured using modified Jaffe’s kinetic method without deproteinization as per Diasys kit’s protocol [17].
Statistical Analysis
The data were analysed using descriptive statistics. The results were presented as Mean±SD. Unpaired Student’s t-test was used to find the association between clinical parameters of cases and control group. The participants were divided into two groups, mild PE and severe PE (SBP ≥160 mmHg or DBP ≥110 mmHg) groups based on blood pressure as per the National High Blood Pressure Education Programme (NHBPEP) guidelines [18]. Analysis of variance (ANOVA) test was used to compare the BP and biochemical parameters between severe and mild PE with controls, p<0.05 was considered to be statistically significant. Pearson’s correlation coefficient was applied to analyse the correlation between study variables. Receiver Operating Characteristic (ROC) curve was used to analyse the diagnostic efficacy of cystatin C and creatinine in PE.
Results
The demographic characteristics and clinical variables of study groups are presented in [Table/Fig-1]. Age and gestational age were similar in both the study groups. The mean systolic BP (150.32±13.90 mmHg) and mean diastolic BP (100.56±9.24 mmHg) were significantly higher in cases as compared to controls (p<0.001). The mean arterial pressure in cases (117.15±10.03 mmHg) was also significantly high in pre-eclamptic when compared to controls (89.17±5.20 mmHg) (p<0.001). All the subjects under study had normal glucose levels. The mean serum levels of creatinine were 0.77±0.19 mg/dL in cases and 0.71±0.16 mg/dL in controls. The values were within the normal range, but no significant difference was observed among groups (p=0.126). Serum cystatin C level significantly increased (p<0.001) in pre-eclampsia cases (1.20±0.23 mg/L) as compared to controls (0.65±0.17 mg/L).
Demographic and clinical variables of pre-eclampsia cases and controls.
| Variables | Cases (n=50) | Controls (n=50) | 95% CI | p-value |
|---|
| Age (years) | 23.50±3.96 | 24.66±2.99 | − | 0.102 |
| POG* (weeks) | 32.96±3.23 | 32.18±3.60 | 32-33.8 | 0.257 |
| SBP† (mmHg) | 150.32±13.9 | 116.04±6.79 | 146.3-154.2 | <0.001* |
| DBP‡ (mmHg) | 100.56±9.24 | 75.80±5.51 | 97.3-103.1 | <0.001* |
| MAP§ (mmHg) | 117.15±10.03 | 89.17±5.2 | 114.3-120 | <0.001* |
| FBG|| (mg/dL) | 82.72±8.51 | 83.20±8.13 | 80.3-85.1 | 0.774 |
| Cystatin C (mg/L) | 1.20±0.23 | 0.65±0.17 | 1.13-1.26 | <0.001* |
| Creatinine (mg/dL) | 0.77±0.19 | 0.71±0.16 | 0.71-0.82 | 0.126 |
*POG: Period of Gestation, †SBP: Systolic BP, ‡DBP: Diastolic BP, §MAP: Mean arterial pressure, ||FBG: Fasting blood glucose Unpaired Students T Test: p-value <0.05 Statistically significant; p-value <0.001 Statistically highly significant
The participants were divided into mild (n=35) and severe (n=15) case groups on the basis of their BP. Statistically significant differences were observed in SBP and DBP levels between mild PE, severe PE and control groups (p<0.001). Significant difference was found in cystatin C levels between severe, mild PE and controls (p<0.001). Post-Hoc analysis also revealed statistically significant difference between severe and control, and mild and control group (p<0.001). However, no significant difference was observed between mild and severe PE (p=0.09). The mean creatinine levels of 0.83, 0.74 and 0.7 mg/dL between severe, mild PE and controls respectively. ANOVA showed an insignificant difference (p=0.06) in creatinine levels between the groups. Post-Hoc analysis revealed no significant statistical difference in creatinine levels among groups [Table/Fig-2].
Clinical variables of severe, mild pre-eclampsia cases and controls.
| Severe PE* (n=15) | Mild PE (n=35) | Control (n=50) | p-value |
|---|
| SBP† (mmHg) | 165.3±16.4 | 143.8±5.03 | 116.04±6.79 | <0.001* |
| DBP‡ (mmHg) | 110±10.69 | 96.5±4.45 | 75.8±5.51 | <0.001* |
| Cystatin C (mg/L) | 1.33±0.22 | 1.14±0.22 | 0.65±0.16 | <0.001* |
| Creatinine (mg/dL) | 0.83±0.24 | 0.74±0.15 | 0.7±0.15 | 0.06 |
*PE: Pre-eclampsia, †SBP: Systolic BP, ‡DBP: Diastolic BP. ANOVA and Post-Hoc Analysis: p-value <0.05 statistically significant; p -<0.001 statistically highly significant
A significant positive correlation was observed between SBP and DBP with cystatin C, r-value 0.47 (p<0.001) and r-value 0.42 (p<0.01) respectively. In contrast, creatinine showed a weak positive correlation with SBP and DBP, r-value 0.17 (p=0.23) and r-value 0.10 (p=0.48) respectively [Table/Fig-3].
Correlation between study variable.
| | Age | Gestational age | Systolic blood pressure | Diastolic blood pressure | Serum creatinine | Serum cystatin C |
|---|
| Age | r-value | - | -0.14 | 0.05 | 0.14 | 0.14 | 0.09 |
| p-value | 0.33 | 0.73 | 0.33 | 0.33 | 0.53 |
| Gestational age | r-value | | - | 0.12 | 0.23 | 0.00 | 0.03 |
| p-value | | 0.4 | 0.1 | 1 | 0.83 |
| Systolic blood pressure | r-value | | | - | 0.72 | 0.17 | 0.47 |
| p-value | | | <0.001* | 0.23 | <0.001* |
| Diastolic blood pressure | r-value | | | | - | 0.10 | 0.42 |
| p-value | | | | 0.48 | <0.01* |
| Serum creatinine | r-value | | | | | - | 0.02 |
| p-value | | | | | | 0.89 |
| Serum cystatin C | r-value | | | | | | - |
| p-value |
Pearson’s correlation coefficient: p-value <0.05 statistically significant; p-value <0.001 statistically highly significant
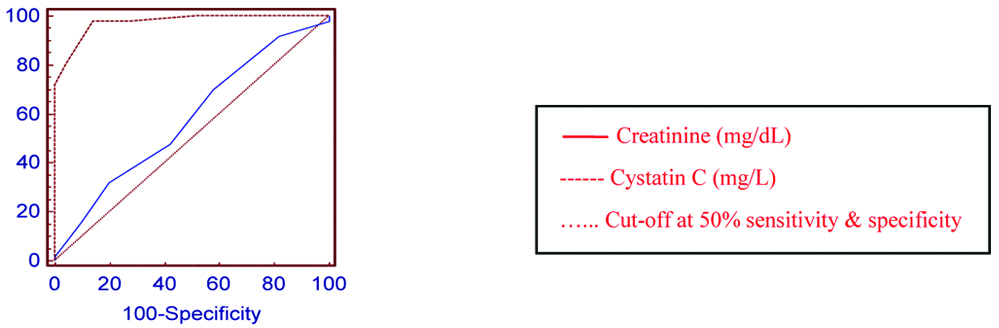
ROC curve was used to determine the diagnostic efficacy of cystatin C and creatinine in PE. At a given cut-off point, creatinine showed an AUC of 0.581 and cystatin C showed 0.974. Cystatin C with a sensitivity of 98% and specificity of 86% showed better diagnostic accuracy when compared to creatinine [Table/Fig-4].
ROC curve analysis for cystatin C and creatinne in the study group.
| Study variables | Cut-off | Sensitivity (%) | Specificity (%) | AUC | p-value |
|---|
| Cystatin C (mg/L) | >0.8 | 98.0 | 86.0 | 0.974 | <0.001 |
| Creatinine (mg/dL) | >0.8 | 32.0 | 80.0 | 0.581 | 0.157 |
 |
Discussion
Pre-eclampsia was earlier considered as a disease that resolved quickly in postpartum period, but studies suggest that the maternal vascular dysfunction persists for many years [19]. Diagnosis of PE is based on hypertension and proteinuria, both of which influence renal functioning. Hence, it becomes essential to monitor the renal system. Over the years, serum creatinine was preferred as a renal marker since it is inexpensive and readily available [20]. However, the limitations of creatinine measurement have shifted the focus to alternative markers of kidney function, in particular, cystatin-C. Serum cystatin-C level is directly eliminated from circulation by kidneys and is independent of age, gender or muscle mass and therefore can be considered as a prompt marker of renal health [12].
The present study showed that serum cystatin C is significantly high in PE compared to controls, whereas creatinine did not show statistically significant difference between cases and controls. The present results are in accordance with Sharma S et al., and Sumitra K et al., studies that reported that serum cystatin-C is a superior marker as compared to creatinine for assessment of altered renal function in PE [21,22]. A study conducted by Farag MK et al., on women in second trimester of pregnancy before 20th week, showed that serum cystatin C levels were significantly higher in subjects who later developed PE [23]. Similar findings were reported by Saleh S et al., where women in their 2nd trimester with increased levels of cystatin C subsequently developed PE; while the creatinine levels remained unchanged [24]. Since cystatin C levels increase even before clinical symptoms of PE appears, it could be used as an early predictor of PE as compared to the creatinine levels that do not reflect the early or minimal changes occurring in the kidneys. Therefore, it can be stated that creatinine have a poor predictive role as a screening parameter in PE. As opposed to the present study, Jumaah I AM, reported an increased mean value of serum creatinine in PE which was associated with a reduction in plasma renin activity in pre-eclamptic state [25].
Unlike the published studies, in the present study authors evaluated the parameter based on severity of the PE state. The participants were classified into mild and severe PE groups, and significant correlation between mild PE, severe PE and controls were observed whereas no such correlation was observed for creatinine values. On ROC curve, cystatin C showed a better diagnostic accuracy with a sensitivity of 98% and specificity of 86% compared to creatinine, which had sensitivity of 32% and specificity of 80%. These findings were in accordance with Kristensen K et al., and Niraula A et al., results which showed that cystatin-C had better diagnostic value than creatinine on ROC curve [13,26]. Based on these outcomes, cystatin C was documented to be a good marker of the condition.
In the present study, authors found a significant positive correlation between SBP and DBP with cystatin C, while creatinine showed a weak positive correlation with SBP and DBP. The correlation of DBP with maternal age and gestation age, though weak showed a positive correlation suggesting that increasing maternal age and gestation age could be a risk factor for elevated BP. An increasing trend of cystatin C with the increasing severity of condition was also observed. In contrast to the present findings, Akbari A et al., reported that the use of cystatin-C as a marker of GFR in pregnancy is not completely reliable, and cystatin-C over-estimates the decrease in GFR in late pregnancy since there is increased in serum cystatin C during late pregnancy even in normal pregnancy [27].
In most cases of PE, Renal Plasma Flow (RPF) and GFR are decreased due to increased afferent arteriolar resistance and the alteration/loss of glomerular barrier size and charge selectivity of the glomerular filter, further alters the renal selectivity of ultrafiltration [28]. It is more likely that the increase in cystatin-C levels in pregnancy is due to an altered filtration process as opposed to increased production rate [26]. Any changes in the filtration barrier in glomerular endotheliosis of PE decreases glomerular filtration of substances like cystatin-C, due to reduction in the anionic sites in the glomerular barrier, that ultimately hampers the filtration of strongly positively charged or larger molecules. Cystatin C, being strongly positive with large size escapes the filtration. In addition, change in the number/size of glomerular pores also contributes to elevated cystatin-C levels in PE [6]. In the present study, though the difference in the levels of serum cystatin C was statistically significant, their values were within the reference range, due to early (2nd trimester) detection and intervention of the cases. This stems from the fact that all the present cases were in the third trimester and majorly mild pre-eclamptics which could have influenced the levels of cystatin-C.
Limitation
The present study had small study population of both treated and untreated PE patients; treatment may have modified the disease process and follow-up study was not conducted to monitor the kidney function in the post-partum stage. Hence further studies in a larger population are needed to support the present findings.
Conclusion
From the present study, it can be concluded that serum cystatin C can be utilised to assess the renal function in pregnancy complications like pre-eclampsia. Early diagnoses of kidney damage helps in determining the pregnant women at risk of developing pre-eclampsia, and timely management and prevention of associated future complications.
*POG: Period of Gestation, †SBP: Systolic BP, ‡DBP: Diastolic BP, §MAP: Mean arterial pressure, ||FBG: Fasting blood glucose Unpaired Students T Test: p-value <0.05 Statistically significant; p-value <0.001 Statistically highly significant
*PE: Pre-eclampsia, †SBP: Systolic BP, ‡DBP: Diastolic BP. ANOVA and Post-Hoc Analysis: p-value <0.05 statistically significant; p -<0.001 statistically highly significant
Pearson’s correlation coefficient: p-value <0.05 statistically significant; p-value <0.001 statistically highly significant