Forces from musculature interplay an important role in guiding the tooth eruption and their positioning, along with maintenance of dental arch form and stability as per equilibrium theory in clinical orthodontics [1]. Craniofacial balance is maintained by more than 20 muscles encapsulating the human face all around; particularly in labial and buccal region where multiple muscles intermingle with each other, enveloping the growing dentition as perioral musculature. However, teeth are in equilibrium position because of the influence of forces are equal on them from all directions, regardless of strength of muscle that is applying the force [2,3]. Some previous studies have also given emphasis to the role of the surrounding musculature in determination of dental arch morphology whereas Brash JC et al., cited cases of muscular dystrophy and facial paralysis with accompanying asymmetries of dental arches [4-8].
Along with morphogenetic pattern, the habits also play a significant role which needs to be emphasised. As with the finger-sucking habit or the retained visceral swallowing pattern; there is an establishment of a favourable environment for abnormal muscle activity. Aberrant perioral muscle activity can thus create a dental Class II division 1 malocclusion, even with harmonious anteroposterior jaw relations. While in skeletal Class II division 1 malocclusions; the discordant skeletal morphological relation between the upper and lower jaws upsurge the aberrant muscular environment further worsening the established condition [9].
A dissimilarity in the strength and tonicity of the muscles is assumed, when at rest and at function. The forces that act on the dentition during function are of short duration in comparison to the forces at rest, which is believed to be capable of producing movements in the craniofacial region, as they are constantly acting upon the growing dentition [10]. For this reason, it would be of great value for an orthodontist to know the extent of these influencing forces from the aberrant oro-facial musculature, but the doubt remains how the pressure of the perioral musculature can be quantified.
Since long time, in numerous attempts have been made in instruments to record forces generated from enclosing muscles and quantify the values generated in order to establish correlation between the aberrant forces and growing malocclusions [11]. One such effort was made by Posen AL, who had described a device for measuring the strength of the lips called the Perioral Muscle Meter (POMMETER) [12]. However, it had its limitations which gave way for developing better aids and tools. Thereafter, in 1996, a Pressure Distribution Sensor (PDS) was developed for the assessment of pressure distribution patterns of long face subjects with extremely large interlabial gap [13].
Therefore, the present study aimed to evaluate the lip and cheek pressure in various malocclusion, using the latest available force sensing resistor (Datalog, Flexiforce low type, Biometrics Ltd., Gwent, United Kingdom) and their association with incisor inclination and arch width. The null hypothesis of the study was that there exists no difference in musculature pressure when compared across various malocclusion groups.
Materials and Methods
This descriptive cross-sectional study was conducted in Department of Orthodontics, Faculty of Dental Sciences, SGT University, Budhera, Haryana with the aim of establishing a correlation between developing malocclusion and encompassing musculature which consisted of evaluation of lip and cheek pressure in different malocclusions for six months duration from April 2016 to September 2016.
The Study Group
A fixed duration of three months were chosen for fixed orthodontic consultation. A total of 86 subjects reported for routine check up in department’s OPD. Out of 86 subjects, 50 subjects were advised for orthodontic treatment and were selected for the study. Sample size was determined using method given by Pourhoseingholi MA et al., for prevalence studies [14].
The inclusion criteria were; no permanent tooth loss, no history of orthognathic surgery and absence of asymmetric skeletal pattern. Subjects having congenital craniofacial anomaly, taking drugs influencing the tone of the muscles and with previous orthodontic treatment were excluded from the study.
Before starting orthodontic treatment, subjects were divided into three groups based on their occlusal pattern; Group I (20 subjects) had Angle’s Class I relationship with straight profile and, Group II (20 subjects) had Angle’s Class II division 1 (Class II/1) malocclusion with convex profile and Group III (10 subjects) had Angle’s Class II division 2 (Class II/2) malocclusion with straight or mildly convex profile. Age group of subjects ranged from 12-20 years; (32 females with mean age of 17 years 7 months and 18 males with mean age of 16 years 5 months). An ethical clearance was received from Institution Committee to conduct the study and informed consent was obtained from all patients/their parents who participated in the study.
Collection of Records
On the day of orthodontic documentations which included extraoral and intraoral photos, dental casts and lateral cephalograms; the upper lip pressure, lower lip pressure and buccal pressure were measured in all the subjects. Along with occlusal pattern; other variables such as gender was correlated with muscular pressure. Dental casts were used to obtain intermolar width, interpremolar width at first and second premolar level using digital vernier calliper (Libral Traders Pvt., Ltd., India) with standard error of 1/20 mm=0.05 mm.
A 2.3 Recording of Lip and Cheek Pressure
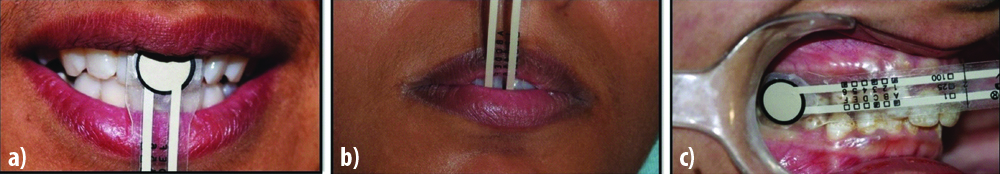
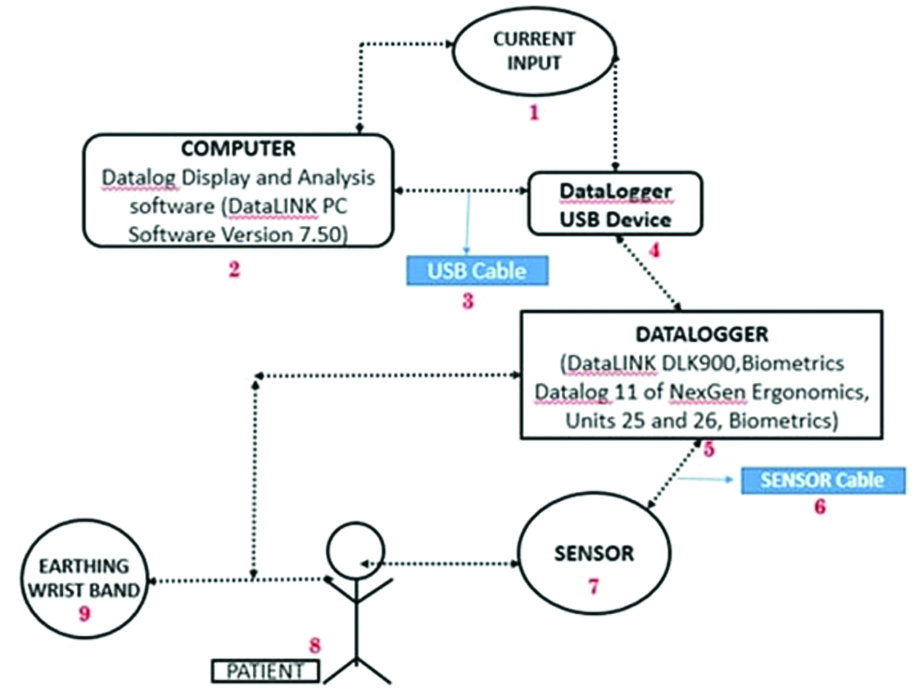
A force sensing resistor device (Flexiforce low type) with a sensor cable of 20 cm long, 0.46 cm radius, with transducer thickness 1 mm; which was ultra flexible so that it was comfortable in the mouth and reliable for a wide range of temperatures: -28°C to 216°C that allowed minimised temperature induced errors were taken. The sensor was positioned in midline between maxillary incisors for upper labial pressure with thin layer of wax; and mandibular incisors for lower labial pressure; and at mesiobuccal cusp of maxillary right permanent molar for buccal musculature pressure [Table/Fig-1]. The force sensing resistor was attached to the Datalogger (DataLINK DLK900, Biometrics Datalog 11 of M/s Biometrics Ltd., Units 25 and 26, Biometrics) which was further connected to the Datalog Display and Analysis software (DataLINK PC Software Version 7.50) for recording the pressure from the subjects.
Orthodontic relief wax and microporetape were required for the stabilisation of the sensor. The whole set up was assembled, consisting of a multi-channel Datalogger (Data LINK DLK900, Biometrics Datalog 11 of M/s Biometrics Ltd., Units 25 and 26, Biometrics) to which the Flexiforce (low type) sensor with 3-male pin square was connected in Port 1 with the help of a interlink cable. An earthing wrist band was connected to the ground port of the Data logger at its prong end. Extension cord was connected to main current line and all the other gadgets were attached on to the same extension board [Table/Fig-2].
a) Sensor placed between upper incisors at midline for recording upper lip pressure; b) Sensor placed between lower incisors at midline for recording lower lip pressure; c) Correct position of the sensor at mesiobuccal cusp of right maxillary molar for recording buccal pressure.
Flow chart representing the methodology of the procedure.
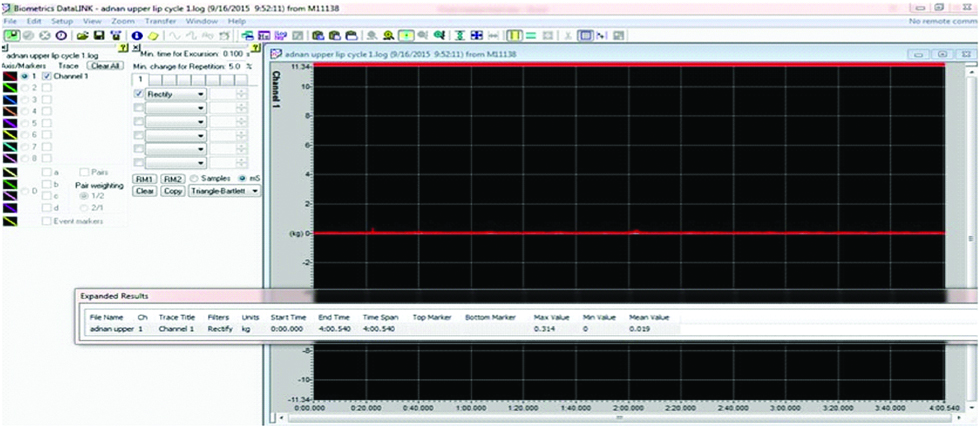
Subjects were instructed to look straight ahead, relax, not to speak or tense the muscle and this was confirmed by drop and raise in values (waveform) recorded on Datalogger until a stable waveform was recorded [Table/Fig-3]. All the readings were recorded with muscles at rest, for three cycles with duration of four minutes each. Five minutes gap interval was given between each cycle.
Recorded value from one of the subjects illustrating the force in numeric value.
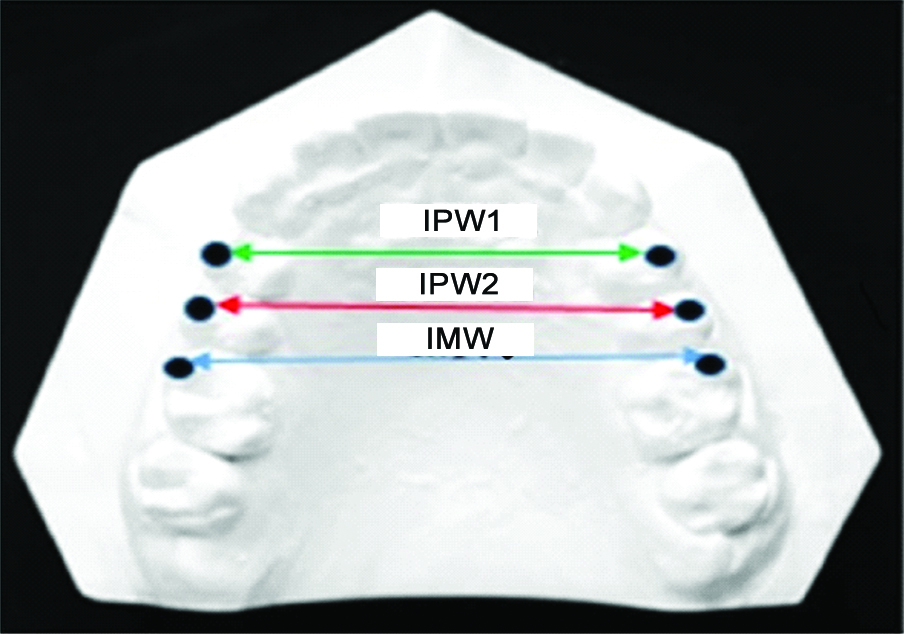
All cephalograms were traced manually by single operator; and U1-SN and lower incisor mandibular plane angle were measured in all subjects. Dental casts were used to obtain Intermolar Width (IMW) and Interpremolar Width at Maxillary Permanent First Premolar (IPW1) and at Second Premolar (IPW2) level using digital vernier calliper (Libral Traders Pvt., Ltd., India) with standard error of 1/20 mm=0.05 mm [Table/Fig-4].
Calculation of Intermolar Width (IMW) and interpremolar width at maxillary permanent first premolar (IPW1) and at second premolar (IPW2).
Statistical Analysis
All the parameters of three groups were listed in a tabular manner in MS Excel Spreadsheet (Version 2013) with their mean value and standard deviation analysed statistically using software SPSS (statistical package for social sciences) version 20.0. Intergroup comparison of pressure values was done using independent t-tests and p-value <0.05 was considered as statistically significant. Correlations between upper and lower lip pressure, buccal pressure, arch width, upper and lower incisor angulation were carried out using Pearson’s correlation test.
Results
In all the subjects, pressure values were correlated with Angle’s Class I, Class II/1 and Class II/2 malocclusion. Mean upper lip, lower lip and buccal pressure in Group I, Group II and Group III are shown in [Table/Fig-5]. There was negligible correlation of mean lower lip pressure with buccal pressure in Class I subjects. This indicates that lower lip and buccal pressure act on dentition in their distinct perspective in Class I subjects. In Group II subjects; there was low positive correlation of mean upper lip with lower lip pressure, as well as moderate positive correlation between mean lower lip and buccal pressure. Intragroup correlation in Group III showed no significant correlation in Class II/2 malocclusions [Table/Fig-6].
Mean upper lip pressure, lower lip pressure and buccal pressure in Group I, Group II and Group III. Values are expressed as mean and SD.
| Upper lip pressure (gm/cm2) | Lower lip pressure (gm/cm2) | Buccal pressure (gm/cm2) |
|---|
| Group I | | | |
| Mean | 31.60 | 32.11 | 33.56 |
| SD | 4.34 | 4.14 | 6.39 |
| Group II | | | |
| Mean | 31.00 | 34.83 | 38.71 |
| SD | 5.91 | 8.44 | 6.44 |
| Group III | | | |
| Mean | 35.42 | 42.59 | 27.06 |
| SD | 5.55 | 7.18 | 3.63 |
Intra group correlation between upper lip pressure, lower lip pressure and buccal pressure in Group I, Group II and Group III. *correlation is significant at the 0.05 level (2-tailed), Pearson’s co-relation coefficient applied.
| Correlations Group I |
|---|
| Pearson’s correlation (r value) | Mean upper lip pressure | Mean lower lip pressure | Mean buccal pressure |
|---|
| Mean upper lip pressure | 1 | -0.191 | -0.084 |
| Mean lower lip pressure | -0.191 | 1 | 0.062* |
| Mean buccal pressure | -0.084 | 0.062* | 1 |
| Correlations Group II |
| Mean upper lip pressure | 1 | 0.470* | 0.125 |
| Mean lower lip pressure | 0.470 | 1 | 0.557*0 |
| Mean buccal pressure | 0.125 | 0.557* | 1 |
| Correlations Group III |
| Mean upper lip pressure | 1 | -0.058 | -0.119 |
| Mean lower lip pressure | -0.058 | 1 | 0.233 |
| Mean buccal pressure | -0.119 | 0.233 | 1 |
Intergroup comparison of mean upper lip, lower lip and buccal pressure between Group I and Group II using independent t test showed statistically significant (p≤0.01) difference in mean buccal pressure on comparison [Table/Fig-7]. Intergroup comparison of Group II and III showed insignificant differences in mean upper lip pressure, however statistically significant difference were observed in mean buccal and lower lip pressure between the Class II/1 and Class II/2 subjects. It demonstrates that both the pressure from lower lip and cheeks are convoluted to each other for developing of these two malocclusions, as with high buccal pressures narrow maxillary arches were also observed in Class II/1 subjects [Table/Fig-8].
Inter Group comparison between Group I and Group II for Upper Lip Pressure, Lower Lip Pressure and Buccal Pressure. p-value is significant at p≤0.01**highly significant value, Independent t test and p- value (level of significance).
| Group I and Group II |
|---|
| Name of group | N | Mean | Std. Deviation | Std. Error Mean | T test | Sig |
|---|
| Mean upper lip pressure | Group I | 20 | 31.603 | 4.340 | 0.970 | 0.371 | 0.713 |
| Group II | 20 | 31.000 | 5.913 | 1.322 |
| Mean lower lip pressure | Group I | 20 | 32.114 | 4.135 | 0.924 | 1.290 | 0.205 |
| Group II | 20 | 34.827 | 8.443 | 1.888 |
| Mean buccal pressure | Group I | 20 | 33.558 | 6.386 | 1.427 | 2.539 | 0.015** |
| Group II | 20 | 38.707 | 6.440 | 1.440 |
Inter Group comparison between Group II and Group III for Upper Lip Pressure, Lower Lip Pressure and Buccal Pressure. p-value is significant at p≤0.01 ** highly significant value, P≤0.001*** very highly significant, Independent t test and p-value (level of significance).
| Group II and Group III |
|---|
| Name of group | N | Mean | Std. Deviation | Std. Error Mean | t-test | Sig |
|---|
| Mean upper lip pressure | Group II | 20 | 31.000 | 5.913 | 1.322 | 2.015 | 0.58 |
| Group III | 10 | 35.423 | 5.552 | 1.755 |
| Mean lower lip pressure | Group II | 20 | 34.827 | 8.443 | 1.888 | 2.627 | 0.016** |
| Group III | 10 | 42.588 | 7.183 | 2.271 |
| Mean buccal pressure | Group II | 20 | 38.707 | 6.440 | 1.440 | 6.319 | <0.001*** |
| Group III | 10 | 27.065 | 3.634 | 1.149 |
Intergroup comparison of Group I and Group III exemplified statistically significant (p≤0.001) difference in mean buccal and ower lip pressure between Class I and Class II/2 subjects. This intergroup comparison also signifies the differences in buccal pressure and its cause-effect amongst dissimilar malocclusions [Table/Fig-9]. Upper lip and lower lip pressure values were found to be increased in Class II/2 subjects resulting in retroclined upper incisors (U1-SN) as well as decreased lower incisor angulation (IMPA) [Table/Fig-10].
Inter Group comparison between Group I and Group III for Upper Lip Pressure, Lower Lip Pressure and Buccal Pressure. p-value is significant at p≤0.001*** very highly significant value, Independent t-test and p-value (level of significance).
| Group I and Group III |
|---|
| Name of group | N | Mean | Std. deviation | Std. error mean | T test | Sig |
|---|
| Mean upper lip pressure | Group I | 20 | 31.603 | 4.340 | 0.970 | 1.904 | 0.077 |
| Group III | 10 | 35.423 | 5.552 | 1.755 |
| Mean lower lip pressure | Group I | 20 | 32.114 | 4.135 | 0.924 | 4.270 | 0.001*** |
| Group III | 10 | 42.588 | 7.183 | 2.271 |
| Mean buccal pressure | Group I | 20 | 33.558 | 6.386 | 1.427 | 3.542 | 0.001*** |
| Group III | 10 | 27.065 | 3.634 | 1.149 |
Mean upper lip pressure, lower lip pressure, upper incisor angulation (U1- SN) and lower incisor angulation (IMPA) in Group I, II, and Group III. Values are expressed as mean and SD.
| Upper lip pressure (gm/cm2) | Lower lip pressure (gm/cm2) | Upper incisor angulation (degrees) | Lower incisor angulation (degrees) |
|---|
| Mean | SD | Mean | SD | Mean | SD | Mean | SD |
|---|
| Group I | 31.60 | 4.34 | 32.11 | 4.14 | 110.45 | 9.19 | 98.15 | 8.76 |
| Group II | 31.00 | 5.91 | 34.83 | 8.44 | 113.7 | 10.70 | 99.25 | 5.71 |
| Group III | 35.42 | 5.55 | 42.59 | 7.18 | 93.3 | 13.80 | 92.7 | 5.98 |
Correlation between mean upper lip pressure and upper incisor inclination (U1-SN) and lower incisor angulation (IMPA) in Group I, Group II and Group III showed similar mean upper lip pressure in Group I and Group II but increased mean upper lip pressure in Group III. Statistically, there was no significant correlation between the upper lip pressure and U1-SN and IMPA in Group I and II; whereas a moderate positive correlation between mean upper lip pressure and lower incisor angulation was observed in Group III [Table/Fig-11].
Correlation of Upper Lip Pressure with Upper incisor angulation (U1-SN) and Lower incisor angulation (IMPA) in Group I, Group II and Group III.
| Name of group | Mean upper lip pressure (gm/cm2) | U1-SN | IMPA |
|---|
| Pearson’s correlation (r value) |
|---|
| Group I | 31.60 | -0.131 | -0.363 |
| Group II | 31.00 | 0.108 | -0.242 |
| Group III | 35.42 | 0.031 | 0.520* |
*Correlation is significant at the 0.05 level (2-tailed), Pearson’s co-relation coefficient applied.
Using Pearson’s correlation coefficient; mean lower lip pressure showed negative or no correlation with U1-SN and weak correlation with IMPA in Class I subjects; while lower lip pressure showed weak correlation with U1-SN and no correlation with IMPA in Class II division 1 subjects; whereas low correlation between mean lower lip pressure and -SN and IMPA was found in Class II/2 subjects [Table/Fig-12]. However, in all the groups; the mean lower lip pressure and upper and lower incisor angulation was found non-significant.
Correlation of Lower Lip Pressure with Upper incisor angulation (U1-SN) and Lower incisor angulation (IMPA) in Group I, Group II and Group III. *correlation is significant at the 0.05 level (2-tailed), Pearson’s co-relation coefficient applied.
| Name of group | Mean lower lip pressure (gm/cm2) | U1-SN | IMPA |
|---|
| Pearson’s correlation (r-value) |
|---|
| Group I | 32.11 | -0.082 | 0.015 |
| Group II | 34.83 | 0.266 | -0.094 |
| Group III | 42.59 | 0.347 | 0.393 |
When mean buccal pressure was correlated with IMW, IPW1 and IPW2 statistically, Group I and II and III showed no significant correlation of mean buccal pressure with IMW, IPW1, and IPW2 [Table/Fig-13]. Mean upper lip pressure showed significant differences between male and female whereas, insignificant differences were found in mean lower lip and buccal pressure between the genders. Therefore, difference in upper lip pressure can be a confounding factor in various malocclusions, hence separate standards should be considered for males and females [Table/Fig-14].
Correlation of Buccal Pressure with the Intermolar Width (IMW), Interpremolar Width 1 (IPW1) and Interpremolar Width 2 (IPW2) in Group I, Group II and Group III. *correlation is significant at the 0.05 level (2-tailed), Pearson’s co-relation coefficient applied.
| Name of group | Mean buccal pressure (gm/cm2) | Mean IMW (mm) | Mean IPW2 (mm) | Mean IPW1 (mm) | IMW | IPW2 | IPW1 |
|---|
| Pearson’s correlation (r value) |
|---|
| Group I | 33.56 | 50.17 | 45.76 | 41.17 | -0.404 | -0.132 | -0.067 |
| Group II | 38.71 | 49.84 | 44.32 | 39.07 | -0.055 | -0.126 | -0.018 |
| Group III | 27.06 | 49.47 | 43.32 | 39.85 | -0.022 | 0.205 | -0.002 |
Comparison of upper lip pressure, lower lip pressure and buccal pressure in both the genders (males and females). p-value is significant at p≤0.05 *significant value, Independent t-test and p-value (level of significance).
| Group statistics |
|---|
| Sex of subject | N | Mean (gm/cm2) | Std. Deviation | Std. error mean | t-test | Sig |
|---|
| Mean upper lip pressure | Male | 18 | 29.602 | 5.331 | 1.256 | 2.562 | 0.015* |
| Female | 32 | 33.541 | 5.008 | .885 |
| Mean lower lip pressure | Male | 18 | 35.712 | 8.844 | 2.084 | 0.269 | 0.790 |
| Female | 32 | 35.059 | 7.066 | 1.249 |
| Mean buccal pressure | Male | 18 | 34.798 | 8.266 | 1.948 | 0.327 | 0.746 |
| Female | 32 | 34.049 | 6.807 | 1.203 |
Discussion
The present study aimed to establish the association amongst different malocclusion and encompassing musculature. In all subjects; lower lip pressure values recorded were highest in subjects with Class II/2 malocclusion mostly due to hyper functional lower lip. This reasoning can also be justified by the findings of Subtelny DJ and Sakuda M, who also observed a strong and high muscular attachment for mentalis muscle in these groups of subjects with an extensive horizontal crease as evidenced by blanching of tissue along the line of crease [15]. When mean lower lip pressure was compared between Class II/1 malocclusion and Class I subjects, lower lip pressure was greater in Class II pattern. This can be explained by pair of mentalis muscles which are often observed to be overactive during lip closing in subjects with lip incompetence, who voluntarily close their lips during use of these muscles [2]. The lip itself may become hypertrophic as a result and the lower incisors buckle as the mandibular segment is flattened by continuously abnormal mentalis muscle activity, increasing the curve of Spee [16].
When subjects with protrusive profile were compared with upper and lower lip musculature pressure, results showed statistically insignificant differences in upper lip pressure with the degree of protrusion which was in contrast with the findings of Jung MH et al., who found a strong relation of upper incisor proclination to perioral muscle pressure [17]. Irmak P and Aksu M, evaluated relation between perioral pressures and the upper incisor inclination with a utility archin CII/2 malocclusion and reported that significant change occurred in upper lip and lower lip pressure with upper incisor proclaination [18].
Mean upper labial pressure in Class II/1 malocclusion showed lesser pressure values when compared with the subjects with Class II/2 malocclusion. Hence, it can be assumed that upper lip was hypotonic in subjects with Class II division 1 cases in the present study, which is strongly in agreement with the findings of Posen AL who had also grouped those musculature as hypotonic which generated forces between the range of 180-195 grams; but differ from those by Thüer U and Jung MH et al., [12,19,20]. These findings of the present study can also be exemplified by the electromyographic research by Grossman JW et al., who demonstrated that there is a compensatory muscle activity in Class II malocclusions [21]. Also, the present study findings correlate with statement of Scott J, “From an early stage of development, the lower lip is much more mobile and versatile than the upper lip” [22].
In subjects with Class II/1 malocclusion; maximum buccal pressure was recorded whereas Class II/2 subjects showed minimum mean buccal pressure values. When maxillary casts were evaluated for intermolar width, interpremolar width in these subjects; there was decreased intermolar and interpremolar width at first and second premolar showing an inverse correlation between buccal pressure and interpremolar width, though not significant. These results pointed that with increasing buccal pressure; there is narrowing of arch width at the site of first premolar although no significant correlation was found among buccal pressure and intermolar and interpremolar width. Abrams I, found out that buccinators showed increasing pressure trends from anteriorly to posteriorly [23]. Graber TM, had also observed in his study that with increased buccinator muscle activity, the maxillary arch narrows and assumes the V shape so often associated with Class II, division 1 problems [9]. To the above finding of buccinator mechanism and arch width, it would be apt to mention the equilibrium theory which was also emphasised by Brodie AG, and Graber TM, who stated that, “muscle drapery” or “buccinator mechanism,” comprises a continuum of muscle surrounding the dental arches, and the muscular tongue mass inside the dentition, in which dentition is trapped within a muscle system and influences the growing dentition [2,9,24].
Mean upper lip pressure showed significant differences between male and female whereas insignificant differences were found in mean lower lip and buccal pressure between genders. However, on a conflicting note: Ingervall B and Janson T, measured the strength of lips with dynamometer and observed that perioral muscle forces values were not significantly correlated with sex [25]. These findings demonstrate similar results with the study of Mitchell JI and Williamson EH, who suggested separate standards should be considered for males and females and for different age groups [26]. Posen AL, also found no sexual dimorphism in lip strength [12].
The present study concludes that in spite of interaction of multiple factors there is a relationship of orofacial musculature and different malocclusions, mainly because of lower lip and buccal forces.
Limitation
The present study did not measure tongue pressure which could be a potent factor in deciding and governing the malocclusion. Also, the sample size was not same in all the three groups; and further studies with a larger sample size and same number of subjects in all the groups can be carried out. Furthermore; studies correlating lip, cheek and tongue pressure should be encouraged for future perspectives.
Conclusion
Lower lip pressure was greater than upper lip pressure in all subjects. Upper lip pressure remained similar in different groups; therefore its role amongst different malocclusion is minimal. Significant differences were observed in lower lip pressure and buccal pressure; hence lower lip and buccal musculature are two chief causative factors associated with different malocclusions.
Maximum upper and lower lip pressure was observed in subjects with Angle’s Class II/2 malocclusion with retroclined upper and lower incisors. Also, the mean upper lip pressure showed moderate positive correlation lower incisor angulation (IMPA) in Group III.
Buccal pressure showed an inverse relationship with maxillary arch width; however, the correlation was not significant. Females showed significantly higher values of upper lip pressure as compared to males suggest that separate standards should be considered for males and females.
*Correlation is significant at the 0.05 level (2-tailed), Pearson’s co-relation coefficient applied.