Birth order or sibling rank refers to the order a child is born in the family. It has been suggested that birth order plays an important role in defining a child’s characteristics, personality type and educational achievement [1-3]. GPA is one of the grading processes used to measure the educational achievement of students [4]. The mean Saudi family size was 6.4 according to the Population and Household Census 2010 [5]. The average American family size was 3.14 according to the United States Bureau of the Census in 2016, which is half that of the Saudi family size [6].
It is seen that children in the same family are different from each other in academic achievement and the effect of birth order on a child’s educational achievement has been studied in the field of sociology, psychology and economics [7,8]. The existing literature shows controversial views, in which the majorities support a negative association between siblings’ rank (birth order) and children’s educational performance [9,10]. One of the most famous and comprehensive analytical studies among whites in the United States of America detected a negative outcome in education upon increasing the family size [9]. Some studies also support a negative effect of the number of children and educational achievement [2,10]. Another study carried out in Turkey showed that middle born children perform less in schooling compared to the other children [11].
A similar study carried out in Jordan showed that the first child or the only child usually performs well in education especially if the first child is a boy [8]. On the other hand, another Ecuadorian study revealed that later born children attain higher education level [12]. In addition to that, other studies suggest that birth order has little effect on personality and intelligence [7,13]. A recent study carried in Saudi Arabia investigated the link between intelligence and family size, siblings rank, and income of the family among young girls. The results showed an inverse relationship between the intelligence of the girls and the size of the family, birth order and whether parents are deceased or alive [14]. Moreover, other confounders such as family size, family income, birth spacing, sex composition, mother’s age, parental education, shared environment and hereditary factors play an important key role in forming a person’s personality and intelligence [9,15]. The available evidence is not convincing and the birth-order effect on educational achievement has not yet resulted in conclusive findings. Besides that, there is limited literature available studying the association between birth order and academic performance [1-3]. Hence, the present study was conducted with the aim to investigate the association between birth order (sibling rank) and academic performance in connection with other variables such as sibling size, gender, age, parent’s education, parent’s job and family monthly income.
Materials and Methods
This cross-sectional survey was done on all undergraduate students, both male and female, attending the College of Dentistry at King Saud bin Abdulaziz University for Health Sciences (KSAU-HS), Riyadh, Saudi Arabia in 2016 over the span of three months. Data were collected by easy to read, self-administered questionnaire which contained information about students’ Cumulative Grade Point Average CGPA, birth order, age, socioeconomic status of the parents, family size and gender. The questionnaire was developed by the authors after reviewing previous articles [1-3] and was authenticated by the research unit at King Saud bin Abdulaziz University for Health Sciences. Content validity was assessed by a two-expert-panel and it was amended accordingly. Then, the questionnaire was piloted and reliability analysis was conducted and revealed a Cronbach’s alpha of 0.71 for the questions related to participants’ birth order.
The College of Dentistry (COD) has been established by virtue of a decree issued by University Council in August in its first session of academic year 2006/2007. The COD is composed of two years pre-professional program under the care of College of Science and Health Profession (COSHP) and a four years professional course. The last year (7th) is the internship program. The courses in the dental college include a semester and an annual program that integrate basic science with preclinical and clinical discipline. Various methods were used for assessment through semester system of examination and annual system of examination. These include written exams, oral exams, Objective structured clinical examination (OSCE), objective structured practical examination (OSPE) and oral case presentation. The CGPA is calculated for cumulative and semester based on credit hour out of 5. All the students of the four professional academic years as well as the trainers of internship program were included. The number of male students was 174 while female students were 134. Students who were absent or did not want to participate in the study were excluded from the research as the only two exclusion criteria.
To compare the mean CGPA between four groups of birth order and to detect a minimum difference of at least 0.5 out of 5 with a standard deviation of 1, at 5% level of significance and power of 80%, the required sample 252 (63 from each group). However, the goal was to include all the students in the College of Dentistry which includes 174 male and 134 female students to accommodate for the non-responses. It was decided to administer the questionnaires to the undergraduate students of the COD because it’s easier to access due to time constraint.
To obtain the required information, survey forms were created to include the Cumulative Grade Point Average, birth order, the family size, socioeconomic status of the parents and gender. Then, the self-administered written questionnaires were distributed to the participants at the start of their classes, laboratory and clinical sessions and were collected at the end of those sessions. The birth order of the students is the independent or predictor variable and the CGPA of the dental college is the dependent or outcome variable. The CGPA is considered as numerical (continuous) variable while birth order is categorical (discrete) variable. The self-reported CGPA is a valid outcome measure since the students did not list their name or student number on the questionnaire. All answered data were anonymous as recommended and approved by the ethical body, represented by the Institutional Review Board (IRB) belonging to King Abdullah International Medical Research Center (KAIMRC) at KSAU-HS. All subjects were given a consent form that was filled along with the survey.
Statistical Analysis
All data were first entered on Microsoft Excel sheet which later transferred to statistical software SPSS version 20.0 for analysis. Data were checked for missing information and cleaned. Data on sibling size, age, income and CGPA are numerical variables and were reported as mean and standard deviation. On the other hand, birth order is categorical data and was presented as frequencies and percentages. The F-test (ANOVA) was used to compare the mean CGPA (the dependent variable) by the birth order-sibling rank-(independent variables). General linear model was used as a multivariable analysis to accommodate for other baseline characteristics. Also, chi-square test was used to assess the relationship between the birth order (sibling rank) and CGPA categories. A test was considered significant if p-value was <0.05.
Results
A total of 308 questionnaires were distributed to the participants and 269 (87%) were returned. Nine students were excluded as the CGPA was not filled in or participants did not complete the questionnaires. Some participants were absent (24) and six participants were not interested to participate in the study. The baseline characteristics for all participants are shown in [Table/Fig-1].
Baseline characteristics of participants.
| Variables | Variables | N | % |
|---|
| Gender | Male | 148 | 55 |
| Female | 121 | 45 |
| Age (years) | <=20 | 54 | 20 |
| 21 | 90 | 34 |
| 22 | 55 | 20 |
| 23 or more | 70 | 26 |
| CGPA | <4.0 | 37 | 14 |
| 4-4.49 | 127 | 47 |
| 4.5+ | 105 | 39 |
| Level | 1st year | 75 | 28 |
| 2nd year | 69 | 26 |
| 3rd year | 68 | 25 |
| 4th year | 43 | 16 |
| Internship | 14 | 5 |
| Birth order | The first or only child | 74 | 28 |
| Not the first born but the first gender or only gender | 48 | 18 |
| Middle-born | 122 | 45 |
| Last born | 25 | 9 |
| Siblings | <5 | 54 | 20 |
| 5 | 65 | 24 |
| 6 | 59 | 22 |
| 7 | 35 | 13 |
| 8+ | 56 | 21 |
| CGPA (mean±SD) | | 4.32 | 0.37 |
| Siblings size (mean±SD) | | 6.2 | 2.5 |
There were 148 (55%) males who completed the questionnaires. The age ranged from 18-25 years with >90% of the participants fit between 20 and 23 years. The average CGPA for all participants was 4.32±0.37. The majority of the participants had a CGPA of four or more (86%). Since some birth order groups were very similar and small, an analysis was conducted with four major categories; first-born and only child were 74 out of 269 (28%) of the participants, not the first born but the first gender or only gender were 48 (18%), middle-borns were 122 (45%), and the last borns were 25 (9%). The mean sibling size (numbers of brothers and sisters) was 6.2±2.5 and only (20%) of participants had less than five siblings.
The parents’ education varied between mothers and fathers; whereas fathers who gained education lower than bachelor’s degree formed 23% of the total sample size, mothers formed 37% of this level of education. Fathers who gained bachelor’s degree were 45% compared to 48% of the mothers. Fathers who had either master’s degree or doctorate degree were 32% compared to 15% of the mothers. The percentage of employed mothers were 34%, working either full time 29% or part time (5%) and retired (19%), compared to 50% of fathers working full time and 7% working part time with 35% retired, [Table/Fig-2]. The survey results showed that 67% of the families gained $4,000 per month or more while 19% of the subjects did not know the family income.
Parental educational and socioeconomic status.
| Parents’ education level | Mothers | Fathers |
|---|
| Lower than bachelor’s degree | 100 (37%) | 62 (23%) |
| Bachelor’s degree | 129 (48%) | 121 (45%) |
| Master’s degree/Doctorate degree | 40 (15%) | 86 (32%) |
| Employment status of parents | Mothers | Fathers |
| Part time | 13 (5%) | 19 (7%) |
| Full time | 78 (29%) | 135 (50%) |
| Retired | 51 (19%) | 94 (35%) |
Comparing the mean CGPA between genders, females had higher mean than males with significant difference (p<0.001). While there was no significant difference in mean CGPA across the birth order groups (p=0.06) [Table/Fig-3].
Comparison of CGPA mean by gender and birth order.
| Variables | Gender | N | Mean | SD | p-value |
|---|
| Gender | Male | 148 | 4.18 | 0.39 | <0.001 |
| Female | 121 | 4.50 | 0.26 |
| Birth order | The first or only child | 74 | 4.26 | 0.40 | 0.063 |
| Not the first born but the first gender or only gender | 48 | 4.26 | 0.45 |
| Middle-born | 122 | 4.39 | 0.30 |
| The last born | 25 | 4.29 | 0.42 |
Since there was a significant difference in mean CGPA between males and females, analysis of variance for CGPA with other variables was carried out. The results showed that the CGPA significantly affected by gender (p<0.001) as well as for birth order (p=0.028). It is substantial to control confounding factors like the socioeconomic status which is represented by parent’s education, parent’s occupation and household income. Covariates of father’s education, mother’s education, father’s job, mother’s job and family income that was not controlled in the study but could have affected the outcome, were not significant [Table/Fig-4].
Multivariable analysis of CGPA by participants’ baseline characteristics and parental socioeconomic status.
| Dependent variable: CGPA |
|---|
| Source | F | p-value |
|---|
| Gender | 2.844 | <0.001 |
| Student level | 3223.272 | 0.213 |
| Birth order | 49.134 | 0.028 |
| Siblings | 1.466 | 0.224 |
| Father’s education | 3.1 | 0.804 |
| Mother’s education | 1.432 | 0.998 |
| Father’s job | 0.462 | 0.769 |
| Mother’s job | 0.05 | 0.943 |
| Income | 0.455 | 0.186 |
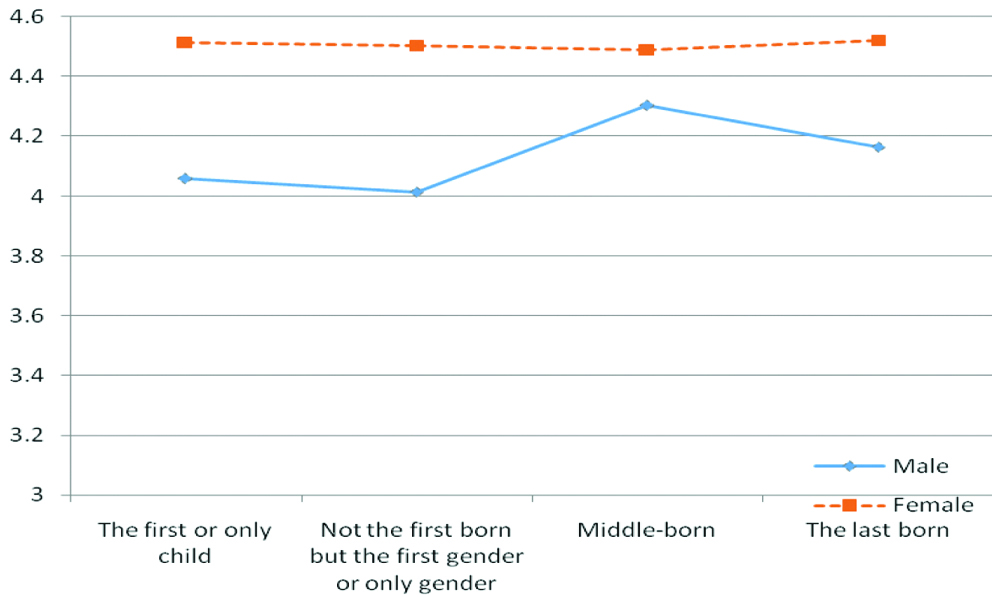
Since there was a significant difference in mean CGPA between males and females, a separate analysis was carried out to assess the effect of birth order on CGPA within each gender. The [Table/Fig-5] shows a significant effect of birth order among males (p<0.001) while insignificant effect among female (p=0.97). Tukey’s test analysis was run to find out which specific groups’ means are different. The test showed the mean of the middle-born male participants had a CGPA of 4.31±0.32 compared to the last born with a CGPA of 4.17±0.43 and first or only child with a CGPA of 4.06±0.38, whereas the participants who were not the first born but the first gender or only gender had a CGPA of 4.01±0.45. The [Table/Fig-6] shows the mean GPA of males and females according to their birth order.
Comparison of mean CGPA by gender and birth order.
| Gender | | N | Mean | SD | p-value |
|---|
| Male | The first or only child | 41 | 4.06 | 0.38 | <0.001 |
| Not the first born but the first or only gender | 24 | 4.01 | 0.45 |
| Middle-born | 67 | 4.31 | 0.32 |
| The last born | 16 | 4.17 | 0.43 |
| Total | 148 | 4.18 | 0.39 |
| Female | The first or only child | 33 | 4.51 | 0.25 | 0.97 |
| Not the first born but the first gender or only gender | 24 | 4.50 | 0.29 |
| Middle-born | 55 | 4.49 | 0.25 |
| The last born | 9 | 4.52 | 0.29 |
| Total | 121 | 4.50 | 0.26 |
The mean CGPA of males and females according to their birth order.
In [Table/Fig-7], there was a significant finding in male participants in association with the CGPA within different birth order groups. For CGPA less than four, the percentage of middle born participants were 11.9% compared to the last born with 18.8%, whereas the participants who were the first or only child were 31.7%, however, not the first born but the first gender or only gender was 37.5%. On the other hand, for CGPA more than 4.5, the percentage of middle born participants were 29.9% compared to the last born with 25%, whereas the participants who were the first or only child were 9.8%, however, not the first born but the first gender or only gender was 8.3%.
The breakdown of CGPA according to gender and birth order.
| Gender | Birth order | CGPA |
|---|
| <4.0 | 4-4.49 | 4.5+ | p-value |
|---|
| N (%) | N (%) | N (%) |
|---|
| Male | The first or only child | 13 (31.7%) | 24 (58.5%) | 4 (9.8%) | 0.023 |
| Not the first born but the first or only gender | 9 (37.5%) | 13 (54.2%) | 2 (8.3%) |
| Middle-born | 8 (11.9%) | 39 (58.2%) | 20 (29.9%) |
| The last born | 3 (18.8%) | 9 (56.2%) | 4 (25.0%) |
| Female | The first or only child | 0 (0.0%) | 11 (33.3%) | 22 (66.7%) | 0.866 |
| Not the first born but the first or only gender | 1 (4.2%) | 9 (37.5%) | 14 (58.3%) |
| Middle-born | 3 (5.5%) | 19 (34.5%) | 33 (60.0%) |
| The last born | 0 (0.0%) | 3 (33.3%) | 6 (66.7%) |
Discussion
This study was conducted primarily to examine the effect of birth order on academic performance, and secondarily to inspect the impact of number of siblings in the family or gender on academic achievement in a dental school in Riyadh, Kingdom of Saudi Arabia. Other studies had tried to investigate the same primary objective but in different countries; such as Norway, the United States and Jordan [1-3]. This study was unique in Saudi Arabia, especially that the subjects were dental students and interns. The results demonstrate that birth order in males appears to have different effects on CGPA in dental undergraduate students. Statistically significant results were found in the relationship between gender and CGPA and in the relationship between birth order and CGPA. There is a significant difference in the mean CGPA between males and females which might be due to the nature of the female students who are more studious and focused on their studies. Additionally, males have many venues for distractions that are not available for female students related to the conservative culture in Saudi Arabia.
The middle-born male participants seem to have higher CGPA compared to other birth order groups. The possible explanation for such variation could be that middle-born male participant trying to get more attention by working hard and proving themselves as the best among the others. Whereas, students who are the first or only gender, as well as not the first but the first gender, or only gender seem to secure their privileges within their family. Similarly, other studies from developing countries found that first born children perform less in school compared to later born children. This is probably due to high family size in these countries [16,17]. On the other hand, a negative birth order effect has been found in developed countries where first born children achieve better than later born children [18,19]. Despite this variation in males, females in this study showed fewer variations among the four groups. However, other results showed no influence of birth order on academic performance [20]. The response rate to the questionnaires is considered to be high. The questionnaires were distributed by the investigators while students and interns had their pre-scheduled classes, clinics and laboratories with the help of the students’ representatives. The names and identification of the participants stayed anonymous which encouraged them to participate. The male participants formed more than half of the total sample size, this difference could be due to the fact that the male students outnumbered females at the school, and the interns were all males. The age range of the participants is normal since dental students attend dental school for four years right after completing two pre-professional years in college following high school. Additional one-year mandatory internship is required before being able to get their dental licenses. The lower number of participants in the final year, as well as the internship year, is related to the fact that the dental school was newly established and very limited numbers of students were admitted early on.
The original groups of birth order in the questionnaire were ten groups. Since some groups were similar and small in size, some of those groups were combined and the analysis was conducted with four distinct categories: the first or only child, not the first born but the first gender or only gender, middle-born and the last born. The mean sibling size (number of brothers and sisters in the same family) is considered very high compared to other countries (6.2±2.5). This is higher than the Saudi national average measured in 2010 which found that the average family size including parent to be 6.4 [5]. This difference still falls within the standard deviation. In either case, the average family size in the Saudi Arabia is considered one of the highest sizes in the world. The family size in the United States is 3.14, whereas the average household size in Europe is 2.3 members [6]. The average national Saudi income per month is $4,000, while the average family income in the study was higher where 67% of the sample gained more than the average [6].
It is substantial to control confounding factors like the socioeconomic status which is represented by parent’s education, parent’s occupation and household income. Differences of father’s education, mother’s education, father’s job, mother’s job and family income that was not controlled in the study but could have affected the outcome, were not significant. Other studies analysis indicated that socioeconomic status was a far more powerful explanatory variable than family size [21-24].
The study consists of a number of strengths that made research findings valid and informative. First, different birth order group was included like not the first born but the first gender or only gender. Therefore, the inclusion of this group as a separate birth order class was valuable for current study. Second, this is the first study in Saudi Arabia examining the association of birth order on academic performance. For future study, it is recommended to increase the sample size and collect data from various universities so that the power and generalization of the study could be improved. Besides, researchers should take such confounding factors as birth spacing, mother age and hereditary factors into account if birth order study were to be conducted.
Limitation
There are some limitations to this study. First, the study conducted only in dental college and did not include other colleges in the university. Therefore, research finding cannot be generalised over Saudi Arabia. Second, the effects of other confounders such as birth spacing, mother age, shared environment and hereditary factors also have an effect on academic performance.
Conclusion
This study found that middle-born males in Riyadh dental college had shown the highest tendency to have better academic performance compared to other birth order groups. Females did not show the same tendency and are eager to achieve high level in academic education regardless of their birth order or family size. The controversy of birth order effect on academic performance may continue to vary among countries, family sizes and different cultures. The implication of this study infers that parents’ treatment of their children is equally irrespective of their birth order by assessing and meeting each child’s unique needs for better academic success in the future.