Association of Serum Free Haemoglobin in Normoglycemic and Hyperglycemic Individuals
Jiut Ram Keshari1, Manish Mandal2, Montosh Chakraborty3, Debajit Bagchi4, Praveen Sablania5
1 Associate Professor, Department of Biochemistry, IGIMS, Patna, Bihar, India.
2 Professor, Department of G.I. Surgery, IGIMS, Patna, Bihar, India.
3 Associate Professor, Department of Biochemistry, AIIMS, Manglagiri, Andhra Pradesh, India.
4 Tutor, Department of Biochemistry, ANIIMS, Port Blair, Andaman and Nicobar Islands, India.
5 Associate Professor, Department of Biochemistry, ANIIMS, Port Blair, Andaman and Nicobar Islands, India.
NAME, ADDRESS, E-MAIL ID OF THE CORRESPONDING AUTHOR: Dr. Praveen Sablania, Associate Professor, Department of Biochemistry, Andaman and Nicobar Islands Institute of Medical Sciences, Near DHS Annexe Building, Port Blair-744104, Andaman and Nicobar Islands, India.
E-mail: sablaniapraveen@rediffmail.com
Introduction
Besides glycation induced injury, hyperglycemia in both type 1 and 2 diabetes can also increase oxidative stress leading to alterations in erythrocytic structural-functional organisation, shortening of life span and eryptosis. Free Haemoglobin (fHb) is released in circulation that could cause deleterious clinical effects. No study has associated fHb with hyperglycemia till now, thus it is pertinent to examine this aspect.
Aim
The present study has associated serum fHB with hyperglycemia by simple, rapid, inexpensive spectrophotometric assay using Allen correction.
Materials and Methods
The present case control study consisted of a total of 74 participants grouped into normoglycemic controls (n=37) and hyperglycemic subjects (n=37). Serum sample were analysed for haemoglobin (Hb) concentration by direct spectrophotometry using Allen correction. Concentration of Hb was calculated by Harboe’s Allen correction as Hb (mg/L)=1.68.A415-0.84.A380-0.84.A450 (absorbance in milliabsorbance). Statistical analysis was done using Statistical Package for Social Sciences (SPSS) version V21.0 and Microsoft excel software employing independent unpaired student’s-t-test and pearson’s correlation coefficient and χ2 test for trend while Odds Ratio (OR) and corresponding 95% CI was calculated using binary logistic regression.
Results
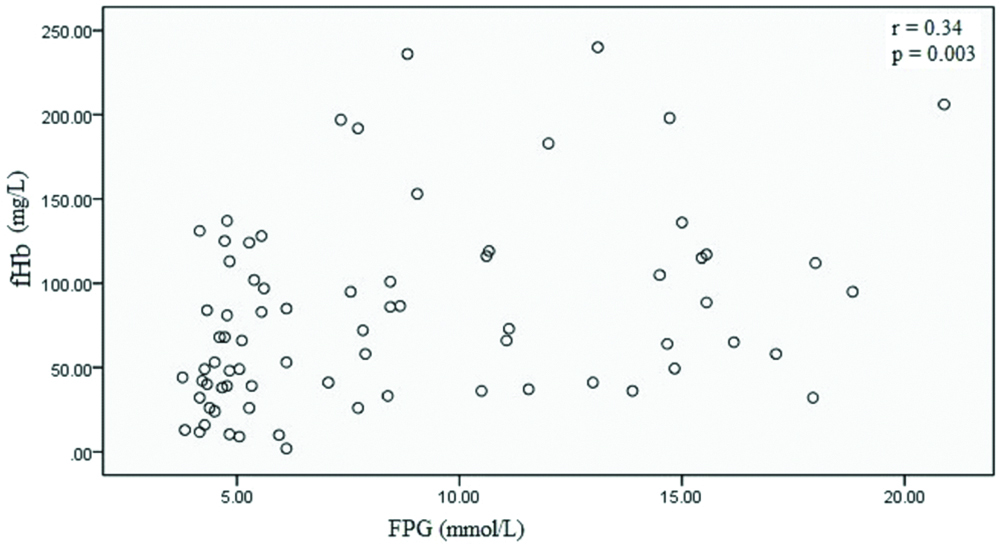
Mean serum fHb levels were significantly elevated in hyperglycemia (101.74±61.73 mg/L; p=0.001) as compared to controls (58.44±39.69 mg/L). A dose dependent relationship was evident between increased serum fHb with hyperglycemia (p<0.001) and OR was statistically significant in hyperglycemia [OR (95% CI)=2.95 (1.05–8.31); p=0.04]. Serum fHb concentration was positively and significantly correlated with fasting plasma glucose (FPG) (r=0.34, p=0.003).
Conclusion
Hyperglycemia causes glycation of tissue and circulating proteins as well as oxidative stress to erythrocyte membrane leading to alterations in erythrocytic membrane fluidity and shortening of life span. Serum fHb is widely used as marker of intravascular haemolysis and fHb is estimated by immunoassay that is expensive and cyanide based spectrophotometry that is toxic. The current study has associated fHb with hyperglycemia with direct spectrophotometry using Allen correction that uses minimal reagents and is non-toxic besides being inexpensive. We found that levels of fHb were significantly increased in hyperglycemia than controls (p<0.05) and fHb was positively and significantly correlated with FPG (p=0.003). The findings of our study suggests that erythrocytes are susceptible to hyperglycemic injury and fHb could be estimated inexpensively as marker of haemolysis.
Advanced glycation end products, Diabetes, Eryptosis, Haemolysis
Introduction
Diabetes mellitus is a metabolic disorder characterised by hyperglycemia, which on prolonged exposure results in complications such as atherosclerosis, nephropathy and retinopathy. Hyperglycemia causes tissue damage through multiple mechanisms viz. formation of glycation adducts that can progress to development of advanced glycation end products (AGEs) and consequently accumulation of AGEs over life span of protein [1]. Glycation of circulating and tissue protein including erythrocytic membrane protein can produce structural-functional alterations in proteins, can cause chemical modifications and can alter cell behaviour and interaction [2]. Besides glycation induced injury, hyperglycemia in both type 1 and 2 diabetes can also increase oxidative stress due to autooxidation of glucose and redox shift in tissue and plasma [3]. Uncontrolled production of Reactive Oxygen Species (ROS) can cause mitochondrial superoxide overproduction in endothelial cells of small vessels, loss of β-cell function and mediation of insulin resistance, consequently progressing to diabetes mellitus and its microvascular and macrovascular complications [4]. ROS can cause lipid peroxidation producing hydroperoxides and highly reactive aldehydes as malondialdehyde and 4-hydroxynonenal [5]. It can also cause protein oxidation generating carbonylated proteins [6] though glycation itself is an inducer of protein carbonyls [7]. It is also evident that levels of plasma antioxidants/antioxidant enzymes such as glutathione, tocopherol, superoxide dismutase, catalase, glutathione peroxidase and reductase are decreased [4].
The effect on erythrocytic membrane is due to glycation of membrane protein resulting in reduced membrane fluidity, oxidation of membrane phospholipid and decrease in membrane symmetry [8]. Consequent to these free radical induced lipid peroxidation and membrane protein glycation, structural-functional organisation of erythrocytes is compromised and makes the cell leaky and shortens their life span [9].
Thus there is a potential of increased haemolysis and rise in serum fHb levels. Levels of total Hb in whole blood has been the most direct indicator of haemolysis whereas indirect indicator being reticulocyte count, serum lactate dehydrogenase, haptoglobin and ferritin [10]. Therefore, it is desirable to determine serum fHb levels in diabetes that has not been examined before. The current study has associated serum fHB with hyperglycemia by simple, rapid, inexpensive spectrophotometric assay using Allen correction.
Materials and Methods
The present case control study was conducted in the Department of Biochemistry, Indira Gandhi Institute of Medical Sciences, Patna, Bihar, India and Andaman and Nicobar Islands Institute of Medical Sciences, Port Blair Andaman and Nicobar Islands, India, on serum specimen that were collected for various diagnostic purposes from April to October, 2018. Only those serum samples were selected that were collected for Fasting Plasma Glucose (FPG) and 2-hour Plasma Glucose (2-h PG). The study was approved by Institutional Ethics Committee (registration no. ECR/640/Inst/BR/2014/RR-17) and informed consent was taken from both cases and controls. The power of the study was 80% associated with 95% confidence interval. A total of 74 participants were grouped into 37 normoglycemic controls and 37 hyperglycemic subjects. Hyperglycemic samples were obtained from freshly diagnosed type 2 diabetes mellitus subjects. FPG of >7 mmol/L and 2-h PG of >11.1 was used as criteria to diagnose hyperglycemic subjects as diabetic [11]. Controls were selected from individuals that came to attend various OPDs for routine check-up and were matched with respect to age and gender with hyperglycemic cases. Only those subjects that aged between 18-65 years with normal liver and renal function tests were included for both cases and controls. Exclusion criteria for both cases and control were active smokers, undergoing hypoglycemic drug treatment, uremia, sickle cell anemia, haematological malignancy, blood transfusion, subjects supported by ventricular assisted devices, recent trauma or surgery, pregnant females, any concurrent medical illness and abnormal liver and renal function tests. A 5 mL of overnight fasting blood was collected in plain vial and serum was separated by centrifugation and stored at -20°C till analysis on following day.
Duplicates of serum sample and triplicates of haemoglobin standard were analysed for haemoglobin concentration by direct spectrophotometry (Analytical Technologies Limited, Model No. UV-3366 Plus) using Allen correction [12]. Serum sample of 300 μL was diluted with 2.7 mL of tris (hydroxymethyl) methylamine buffer (62.5 mM, pH 8.0), vortexed and measured at 415 nm, 380 nm and 450 nm at 25°C. For checking the accuracy and precision of the assay, a freshly collected blood in Na2EDTA vial was used as standard. Haemoglobin concentration in anticoagulated blood was measured using automated haematology analyzer that measures total haemoglobin and four specimen were selected (concentrations of 5.5, 10.2, 12.6 and 16.3 g%) which were subjected to further processing with slight modifications [12,13], briefly, to a 98 μL of 10.2 g% Hb specimen 9902 μL (~9.9 mL) of distilled water was added, followed by freeze-thawing induced lysis of erythrocytes to produce a haemoglobin stock solutions of 1000 mg/L. Similarly, stock solutions for all other selected specimen were prepared and six working standards (400, 300, 200,100, 50 and 25 mg/L) were prepared from each stock solution. The concentration of serum fHb/standard Hb was calculated using Harboe’s Allen correction [12] as Hb (mg/L)=1.68.A415-0.84.A380-0.84.A450 (absorbance in milliabsorbance).
Statistical Analysis
Statistical analysis was done using SPSS statistics (V21.0) and Microsoft excel software. Variables in controls were compared with those of cases for significant mean with independent unpaired student’s-t-test and pearson correlation coefficient. In all tests of significance, two sided p-value have been reported with p-value significant at <0.05. Hyperglycaemic cases were categorised into quartiles according to distribution in controls. Risk was estimated using binary logistic regression while Odds Ratio (OR) was calculated for 4th quartile of cases using Interquartile Range (IQR) as reference. The Coefficients of Variation (CV) for triplicates of serum/standard were less than 10% and intra-assay and inter-assay precision for CV ranges were 4.6-7.8% and 3.4-7.2% respectively.
Results
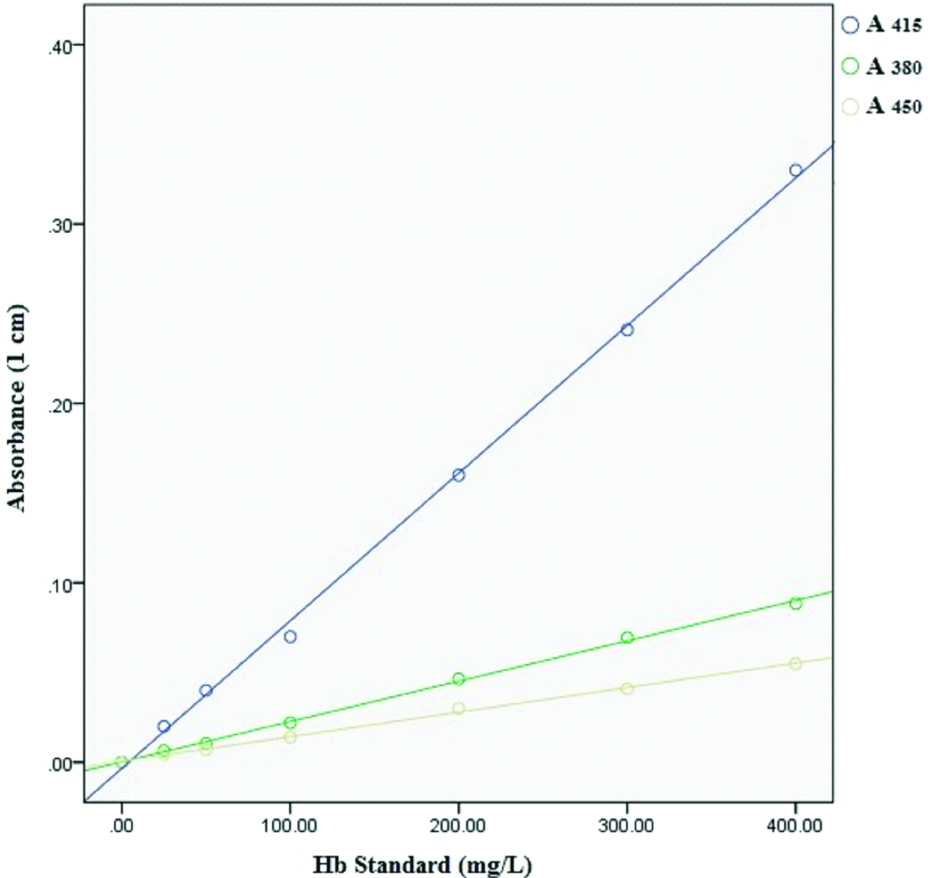
Mean serum fHb levels were significantly elevated in hyperglycemia compared to controls (101.74±61.73 mg/L in hyperglycemia versus 58.44±39.69 mg/L in controls; p=0.001). A dose dependent relationship (χ2 test for trend) was evident between risk of increased serum fHb with hyperglycemia (p<0.001). When OR was calculated for 4th quartile with IQR as reference, OR was statistically significant in hyperglycemia {OR (95% CI)=2.95 (1.05-8.31); p=0.04}. Highest number of cases were present in 4th quartile (56.76%) and lowest in 1st quartile (2.70%) [Table/Fig-1]. Serum fHb concentration was positively and significantly correlated with FPG (r=0.34, p=0.003) [Table/Fig-2]. Average absorbance at 415 nm, 380 nm and 450 nm of assay of each working standard was used for measuring hemoglobin concentration i.e., concentration of working standard used were 25, 50, 100, 200, 300, 400 mg/L while measured concentrations were 22.01, 47.46, 94.92, 210.76, 312.06, 430.51 mg/L, respectively [Table/Fig-3].
Comparison between serum Hb in normoglycemia and hyperglycemia patients.
| Normoglycemia | Hyperglycemia | p-value |
|---|
| Number of cases | 37 | 37 | - |
| Age in years (±SD) | 49.98 (±11.71) | 51.43 (±11.09) | 0.584 |
| FPG† (±SD) mmol/L | 4.86 (±0.63) | 12.21 (±3.84) | <0.001* |
| fHb§ (±SD) mg/L | 58.44 (±39.69) | 101.74 (±61.73) | 0.001* |
| Quartiles | Countπ | Count | p value for χ2 test for trend <0.001*OR (95% CI)**=2.95 (1.05-8.31)p value for OR=0.04* |
| 1st (2.11-26.04 mg/L) | 9 (24.32%) | 1 (2.70%) |
| 2nd (26.05-48.72 mg/L) | 10 (27.03%) | 7 (18.92%) |
| 3rd (48.73-84.14 mg/L) | 9 (24.32%) | 8 (21.62%) |
| 4th (84.15-136.92 mg/L) | 9 (24.32%) | 21 (56.76%) |
*p-value significant at <0.05; †FPG=Fasting plasma glucose; §fHb=Serum free hemoglobin; πCount: Count is in N(%) i.e., Number (Percentage); **Odds Ratio (95%CI)=OR (95%CI) for 4th quartile with IQR as reference.
Correlation between FPG and serum fHb.
Standard curve for Hb standard at 415 nm, 380 nm and 450 nm.
Discussion
To our knowledge, no study has correlated serum fHb levels with hyperglycemia in Indian cohorts. In the present study, levels of serum fHb were significantly increased in hyperglycemia than controls (p<0.05). We also observed an upward trend from 1st through 4th quartile for S.Hb in hyperglycemia (p<0.001). When OR was calculated for 4th quartile with IQR as reference, OR was statistically significant in hyperglycemia (OR=2.95; p=0.04). Serum fHb concentration was positively and significantly correlated with FPG (p=0.003). The studies that associate serum fHb with diabetes mellitus are missing but it has been widely employed in patients supported with Extracorporeal Membrane Oxygenation (ECMO) or short-term centrifugal ventricular assist devices (VADs) for the diagnosis of critical pump thrombosis and circulating fHb levels in excess of 1000 mg/L to predict mortality [14] as well as a predictor of acute renal failure [15]. Plasma fHb can be as high as 25 μM during sickle cell crisis with lowering of haptoglobin (Hp) levels [16]. Circulating fHb can cause adverse clinical effects by various mechanisms; as extravascular translocation of Hb [17], depletion of NO (and forming concurrent nitrosylated Hb, Hb-Fe3+ and ferryl Hb) [18], release of hemin from Hb-Fe3+ which could act as ligand both for transcriptional repressor Bach-1 and nuclear hormone receptor REV-ERB [19]. Free Hb is cleared by scavenger proteins as haptoglobin and hemopexin to attenuate toxicity of fHb, principally by sequestering fHb and there after reticuloendocytic clearance in hepatocytes leading to decrease in haptoglobin levels during haemolysis [20]. On the other hand, hyperglycemia induces higher circulating glycoproteins levels as haptoglobin besides causing glycation of serum proteins [21]. In an in-vitro study, Kucherenko YV et al., reported increase in both eryptosis and AGEs in high glucose treated erythrocytes [22]. On this ground, we speculate that even in face of higher haptoglobin levels, scavenging potential of it are not optimally utilised because glycation could plausibly cause structural-functional alterations in protein and consequently increase in fHb levels.
Hemoglobin concentration of diluted blood specimen can be determined by cyanide-ferricyanide reagent based direct spectrometry (without the need for a standard) using millimolar extinction coefficient of hemoglobin at 540 nm [23] but presence of turbidity could give erroneous results when measured at single wavelength of 540 nm and reagent used is toxic [24]. Similarly, other non-cyanide based methods are either inaccurate or expensive [24]. In this study, we have used an inexpensive and rapid method which does not require haemoglobin standard. This method has the advantage of using minimal reagents and correction of background ‘shoulder absorbance’ i.e., interference due to bilirubin or triglycerides by employing Allen correction [12]. The concentration (measured/calculated) of Hb standards closely matched with concentration (known) of anticoagulated whole blood and both correlated highly significantly (r=0.999, p<0.001). The accuracy of measured Hb standard in our study resonates with Fairbanks VF et al., [12,13] that also utilised direct spectrophotometry using Allen correction, thus demonstrating it to be a viable alternative to methods presently available for estimating fHb.
Limitation
Our data provides preliminary evidence of elevated serum fHb in hyperglycemia but our findings are not generalizable because of restraint in number of samples. Therefore, a prospective case control study involving a larger sample size is recommended.
Conclusion
Hyperglycemia causes tissue damage through multiple mechanism as formation of glycation adducts, structural-functional alternations in proteins and oxidative stress. Consequently erythrocytic membrane fluidity is affected leading to shortening of life span of erythrocytes. fHb is widely used as marker of intravascular haemolysis as in patients supported with ventricular assisted device and sickle cell crisis. fHb is estimated by immunoassay (expensive) and spectrophotomety using cyanide-ferricyanide based reagents (toxic). The present study is first case-control study to associate fHb with hyperglycemia using inexpensive and non-cyanide based assay based on direct spectrophotometry employing Allen correction. In our study, levels of fHb were significantly increased in hyperglycemia than controls (p<0.05) and fHb was positively and significantly correlated with FPG (r=0.34, p=0.003). The findings of our study suggests that direct spectrophotometry using Allen correction is a feasible inexpensive alternative to existing methods for estimating fHb as marker of intravascular haemolysis in diabetes.
Acknowledgements and Funding Source
No external funding was provided. I sincerely acknowledge Dr. Gautam Sarkar, Professor and Head, Department of Biochemistry, ANIIMS, for his support and cooperation during the conduct of study.
*p-value significant at <0.05; †FPG=Fasting plasma glucose; §fHb=Serum free hemoglobin; πCount: Count is in N(%) i.e., Number (Percentage); **Odds Ratio (95%CI)=OR (95%CI) for 4th quartile with IQR as reference.
[1]. Singh R, Barden A, Mori T, Beilin L, Advanced glycation end-products: A reviewDiabetologia 2001 44:129-146.10.1007/s00125005159111270668 [Google Scholar] [CrossRef] [PubMed]
[2]. Dalziel M, Crispin M, Scanlan CN, Zitzmann N, Dwek RA, Emerging principles for the therapeutic exploitation of glycosylationScience 2014 343:1235681-1-1235681-8810.1126/science.123568124385630 [Google Scholar] [CrossRef] [PubMed]
[3]. Korkmaz GG, Konukoglu D, Kurtulus EM, Irmak H, Bolayrili M, Uzun H, Total antioxidant status and markers of oxidative stress in subjects with normal or impared glucose regulation (IGF, IGT) in diabetic patientsScand J Clin Lab Invest 2013 73(8):641-49.10.3109/00365513.2013.84647724152132 [Google Scholar] [CrossRef] [PubMed]
[4]. Tiwari BK, Pandey KB, Abidi AB, Rizvi SI, Markers of oxidative stress during diabetes mellitusJ Biomark 2013 2013:378790doi: 10.1155/2013/37879010.1155/2013/37879026317014 [Google Scholar] [CrossRef] [CrossRef] [PubMed]
[5]. Hallinwell B, Chirico S, Lipid peroxidation: Its mechanism, measurement, and significanceAm J Cl Nutr 1993 57(5):715S-24S.10.1093/ajcn/57.5.715S8475889 [Google Scholar] [CrossRef] [PubMed]
[6]. Suzuki D, Miyata T, Carbonyl stress in the pathogenesis of diabetic nephropathyInt Med 1999 38(4):309-14.10.2169/internalmedicine.38.30910361902 [Google Scholar] [CrossRef] [PubMed]
[7]. Levine RL, Garland CN, Determination of carbonyl content in oxidatively modified proteinsMethods Enzymol 1990 186:464-78.10.1016/0076-6879(90)86141-H [Google Scholar] [CrossRef]
[8]. Nicolay JP, Schneider J, Niemoeller OM, Artunc F, Portero-Otin M, Haik G Jr, Stimulation of suicidal erythrocyte death by methylglyoxalCell Physiol Biochem 2006 18(4-5):223-32.10.1159/00009766917167227 [Google Scholar] [CrossRef] [PubMed]
[9]. Jain SK, Hyperglycemia can cause membrane lipid peroxidation and osmotic fragility in human red blood cellsJ Biol Chem 1989 264:21340-45. [Google Scholar]
[10]. Barcellini W, Fattizzo B, Clinical applications of hemolytic markers in the differential diagnosis and management of hemolytic anemiaDisease Markers [internet] 2015 Article ID 635670:1.10.1155/2015/63567026819490 [Google Scholar] [CrossRef] [PubMed]
[11]. American Diabetes AssociationClassification and diagnosis of diabetes: Standards of medical care in diabetesDiabetes Care 2018 41(1):S13-S27.10.2337/dc18-S00229222373 [Google Scholar] [CrossRef] [PubMed]
[12]. Noe DA, Weedn V, Bell WR, Direct spectrophotometry of serum haemoglobin: An Allen correction compared with a three-wavelength polychromatic analysisClin Chem 1984 30(5):627-30.10.1017/S0084255900038936 [Google Scholar] [CrossRef]
[13]. Fairbanks VF, Ziesmer SC, O’Brien PC, Methods for measuring plasma hemoglobin in micromolar concentration comparedClin Chem 1992 38(1):132-40. [Google Scholar]
[14]. Neal JR, Quintana E, Pike RB, Hoyer JD, Joyce LD, Schears G, Using daily plasma-free hemoglobin levels for diagnosis of critical pump thrombus in patients undergoing ecmo or vad supportJ Extra Corpor Technol 2015 47(2):103-08. [Google Scholar]
[15]. Liu L, Long C, Hei F, Ji B, Liu J, Yu K, Plasma free hemoglobin is a predictor of acute renal failure during adult venous-arterial extracorporeal membrane oxygenation supportJ Cardiothorac Vasc Anesth 2016 30(4):891-95.10.1053/j.jvca.2016.02.01127238434 [Google Scholar] [CrossRef] [PubMed]
[16]. Muller-Eberhard U, Javid J, Liem HH, Hanstein A, Hanna M, Concentrations of hemopexin, haptoglobin and heme in patients with various hemolytic diseasesBlood 1968 32(5):811-15. [Google Scholar]
[17]. Nakai K, Sakuma I, Ohta T, Permeability characteristics of hemoglobin derivatives across cultured endothelial cell monolayersJ Lab Clin Med 1998 132(4):313-19.10.1016/S0022-2143(98)90045-2 [Google Scholar] [CrossRef]
[18]. Vallelian F, Pimenova T, Pereira CP, The reaction of hydrogen peroxide with hemoglobin induces extensive alpha-globin crosslinking and impairs the interaction of hemoglobin with endogenous scavenger pathwaysFree Radic Biol Med 2008 45(8):1150-58.10.1016/j.freeradbiomed.2008.07.01318708138 [Google Scholar] [CrossRef] [PubMed]
[19]. Raghuram S, Stayrook KR, Huang P, Identification of heme as the ligand for the orphan nuclear receptors REV-ERBalpha and REV-ERBbetaNat Struct Mol Biol 2007 14(12):1207-13.10.1038/nsmb134418037887 [Google Scholar] [CrossRef] [PubMed]
[20]. Schaer DJ, Buehler PW, Alayash AI, Belcher JD, Vercellotii GM, Hemolysis and free hemoglobin revisited: Exploring hemoglobin and hemin scavengers as a novel class of therapeutic proteinsBlood 2013 121(8):1276-84.10.1182/blood-2012-11-45122923264591 [Google Scholar] [CrossRef] [PubMed]
[21]. Jonsson A, Wales JK, Blood glycoprotein levels in diabetes mellitusDiabetologia 1976 12(3):245-50.10.1007/BF0042209160265 [Google Scholar] [CrossRef] [PubMed]
[22]. Kucherenko YV, Bhavsar SK, Grischenko VI, Fischer UR, Huber SM, Lang F, Increased cation conductance in human erythrocytes artificially aged by glycationJ Membr Biol 2010 235:177-89.10.1007/s00232-010-9265-220526772 [Google Scholar] [CrossRef] [PubMed]
[23]. Bain BJ, Lewis SM, Dacie JVS, Dacie and Lewis practical haematology 2012 11th editionEdinburghElsevier Churchill Livingstone [Google Scholar]
[24]. Srivastava T, Negandhi H, Neogi SB, Sharma J, Saxena R, Methods for Hemoglobin Estimation: A Review of “What Works”J Hematol Transfus 2014 2(3):1028 [Google Scholar]