Diabetes Mellitus (DM) is a chronic metabolic disorder of multiple aetiology, which requires life-long treatment to maintain the blood glucose levels [1]. The American Diabetes Association (ADA) criteria for the diagnosis of DM include symptoms like polyuria, polydipsia and unexplained weight loss [2]. According to Diabetes Atlas (2017) published by the International Diabetes Federation (IDF), around 425 million people are diagnosed with diabetes representing 8.8% of adults aged 20-79 years. This number will increase to more than 629 million by the year 2045. Type-2 Diabetes Mellitus (T2DM) is spreading like an epidemic in India with more than 82 million diabetic individuals currently diagnosed and this number is expected to increase to 151 million by 2045 [3]. Considering the huge epidemic of T2DM, the use of Oral Hypoglycaemic Drugs (OHAs) remains the preferred pharmacological therapy, either as monotherapy or combination therapy in order to improve efficacy, tolerability, long-term compliance and prevent complications associated with T2DM.
Pharmaco-economics is a new scientific discipline of health economics. It compares two or more medication options in terms of cost-analysis. The total economic cost of diabetes was $132 billion in 2002, increased dramatically to $245 billion in 2012, which includes direct medical and treatment cost as well as indirect cost related to disability and mortality [4,5]. In developing nations like India where universal health coverage is yet to be achieved, most of them pay themselves for their health care. Issues like availability, variation in pricing of drugs are few among the major hindrances for the general public towards their health expenditure. Generic medicines are easily available in most of the medicine outlets but branded products were found to cost more than the generic equivalent [6]. In our country, one of the major concerns for diabetic patients is the cost of oral hypoglycaemic drugs. One spends approximately 20% of their income for the treatment of diabetes per year which affects the patients’ compliance to take drug regularly and for longer duration [7].
Regardless of the Government attempt to prevent inexcusable price mounting of drugs by incorporating National List of Essential Medicine (NLEM) and by enacting the Drug Price Control Order (DPCO), huge discrepancy in cost of drugs still occur [8]. The effective tool to find out the difference between various brands is percentage cost variation, which has been analysed in this study. Though studies had been done on drug utilisation in diabetic patients, focus on cost-analyses was limited in South India. Only one study done in south India (2015) has stated that the trend in prescribing is moving towards combination therapy [9]. Moreover, the above study failed to focus on Gliptin combinations available in the market and the cost analysis of the drugs was not performed. After the Indian Government’s price control and ban on various fixed dose combinations like Glibenclamide, Metformin, Pioglitazone and Gliclazide, Metformin, Voglibose, etc., there has been cost variations in the diabetic medications marketed in India and this information has to be gathered, analysed and dispersed to the practicing physicians to decrease the economic burden of Type-2 diabetic patients.
Hence, this study was planned to evaluate the pattern of oral hypoglycaemic agents usage, their cost-analyses and percentage cost variation among Type-2 diabetic patients in a tertiary care teaching hospital.
Materials and Methods
This observational cross-sectional study was conducted among Type-2 diabetic patients attending the Department of Diabetology of a tertiary care teaching hospital, Puducherry over a period of 3 months from October 2017 to December 2017 (Period sampling). A total of 310 prescriptions of Type-2 diabetic patients were collected using convenient random sampling technique, out of which 300 prescriptions were taken for analysis as 10 prescriptions had inadequate data. Both male and female with Type-2 diabetes mellitus treated with oral hypoglycaemic agents, patients in the age group ≥20 years with or without co-morbid conditions like hypertension, coronary artery disease, chronic kidney disease, thyroid disorders, etc., were included. Comorbid conditions were included to gather more details on the drugs prescribed for those patients. However, authors didn’t find any significance in prescriptions of oral hypoglycaemic drugs with respect to comorbidities. The patients with Type-1 diabetes mellitus, gestational diabetes mellitus and patients with insufficient data or records were excluded from the study.
The study was commenced after obtaining approval from the Scientific Research Committee and the Institutional Ethics Committee (SVMCH/IEC/2017/48). Written informed consent was obtained from all the participants. Prescriptions of old and new cases of Type-2 diabetes mellitus were collected. They were used to extract information like number of oral hypoglycaemic agents prescribed, their strength, duration, price, generic or branded, if branded-its manufacturer’s details. A specially designed case record form was used to note down the collected details. The costs of the drugs prescribed were calculated using CIMS India-2019 (Current index of medical specialities) and IDR (India Drug Review) [10,11]. Percentage cost variation was calculated using the formula [12],

Statistical Analysis
Data were analysed using SPSS Software 20.0 version and expressed in descriptive statistics. Continuous variables were expressed in mean±SD and continuous variables in percentage (n). Statistical significance among the groups (monotherapy and combination therapy) was analysed using Chi-square test to elicit the association between duration of treatment and mono/combination therapy. The p-value <0.05 was considered as statistically significant.
Results
Among the 300 Type-2 diabetic patients, males were (138) 46% and females were (162) 54%. The age group varies from 20 to 80 years. There were 122 patients in the age group of 20-50 years and 178 patients in the age group of 51-80 years. Among them, 30 (10%) patients were in the age group of 71-80 years; 67 (22.3%) patients were in the age group of 61-70 years; 81 (27%) patients between 51-60 years; 76 (25.3%) patients between 41-50 years; 43 (14.3%) were in the age group of 31-40 years and 3 (1%) between 21-30 years. Their disease duration was 47.3% with 1-5 years; 36% with 6-10 years; 8.3% of patients were between 11-15 years of disease duration; 2.3% between 16-20 years and 6% patients were diseased for more than 20 years. Family history of diabetes was present in 96 (32%) patients with the co-morbid conditions like hypertension present in 31% patients and peripheral neuropathy in 12.3% patients [Table/Fig-1].
Demographic data of diabetic patients.
| S. No. | Demographic data | No. of diabetic patients (n=300) | Percentage of diabetic patients (%) |
|---|
| 1. | Age (years) | 20-50 | 122 | 40.7 |
| 51-80 | 178 | 59.3 |
| 2. | Gender | Male | 138 | 46 |
| Female | 162 | 54 |
| 3. | Duration of disease (years) | 1-10 | 250 | 83.4 |
| 11-20 | 32 | 10.6 |
| >20 | 18 | 6 |
| 4. | Co-morbid illness | Hypertension | 93 | 31 |
| Peripheral neuropathy | 37 | 12.3 |
| Absent | 170 | 56.7 |
| 5. | Family history | Present | 96 | 32 |
| Absent | 204 | 68 |
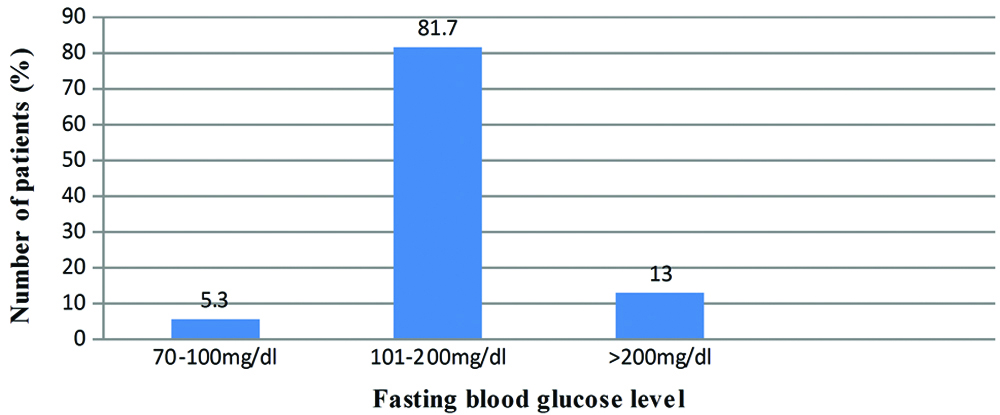
Majority of patients (81.7%) had their fasting blood glucose level between 101-200 mg/dL. Their mean fasting blood sugar level was 141+32.4 mg/dL [Table/Fig-2].
Frequency distribution of fasting blood glucose levels among diabetic patients.
Values are expressed in percentage (%).
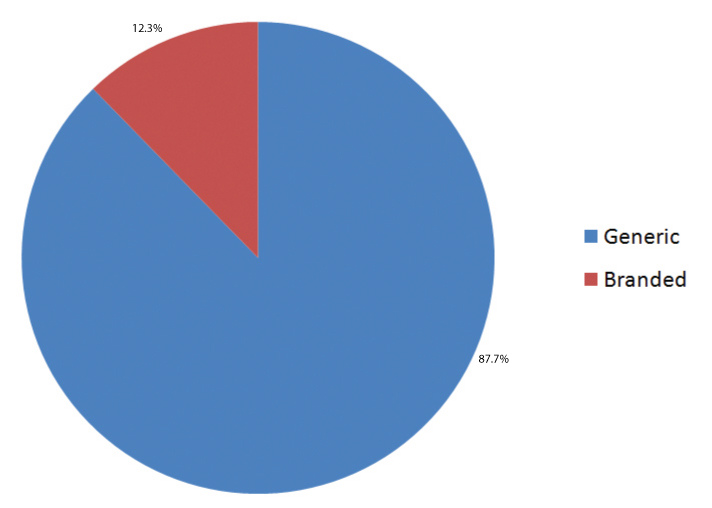
Generic drugs were prescribed for (37) 12.3% of the study patients while branded drugs for (263) 87.7% [Table/Fig-3].
Frequency distribution of generic and branded drugs among the diabetic patients.
Among the patients who had taken monotherapy, 32 (11%) patients were treated with metformin. Among the 32 patients who have prescribed metformin, 30 patients were given generic drug with average cost of around 2.75 INR per day [Table/Fig-4].
Frequency distribution of diabetic patients on monotherapy and their price variation.
| Monotherapy | No. of patients (44) | No. of patients on generic drugs | No. of patients on branded drugs | Average cost of generic drugs per day (INR) | Average cost of branded drugs per day (INR) |
|---|
| Metformin | 32 | 30 | 2 | 2.75 | 4.80 |
| Teneligliptin | 2 | 1 | 1 | 10.83 | 24 |
| Glibenclamide | 4 | 3 | 1 | 3.1 | 6.7 |
| Voglibose | 4 | 3 | 1 | 16 | 29.6 |
| Pioglitazone | 2 | 1 | 1 | 9.8 | 22 |
Among the 256 patients who had taken nine different combination therapies, most commonly prescribed combination was teneligliptin and metformin for 102 patients with lowest cost of 13.30 INR per day and maximum cost of 25.20 INR per day. A total of 33 patients were given five different brands of combination of glimepiride and metformin with the lowest cost of 8.25 INR per day and maximum cost of 22.90 INR per day. Thirty Eight patients were prescribed triple combination therapy of glimepiride, metformin and teneligliptin with the lowest cost of 19.06 INR per day and maximum cost of 20.18 INR per day. The percentage variation in cost was calculated using the above mentioned formula:
Glimepiride and metformin: (22.90–8.25/8.25)×100=177.57%
Glimepiride+Metformin+Teneligliptin: (20.18–19.06/19.06)×100=5.88%
Percentage cost variation ranges from 5.88% to 177.57% for glimepiride+metformin+teneligliptin combination and glimepiride+metformin combination respectively. The maximum price of dual combination of Metformin+Teneligliptin (INR 25.20 per day) was more when compared to the maximum price of triple drug combinations of Metformin+Glimepiride+Teneligliptin (INR 20.18 per day). The maximum price of Metformin+Glimepiride+Teneligliptin (INR 20.18 per day) was less when compared to the price of triple drug combinations of Metformin+Glimepiride+Voglibose (INR 48.80 per day). In addition Metformin+Glimepiride+Teneligliptin triple drug combinations were more economical when compared to Metformin+Glimepiride+Voglibose combinations [Table/Fig-5].
Frequency distribution of diabetic patients on combination therapy, their minimum and maximum price and its percentage variations.
| Combination therapy | No. of patients (256) | No. of brands used | Minimum price/day (INR) | Maximum price/day (INR) | Percentage cost variation (%) |
|---|
| Glimepiride+Metformin | 33 | 5 | 8.25 | 22.90 | 177.57 |
| Glicazide+Metformin | 5 | 3 | 11.71 | 29 | 147.65 |
| Glibenclamide+Metformin | 16 | 3 | 9.20 | 19 | 106.52 |
| Teneligliptin+Metformin | 102 | 2 | 13.30 | 25.20 | 89.47 |
| Sitagliptin+Metformin | 7 | 3 | 49 | 65.30 | 33.26 |
| Voglibose+Metformin | 13 | 2 | 18.48 | 36.20 | 95.89 |
| Glimepiride+Metformin+Teneligliptin | 38 | 2 | 19.06 | 20.18 | 5.88 |
| Glimepiride+Metformin+Voglibose | 22 | 3 | 32.40 | 48.80 | 50.62 |
| Metformin+Pioglitazone+Teneligliptin | 20 | 3 | 18.21 | 23.70 | 30.15 |
There were positive association between duration of disease and monotherapy/combination therapy with p-value of <0.01 [Table/Fig-6]. Patients (n=145) who had their disease duration of more than five years were prescribed combination therapy.
Association between duration of disease and monotherapy/combination therapy.
| Therapy duration of disease | Monotherapy | Combination therapy | p-value |
|---|
| <5 years | 31 | 109 | 0.003* |
| >5 years | 15 | 145 | |
Analysis was done using Chi-square test to compare monotherapy/combination therapy with duration of disease. *p-value <0.01
Discussion
India with 82 million diabetic patients, have an enormous consumption of oral hypoglycaemic drugs with major concern on their cost of the therapy. One study has addressed this issue in south India in 2015, but since then many new combinations of drugs have come up in Indian market and there has been a price control strategy adopted by the government of India. Hence, the latest information about the cost variations in the diabetic medications available in Indian market has to be gathered, analysed and dispersed to the practicing physicians in order to decrease the economic burden of Type-2 diabetic patients. This study has analysed the pattern of oral hypoglycaemic drugs usage, their cost, different combination therapies and percentage of cost variation in Type-2 diabetic patients. Among the 300 Type-2 diabetic patients, ratio of male and female population were 46 and 54, with a female preponderance which is similar to the study done by Satpathy SV et al., and Sutharson L et al., with a ratio of 52.3 and 56.6 respectively in females [13,14].
The majority of the patients (74.6%) were in the age group of 41-70 years as supported by Kannan et al., who showed a higher incidence of diabetes in the age group of 41-70 years (85.15%) and another study done by Satpathy SV et al., showed that 71.3% of patients were above the age of 50 years [13,15]. Higher prevalence in this age group may be attributed to the change in life style, lack of physical activity and stress. Disease duration of most of the study patients (83.4%) were between 1-10 years which is similar to Upadhyay DK et al., where 92.86% patients had their disease duration between 1-10 years [16]. Co-morbid conditions like hypertension and peripheral neuropathy were found in 31% and 12.3% of patients in this study. Consistent with these findings, previous study done by Sultana G et al., have shown hypertension in 49.5% of the study patients [17].
Family history of diabetes was observed in 32% of diabetic patients, whereas few other studies have shown that 69.3% and 41.3% of patients had family history of diabetes respectively [15,18]. Mean fasting blood sugar level was 141+32.4 mg/dL similar to Sultana G et al., who showed that the mean fasting blood glucose was 162.8+76.7 mg/dL among the Type-2 diabetes patients [17].
Studies done by Acharya KG et al., and Kumar MA et al., showed that majority of drugs were prescribed in their brand names whereas only few drugs were prescribed in its generic name [19,20]. This finding is analogous to this present study where generic drugs were prescribed for 12.3% of patients while branded drugs for 87.7% of patients. Though regulatory authorities in India recommend prescribing generic medicines, still there is a tendency in prescribing branded drugs for Type-2 diabetes mellitus. In the present study, out of the 300 diabetic patients, 85.4% were on combination therapy while 14.6% patients were on monotherapy which is in accordance with the study done by Ashutosh K et al., where 30% of patients were treated with monotherapy and 70% were treated with combination therapy [21]. Sivasankari V et al., also showed that monotherapy was given for 21.7% and combination therapy for 78.3% of patients [9].
Thus, it is evident that most Type-2 diabetic patients were prescribed branded combination therapy which may offer a better diabetic control and improve the patient compliance. Combination therapy proved to prevent the long term diabetic complication with good glycaemic control. Statistical significant association (p<0.01) between duration of disease and monotherapy/combination therapy was observed in the present study. Patients who had their disease duration of more than five years were prescribed combination therapy rather than a monotherapy, which is in accordance with Satpathy SV et al., [13].
Among the patients who were prescribed with monotherapy (44), 32 (72.7%) patients were treated with metformin. Metformin was also economical with a per day cost of INR. 2.75 as per this study results. Similarly studies done by Acharya KG et al., and Ashutosh K et al., shows that 40.4% and 41% of patients were prescribed metformin as monotherapy respectively [19,21]. Alex SM et al., has found that the most commonly used monotherapy was metformin and the trend in prescribing oral hypoglycaemic drugs appeared to be moving towards combination therapy now, as indicated by combination therapy among 85.4% of patients in the present study [22].
The most commonly prescribed combination therapy was metformin and teneligliptin for 39.8% patients followed by triple drug combination therapy of metformin, glimepiride and teneligliptin in 14.8% patients. This result corresponds to Ashutosh K et al., where combination therapy of metformin and vildagliptin among 37% of patients [21]. Previous studies done by Satpathy SV et al., and Vengurlekar S et al., have shown that metformin and sulfonylureas as the most commonly prescribed combination therapy [13,23].
While comparing the cost variation among the different combinations, the commonly prescribed drugs were teneligliptin and metformin with the estimated lowest cost of 13.30 INR per day and maximum cost of 25.20 INR per day followed by the triple drug combination therapy of metformin, glimepiride and teneligliptin with the lowest cost of 19.06 INR per day and maximum cost of 20.18 INR per day. However, the combination of Glimepiride and metformin was with the lowest cost of 8.25 INR per day and maximum cost of 22.90 INR per day. Thus, combination of Glimepiride and metformin can be considered as the most economical one and also the most preferred combination therapy which is also supported by Satpathy SV et al., [13]. The percentage cost variation was estimated for different brands prescribed. Glimepiride+Metformin+Teneligliptin combination had the least percentage cost variation i.e., 5.88% whereas Glimepiride+Metformin combination had highest percentage cost variation i.e., 177.57%. This finding suggests more availability of branded drug combinations of Metformin+Glimepiride. Similar result was obtained by Jadhav NB et al., who showed that increase in the number of brands of a particular drug will show increase in percentage variation of cost [6].
The maximum price of dual combination of Metformin+Teneligliptin (INR 25.20 per day) is more when compared to the maximum price of triple drug combinations of Metformin+Glimepiride+Teneligliptin (INR 20.18 per day). Also, the maximum price of Metformin+Glimepiride+Teneligliptin (INR 20.18 per day) was less when compared to the maximum price of triple drug combinations of Metformin+Glimepiride+Voglibose (INR 48.80 per day). But Gliptins and combinations of Gliptins are being projected as a costly oral hypoglycaemic drug, since the introduction of Gliptins. This study results have shown that Metformin+Glimepiride+Teneligliptin triple drug combinations are more economical when compared to Metformin+Glimepiride+Voglibose triple drug combinations.
Thus, the total cost of treatment can be reduced markedly by using generic combinations or the cheapest combination brand of Glimepiride+Metformin. The prescriber should avoid writing the costliest brand of Glimepiride+Metformin in order to curtail the total cost of drug therapy and improve the drug compliance in diabetic patients.
With shortage of information on comparative drug prices and quality, it is difficult for physicians to prescribe the most economical prescription. Thus, physicians could reduce the costs of drugs if information about drug prices are readily available. Hence, there is a need for immediate action from regulatory authorities, doctors and pharmacists to address this issue of oral hypoglycaemic drugs price variation which can be improved by incorporating an analysis of prescription costs in the medical curriculum. This could provide the updated and complete information regarding cost of the pharmaceutical preparation to the doctors with universal health care coverage. Wherever, possible generic drugs are to be prescribed or a cheaper brand should be wisely prescribed to reduce the economical burden of diabetic patients. Most of the studies on cost-analyses of oral hypoglycaemic drugs had excluded the generic drugs, whereas authors have analysed the cost of generic as well as branded drugs. This was the first of its kind study conducted in Puducherry and the information obtained will be useful for economical prescription by the treating physicians from the available hospital drug formulary.
Limitation
Since it is a single centered hospital based study with a small sample size with short duration the results cannot be generalised. Future cost analysis studies in multiple educational centres and at community level in India is warranted to arrive at the exact depiction of the economic burden of Type-2 diabetic patients.
Conclusion
It was observed from this study results that there exists a wide variation in cost of different drugs manufactured in India by the pharmaceutical companies. Hence, it has become necessary for regulatory authorities to regulate the wide variation that exists among the drug cost, in order to maximise the benefit of the treatment. The pattern of prescription and cost of the drugs per prescription analysed in this study will be useful to the Clinicians to choose most economic drugs without change in quality of treatment in diabetic patients. This study has highlighted Metformin as the most commonly used economic monotherapy and economic combination therapy was Glimepiride+Metformin.
Disclaimer
The present authors do not intend to sponsor or disapprove any of the drug brands if mentioned in the study.
Analysis was done using Chi-square test to compare monotherapy/combination therapy with duration of disease. *p-value <0.01