Introduction
Bisphenol A is an industrial chemical used in the production of polycarbonate plastics and epoxy resins, used in protective coatings and linings of metal products such as food and beverage cans. [1,2].
Profound adverse health effects were thought to be associated with BPA, and consequently it was banned in production of infant related items such as feeding baby bottles [3]. Findings of recent studies provide evidence on the harmful effects of endocrine-disruptors chemical, BPA [4]. A recent review of literature enlisted the probable hazardous sources of BPA, that were a subject of research conflict however additional studies are required to confirm the association between BPA exposure and human development and metabolism disorders [5].
Various studies also report that children are more prone to adverse effects of BPA in their environment as their eating, drinking and breathing aspects are much higher in relation to per unit of their body weight [6,7]. Frequent use of BPA incorporated products and exploration of things orally also increases their exposure to BPA [8].
Dietary ingestion of BPA has been reported as the most important source of exposure in humans where it is metabolised in the liver and excreted through the urine [9]. The assessment of urinary BPA is considered as the most convenient indicator of exposure owing to the fact that BPA has a rapid metabolism and are instantly excreted through the urine [10].
Based on previous data, the objective of this study was to assess the exposure of BPA in a sample of Egyptian children, by measuring the urinary concentration and to investigate its association with frequency of consumption of potential dietary sources.
Materials and Methods
Study Population
The observational cross-sectional study was conducted from October 2012 to October 2014, on 292 apparently healthy children of the age group 2-16 years, who were randomly selected from nearby nurseries, primary, and preparatory schools in Giza, Egypt. Previous studies revealed that BPA was detected in about 90%-100% of children and adolescents in Northern America, some European nations, Egypt, Australia, and Asian countries [6,11-20]. The rate of detection was higher in the younger age groups as in toddlers and preschoolers.
For sample size calculation, the prevalence was considered 95% in the preschool children, 93% in the primary school children and 90% in the adolescents.
Sample size was calculated using the equation published by Dawson-Saunders and Trapp, 1994: [21].
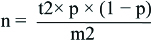
where n=required sample size, t=confidence level at 95% (standard value of 1.96), p=estimated prevalence of the problem in the study area, m=margin of error at 5% (standard value of 0.05). Apparently healthy children, not complaining of chronic disease were included in the study. Children with a history of liver, renal disease or thyroid disorders were excluded from the study.
Ethical Considerations
Ethical approval was obtained from The Medical Research Ethical Committee of the National Research Center (NRC) (Registration no. 16368), the Egyptian Ministry of Education and the directors of schools that participated in the research. Informed written consent were obtained from the parents and verbal consents from all the students involved in the study.
Each child and/or parent enrolled in the study was subjected to:
Filling out a structured questionnaire which included
Assessment of frequency intake of possible BPA dietary sources: Specific food frequency questionnaires which included the monthly ingestion of canned food and beverage e.g. canned fruits, vegetables, soft drinks and fast food
Assessment of certain hazardous habits: These included the storage of food and water in plastic boxes or jars, the usage of plastic microwave utensils, the reuse of plastic water bottles and drinking water from plastic tanks.
Physical examination: Children were subjected to measurement of weight and height and thorough clinical examination that included chest, heart, abdominal, and central nervous system examination.
Laboratory investigations: Each child gave a morning spot urine sample which stored at -70 until assays for:
Estimation of urinary BPA concentration: The concentration of total urinary BPA was determined by reverse phase HPLC, Agilent technologies 1100 series, (G131A model), according to the method described by Alkaranfilly et al., and modified by Mohsen et al., [22,23]. Serial dilutions of standards were injected onto HPLC coloumn and their peak areas were determined using florescent detector was set at 275 and 300 (excitation and emission). The concentration in samples were calculated from the standard curve constructed by plotting peak areas versus the corresponding concentrations using Agilent Chem Station software for LC and LC/MC system (Agilent Technologies). The limit of detection (LOD) was calculated with the method recommended by EPA [24]. The LODs of BPA in urine was 0.3 ng/mL.
Determination of urinary creatinine was done according to the method of Bartel, by using kinetic kit (BioMed-Creatinine, CAT NO.CRE 106120) [25]. BPA concentration was adjusted to the urinary creatinine concentration to correct for the urine dilution [26].
Statistical Analysis
Daily intakes of BPA were estimated by calculating: daily intake (ng/day)=urinary BPA concentration (ng/mL)×urinary output (mL/day) and daily intake (ng/kg body weight/day)=urinary BPA concentration (ng/mL)×urinary output (mL/day)/body weight (kg) [27]. For practical reasons, no 24 h urine excretion rates were collected for the children. Therefore, generic values based on age and gender was used to describe urinary output [28,29]. The daily intake was estimated for a children ≤10 years In accordance to the International Commission of Radiological Protection (ICRP) with reference value for the >12 years age group (1200 mL/day) and the ICRP value for children aged ≤11 years age group (700 mL/day).
Data analysis was performed using Statistical Package for the Social Science (SPSS) version 21 (SSPS Inc, Pennsylvania, USA). Continuous data were expressed as mean±SD, while categorical data were expressed as frequencies and percentages. ANOVA test was used to analyse the statistical difference between the estimated levels of urinary BPA and the frequency of consumption of the dietary sources. Students’ t-test was used to estimate the statistical difference between male and female children as regard to daily intake of BPA. Urinary BPA and BPA/Creatinine levels were log-transformed to improve normality of the distribution. p-value was considered statistically significant at p<0.05.
Results
In this study, 292 2-16 years old children were recruited (175 males represented 59.9% and 117 females represented (40.1%), and classified into three age categories [Table/Fig-1].
Characteristics of the participants under study.
| Characteristic | Number of individuals | Percentage |
|---|
| Sex |
| Male | 175 | 59.9 |
| Female | 117 | 40.1 |
| Age categories |
| Age 2 - <6 years | 63 | 21.6 |
| Age 6 - <12 years | 95 | 32.5 |
| Age >12 years | 134 | 45.9 |
Descriptive statistics to categorise the study population into 3 age categories
The detection rate of BPA among our study subjects was 73.7%. The total urinary BPA concentration ranged from 0.3 to 18.9 ng/mL with a mean value of 1.29. The mean Log BPA/gm creatinine of males, females and of the whole sample were 2.649±0.585, 2.640±0.494 and 2.64+0.55 with no significant difference (p>0.05) [Table/Fig-2].
Urinary BPA concentrations of children and adolescents.
| Parameter | Mean (SD) | Median | Geometric mean |
|---|
| Total BPA [ng/mL of urine] | 1.29 (2.09) | 0.67 | 0.68 |
| Log total BPA | -0.1680 (0.47) | -0.1739 | 0.000 |
| Total BPA/gm creatinine | 1046.687 (2041.65) | 415.14 | 441.45 |
| Log BPA/gm creatinine | 2.64 (0.55) | 2.62 | 2.59 |
Descriptive statistics of central tendency of urinary BPA concentrations [Mean, median and geometric mean]
Average daily intake of BPA was estimated based on individual urinary BPA data and individual body weight data. The mean, median and geometric mean equal 0.035, 0.014, and 0.015 (μg/kg/day) respectively as shown in [Table/Fig-3]. Estimated BPA intakes show no significant difference between males and females (p-value=0.216).
Average daily intake of BPA in males, females and total children and adolescents depending on the level of urinary BPA.
| BPA daily intake (ug/kg/day) | Mean (SD) | Median | Geometric mean | p-value |
|---|
| Males | 0.041 (0.092) | 0.014 | 0.016 | |
| Females | 0.026 (0.035) | 0.015 | 0.015 | |
| Total sample | 0.035 (0.073) | 0.014 | 0.015 | |
Students’ t-test. *p<0.05 statistically significant.
The associations between the estimated level of urinary BPA and frequency of consumption of the expected dietary sources of BPA were studied. Higher consumption of canned soft drinks (once or more/week) was found to be significantly associated with the mean of urinary BPA (p-value >0.036). This association is constant even after adjustment of urinary BPA to creatinine level (p-value >0.014). The same significant association was observed with frequent consumption of fast food (p-value >0.023) but it became non-significant after adjustment for creatinine (p-value >0.059). Consumption of other types of canned food or storage of water or food in plastic utensils showed no association (p-value=0.05) with the level of urinary BPA [Table/Fig-4].
The estimated level of urinary BPA and frequency of consumption of the expected dietary sources of BPA.
| Potential dietary sources | Frequency of consumption | Log10 BPA | Log10 BPA/g creatinine |
|---|
| Mean±SD | p-value | Mean±SD | p-value |
|---|
| Fast food | Never | 0.037±0.508 | 0.023* | 2.712±0.614 | 0.059 |
| Once/month | 0.041±0.509 | 2.840±0.533 |
| 2-3 times/month | 0.110±0.526 | 2.666±0.649 |
| Once or more/week | 0.290*±0.399 | 2.528±0.460 |
| Soft drink cans | Never | 0.092±0.505 | 0.036* | 2.716±0.595 | 0.014* |
| Once/month | 0.172±0.455 | 2.817±0.747 |
| 2-3 times/month | 0.106*±0.537 | 2.551*±0.471 |
| Once or more/week | 0.229*±0.438 | 2.975*±0.576 |
| Tuna cans | Never | 0.135±0.507 | 0.834 | 2.672±0.616 | 0.864 |
| Once/month | 0.121±0.439 | 2.698±0.548 |
| 2-3 times/month | 0.077±0.561 | 2.711±0.564 |
| Once or more/week | 0.216±0.445 | 2.583±0.509 |
| Legume cans | Never | 0.143±0.474 | 0.742 | 2.656±0.536 | 0.872 |
| Once/month | 0.303±0.501 | 2.630±0.476 |
| 2-3 times/month | 0.057±0.081 | 2.931±0.113 |
| Once or more/week | 0.043±0.567 | 2.762±0.663 |
| Processed meat cans | Never | 0.095±0.482 | 0.203 | 2.746±0.550 | 0.061 |
| Once/month | 0.266±0.360 | 2.535±0.390 |
| 2-3 times/month | 0.361±0.578 | 2.328±0.600 |
| Once or more/week | 0.236±0.390 | 2.465±0.440 |
| Jam cans | Never | 0.142±0.461 | 0.400 | 2.666±0.512 | 0.608 |
| Once/month | 0.283±0.374 | 2.610±0.556 |
| 2-3 times/month | 0.066±0.592 | 2.827±0.764 |
| Once or more/week | 0.263±0.714 | 2.458±0.638 |
| Vegetable or fruit cans | Never | 0.190±0.450 | 0.173 | 2.610±0.516 | 0.062 |
| Once/month | 0.051±0.189 | 2.990±0.502 |
| 2-3 times/month | 0.041±0.648 | 2.616±0.591 |
| Once or more/week | 0.210±0.397 | 2.685±0.521 |
| Drinking water stored in water tanks | No | 0.124±0.461 | 0.202 | 2.682±0.514 | 0.485 |
| Yes | 0.259±0.484 | 2.592±0.599 |
| Reused water bottles | No | 0.105±0.558 | 0.537 | 2.759±0.684 | 0.249 |
| Yes | 0.163±0.443 | 2.632±0.475 |
| Store food in plastic box | No | 0.178±0.492 | 0.534 | 2.620±0.508 | 0.416 |
| Yes | 0.129±0.452 | 2.695±0.544 |
| Use of plastic utensils in microwave | No | 0.143±0.472 | 0.808 | 2.666±0.529 | 0.868 |
| Yes | 0.180±0.388 | 2.698±0.505 |
ANOVA test, *p<0.05 statistically significant
Discussion
The frequent use of plastic products increases the probability of human exposure to the endocrine disrupting agent, BPA. The human exposure can be evaluated through measurement of urine concentrations, as BPA which is eliminated in urine after quick metabolism in the human body [30].
In this study the detection rate of BPA among our study subjects was 73.7%. This rate was lower than that seen among American (92.6%), Canadian (91%) and German (98.7%) populations, but was higher than the rate reported in the Chinese cohort (50%)] [6,11,15, 31].
The total urinary Bisphenol A ranged from 0.3 to 18.9 ng/mL with a mean value of 1.29 (+2.09), median 0.67 and geometric mean (GM) of 0.68 ng/mL. Our findings were similar to Nahar MS et al., study on Egyptian girls (aged 10-13 years) with the GM 0.84 ng/mL [19]. These findings were in contrast with an Australian study on 0-15 years old children, where GM of urinary BPA was 2.57 ng/mL, i.e. more than the triple of our GM value [32]. In a larger European study on 5-12 years children recruited from six different European countries, the GM of urinary BPA was 1.97 μg/L which is also much higher than the measured GM in our study [33]. These variations in the urinary BPA concentrations between countries can be attributed to timing of urine collection, preparation of urine dilution, method of analysis, age, sex and genetic make-up of individuals. Socio-economic background and lifestyle choices including food storage and consumer product use also influence the BPA concentration [34,35]. Therefore, examining behavioral and dietary habits are essential to determine potential exposure pathways and effects of BPA on individual’s health.
The frequent use of products containing BPA such as baby bottles and toys, and consumption of packaged products such as canned foods, increases the potential risk of exposure in children and adolescents. The adverse health effects of BPA exposure in young children is a major concern since they are still undergoing development [36]. In the current study, no significant difference was found in BPA concentration between females and males, which was similar to the results from several other studies [6,11,37-39]. BPA exposure did not vary significantly by sex, suggesting that the probability of exposure to BPA is highly ubiquitous among the children population. It also reflects the likelihood of multiple routes of exposure, including both food and non-food sources. Therefore, identifying the sources of BPA exposure is essential for determining the high-risk populations and for devising strategies for reducing exposure [40].
Dietary intake is considered as the predominant exposure pathway for BPA in humans [41]. Dietary exposure remains a major concern in infants, toddlers and children, who have a significantly higher intake ratio for their body weight [42]. The advancement in food technology, and use of chemicals such as bisphenol A [BPA] in food processing and packaging, leads to increased human exposure.
The frequency of consumption of soft drink and canned fast food were found to be significantly associated with urinary BPA concentrations. This result was in accordance with National Health and Nutrition Examination Survey (NHANES) data that reports association between elevated BPA levels and frequent consumption of take away meals, sodas, soft drinks and fast-food items [43-45]. In a 2013 study, Quiros-Alcala et al., reported that pregnant women who consumed higher amount of soft drinks and hamburgers showed 58% and 20% higher urinary BPA concentrations respectively, in comparison with those who did not consume either [45]. However, a cross-sectional study on US population reported a non-significant, correlation between consumption of fast food and BPA levels [46].
In the current study, there was a tendency but no significant association between consumption of canned vegetables and canned fruit and BPA. While some studies reported a significant positive association between urinary BPA concentrations and frequent consumption of canned vegetable [47,48]. This relative contribution of canned vegetables to total BPA concentration that varies depending upon the canning process, food variety, type of resin used, and frequency of consumption.
In our study, no significant association between urinary BPA concentrations and canned food such as tuna, legume, and tomato paste and processed meats was observed. These findings were similar to Fattore M et al., study that reported that bottled water and canned tuna consumption has no association to elevated urinary BPA [49]. Casas M et al., also reported that, consumption of canned food had non-significant association with urinary BPA concentration in children However, in the same study reported a significant positive association between urinary BPA concentrations and canned fish consumption in Spanish women [16].
BPA can migrate from consumer goods into food and has been detected in canned foods [50]. Both heat-sterilisation of the container and acidity levels of the contents determine the rate of BPA migration. Polycarbonate-based materials and epoxy resins that contain BPA are usually applied in the production of food packaging materials, as well as the internal coatings of food and beverage cans [51]. Furthermore, BPA migration is effected by the preservation medium used. Significantly higher BPA levels were observed in canned tuna preserved in oil as compared to tuna preserved in aqueous medium, suggesting that oil aid in BPA migration from the can lining into the food [52].
Some of the most common hazardous habits were also assessed to determine their impact on BPA levels. In our study, there was no significant association between urinary BPA concentrations between reused water bottles, food stored in plastic boxes, consumption of water drinking from tanks and use of microwave utensils was observed. Similarly, no association was observed between urinary BPA and the consumption of food stored in plastic containeror the use of plastic bottles [16,42]. But in some studies, significant positive associations was observed between urinary BPA concentrations and use of polycarbonate bottle, storage of food in plastic containers and microwave containers [53,54]. Azza A et al., also reported excessive use of plastic bottles, microwave plastic wares and consumption of canned food presented as the sources of increased exposure in high social class Egyptian children [55].
Numerous studies suggest, dietary intake as a major source of BPA exposure [42,56]. Daily intake calculations based on biomonitoring data (e.g., urine) reflect real exposure, from all the probable sources of exposure [57]. The European Food Safety Authority (EFSA) has set a Tolerable Daily Intake (TDI) for BPA of 50 μg/kg bw/day [58]. The TDI is known as “an estimate of the quantity of a chemical contaminant to which we may be exposed through environmental contamination, and which when found in food can be ingested daily over a lifetime without posing a significant risk to health”. Based on new data and methodologies, EFSA has lowered the estimated TDI, to 4 μg/kg bw/day [59]. Further in 2013, the National Food Institute, Technical University of Denmark (DTU) has evaluated the EFSA opinion, and reported revised permissible TDI for BPA to be 0.7 μg/kg bw/day or lower [60]. The estimated daily intake geometric mean of BPA in our study was 0.015 (μg/kg.bw/day) (15 ng/kg bw/day), median 0.014 (μg/kg bw/day) (14 ng/kg.bw/day) which was much lower than the tolerable daily intake recommended by the guidelines established by the EFSA and DTU. This indicated that Egyptian children and adolescents are in a safe level of BPA exposure.
Limitation
The study provides initial information on levels of BPA and its association with probable sources of exposure. Further studies on larger sample size of both children and infants are required.
Conclusion
Urinary Bisphenol A concentrations and average daily intake of BPA exhibited low values in a sample of Egyptian children indicating low exposure. A positive association was found between canned soft drinks, fast food consumption and urinary BPA. These results emphasised on the need for additional studies to address other potential sources of BPA exposure, and the probable associated adverse health outcome in children.
Descriptive statistics to categorise the study population into 3 age categories
Descriptive statistics of central tendency of urinary BPA concentrations [Mean, median and geometric mean]
Students’ t-test. *p<0.05 statistically significant.
ANOVA test, *p<0.05 statistically significant
[1]. CDC [Centers for Disease Control and Prevention]. 2010. Fourth National Report on Human Exposure to Environmental Chemicals. Washington, DC:CDC [Google Scholar]
[2]. Vandenberg LN, Maffini MV, Sonnenschein C, Rubin BS, Soto AM, Bisphenol-A and the Great Divide: A Review of Controversies in the Field of Endocrine DisruptionEndocr Rev 2009 30:75-95.10.1210/er.2008-002119074586 [Google Scholar] [CrossRef] [PubMed]
[3]. US Food and Drug Administration [FDA]. Memorandum. 2014 updated safety assessment of Bisphenol A [BPA] for use in food contact applications. 17 June 2014. Available https://www.fda.gov/downloads/NewsEvents/PublicHealthFocus/UCM424266.pdf. [Accessed on 19th May 2018] [Google Scholar]
[4]. Gore AC, Chappell VA, Fenton SE, Flaws JA, Nadal A, Prins GS, Toppari J, Zoeller RT, “Executive Summary to EDC-2: The Endocrine Society’s Second Scientific Statement on Endocrine-Disrupting Chemicals”Endocr. Rev 2015 36(6):593-602.10.1210/er.2015-109326414233 [Google Scholar] [CrossRef] [PubMed]
[5]. Giulivo M, Lopez de Alda M, Capri E, Barceló D, “Human exposure to endocrine disrupting compounds: Their role in reproductive systems, metabolic syndrome and breast cancer. A review”Environ Res [Review] 2016 151:251-264.10.1016/j.envres.2016.07.01127504873 [Google Scholar] [CrossRef] [PubMed]
[6]. Calafat AM, Ye X, Wong LY, Reidy JA, Needham LL, Exposure of the U.S. population to bisphenol A and 4-tertiary-octylphenol: 2003-2004Environ Health Perspect 2008 116:39-44.10.1289/ehp.1075318197297 [Google Scholar] [CrossRef] [PubMed]
[7]. Vandenberg LN, Chahoud I, Heindel JJ, Urinary, circulating, and tissue biomonitoring studies indicate widespread exposure to bisphenol AEnviron Health Perspect 2010 118(8):1055-70.10.1289/ehp.090171620338858 [Google Scholar] [CrossRef] [PubMed]
[8]. Shelby MD, NTP-CERHR monograph on the potential human reproductive and developmental effects of bisphenol ANTP CERHR MON 2008 (22):v:vii-64. [Google Scholar]
[9]. Cichna-Markl M, Sample clean-up by sol-gel immunoaffinity chromatography for the determination of bisphenol A in food and urineMethods 2012 56(2):186-91.10.1016/j.ymeth.2011.08.01121871961 [Google Scholar] [CrossRef] [PubMed]
[10]. Koch HM, Calafat AM, Human body burdens of chemicals used in plastic manufacturePhilosophical Transactions of the Royal Society of London B: Biological Sciences 2009 364(1526):2063-2078.10.1098/rstb.2008.020819528056 [Google Scholar] [CrossRef] [PubMed]
[11]. Bushnik T, Haines D, Levallois P, Levesque J, van Oostdam J, Viau C, Lead and bisphenol A concentrations in the Canadian populationHealth Rep 2010 21:07-18. [Google Scholar]
[12]. Pirard C, Sagot C, Deville M, Dubois N, Charlier C, Urinary levels of bisphenol A, triclosan and 4-nonylphenol in a general Belgian populationEnviron Int 2012 48:78-83.10.1016/j.envint.2012.07.00322885664 [Google Scholar] [CrossRef] [PubMed]
[13]. Frederiksen H, Nielsen JK, Morck TA, Hansen PW, Jensen JF, Nielsen O, Urinary excretion of phthalate metabolites, phenols and parabens in rural and urban Danish mother-child pairsInt J Hyg Environ Health 2013 216:772-83.10.1016/j.ijheh.2013.02.00623528233 [Google Scholar] [CrossRef] [PubMed]
[14]. Frederiksen H, Aksglaede L, Sorensen K, Nielsen O, Main KM, Skakkebaek NE, Bisphenol A and other phenols in urine from Danish children and adolescents analyzed by isotope diluted TurboFlow-LC-MSMSInt J Hyg Environ Health 2013 216:710-20.10.1016/j.ijheh.2013.01.00723491025 [Google Scholar] [CrossRef] [PubMed]
[15]. Becker K, Goen T, Seiwert M, Conrad A, Pick-Fuss H, Muller J, GerES IV: phthalate metabolites and bisphenol A in urine of German childrenInt J Hyg Environ Health 2009 212:685-92.10.1016/j.ijheh.2009.08.00219729343 [Google Scholar] [CrossRef] [PubMed]
[16]. Casas M, Valvi D, Luque N, Ballesteros-Gomez A, Carsin AE, Fernandez MF, Dietary and sociodemographic determinants of bisphenol A urine concentrations in pregnant women and childrenEnviron Int 2013 56:10-8.10.1016/j.envint.2013.02.01423542682 [Google Scholar] [CrossRef] [PubMed]
[17]. Zhang Z, Alomirah H, Cho HS, Li YF, Liao C, Minh TB, Urinary bisphenol A concentrations and their implications for human exposure in several Asian countriesEnviron Sci Techno1 2011 45:7044-50.10.1021/es200976k21732633 [Google Scholar] [CrossRef] [PubMed]
[18]. Ha M, Kwon HJ, Leem JH, Kim HC, Lee KJ, Park I, Korean Environmental Health Survey in Children and Adolescents [KorEHS-C]: survey design and pilot study results on selected exposure biomarkersInt J Hyg Environ Health 2014 217:260-70.10.1016/j.ijheh.2013.06.00123831304 [Google Scholar] [CrossRef] [PubMed]
[19]. Nahar MS, Soliman AS, Colacino JA, Calafat AM, Battige K, Hablas A, Urinary bisphenol A concentrations in girls from rural and urban Egypt: a pilot studyEnviron Health 2012 11:2010.1186/1476-069X-11-2022472083 [Google Scholar] [CrossRef] [PubMed]
[20]. Heffeman AL, Aylward LL, Toms LM, Eaglesham G, Hobson P, Sly PD, Age related trends in urinary excretion of bisphenol A in Australian children and adults: evidence from a pooled sample study using samples of convenienceJ Toxicol Environ Health. Part A 2013 76:1039-55. [Google Scholar]
[21]. Dawson-Saunders B, Trapp RG, Basic and clinical biostatistics 1994 2nd edition [Google Scholar]
[22]. Alkaranfilly GA, Hashem AA, Ahmed HH, Hussein JS, Sharawy A, The impact of some Bisphenol-A based restorative materials on the estrogen receptors activityJournal of Chemical and Pharmaceutical Research 2015 7(2):52-61. [Google Scholar]
[23]. Manal A Mohsen, Safaa T Zaki, Mai M Youssef, Ebtissam M Salah El-Din, Mones M Abu Shady, Jihan Hussein, May Detectable urinary Bisphenol A among children be associated with cardiovascular risk factor?Bioscience Research 2018 15(2):1243-50. [Google Scholar]
[24]. EPA, 2004. EPA (United States Environmental Protection Agency) revised assessment of detection and quantization approaches. EPA- 821-B-04-005 [Google Scholar]
[25]. Bartels H, Böhmer M, Heierli , Serum creatinine determination without protein precipitationClin Chim Acta 1972 37:193-97.10.1016/0009-8981(72)90432-9 [Google Scholar] [CrossRef]
[26]. Barr DB, Wilder LC, Caudill SP, Gonzalez AJ, Needham LL, Pirkle JL, Urinary creatinine concentrations in the U.S. population implications for urinary biologic monitoring measurementsEnviron Health Perspect 2005 113:192-200.10.1289/ehp.733715687057 [Google Scholar] [CrossRef] [PubMed]
[27]. Lakind JS, Naiman DQ, Bisphenol A (BPA) daily intakes in the United States: estimates from the 2003-2004 NHANES urinary BPA dataJ Expo Sci Environ Epidemiol 2008 18:608-615.10.1038/jes.2008.2018414515 [Google Scholar] [CrossRef] [PubMed]
[28]. Valentin J, Basic anatomical and physiological data for use in radiological protection: reference values: ICRP Publication 89Ann ICRP 2002 32:5-265.10.1016/S0146-6453(03)00002-2 [Google Scholar] [CrossRef]
[29]. ICRP. ICRP Publication 89. Basic Anatomical and Physiological Data for Use in Radiological Protection: Reference Values. Elsevier. 2003 pp 280 [Google Scholar]
[30]. Geens T, Aerts D, Berthot C, Bourguignon JP, Goeyens L, Lecomte P, A review of dietary and non-dietary exposure to bisphenol-AFood and Chemical Toxicology 2012 50(10):3725-40.10.1016/j.fct.2012.07.05922889897 [Google Scholar] [CrossRef] [PubMed]
[31]. He Y, Miao M, Herrinton LJ, Bisphenol A levels in blood and urine in a Chinese population and the personal factors affecting the levelsEnviron Res 2009 109:629-33.10.1016/j.envres.2009.04.00319426969 [Google Scholar] [CrossRef] [PubMed]
[32]. Covaci A, Den Hond E, Geens T, Urinary BPA measurements in children and mothers from six European member states: Overall results and determinants of exposureEnvironmental Research 2015 141:77-85.10.1016/j.envres.2014.08.00825440295 [Google Scholar] [CrossRef] [PubMed]
[33]. CDC [Centers for Disease Control and Prevention, Atlanta, GA], 2012. Fourth National Report on Human Exposure and Environmental Chemicals, updated tables, February 2012, pp. 1-241 [Google Scholar]
[34]. Volkel W, Bittner N, Dekant W, Quantitation of bisphenol A and bisphenol A glucuronide in biological samples by high performance liquid chromatography-tandem mass spectrometryDrug Metab Dispos 2005 33(11):1748-57.10.1124/dmd.105.00545416103135 [Google Scholar] [CrossRef] [PubMed]
[35]. CERHR (Center for the Evaluation of Risks to Human Reproduction) NTP-CERHR Expert Panel Report on the Reproductive and Developmental Toxicity of Bisphenol A. 2007 [Google Scholar]
[36]. Yamano Y, Miyakawa S, Iizumi K, Itoh H, Iwasaki M, Tsugane S, Long-term study of urinary bisphenol A in elementary school childrenEnviron Health Prev Med 2008 13(6):332-37.10.1007/s12199-008-0049-619568893 [Google Scholar] [CrossRef] [PubMed]
[37]. Gao C, Liu L, Ma W, Zhu N, Bisphenol A in Urine of Chinese Young Adults: Concentrations and Sources of ExposureBulletin of Environmental Contamination and Toxicology 2016 96(2):162-167.10.1007/s00128-015-1703-526679324 [Google Scholar] [CrossRef] [PubMed]
[38]. Chang F, Shiea J, Tsai H, Urinary Concentrations of Triclosan, Benzophenone-3, and Bisphenol A in Taiwanese Children and AdolescentsInt J Environ Res Public Health 2017 14(12):154510.3390/ijerph1412154529232866 [Google Scholar] [CrossRef] [PubMed]
[39]. Braun JM, Yolton K, Dietrich KN, Hornung R, Ye X, Calafat AM, Prenatal bisphenol A exposure and early childhood behaviorEnviron Health Perspect 2009 117:1945-195.10.1289/ehp.090097920049216 [Google Scholar] [CrossRef] [PubMed]
[40]. Christensen K, Lorber M, Koslitz S, Brüning T, Koch HM, The contribution of diet to total bisphenol A body burden in humans: results of a 48 hour fasting studyEnviron Int 2012 50:07-14.10.1016/j.envint.2012.09.00223026348 [Google Scholar] [CrossRef] [PubMed]
[41]. Landrigan PJ, Garg A, Children are not little adults. In: Pronezuk-Garbino J (ed)Chidren’s Health and the Environment: A Global Perspective 2005 1st ednGenevaWorld Health Organization:3-17. [Google Scholar]
[42]. LaKind JS, Naimand DQ, Daily intake of bisphenol A and potential sources of exposure: 2005-2006 National Health and Nutrition Examination SurveyJ Expo Sci Environ Epidemiol 2011 21(3):272-79.10.1038/jes.2010.920237498 [Google Scholar] [CrossRef] [PubMed]
[43]. Cao XL, Corriveau J, Popovic S, Levels of bisphenol A in canned soft drink products in Canadian marketsJ Agric Food Chem 2009 57:1307-11.10.1021/jf803213g19170636 [Google Scholar] [CrossRef] [PubMed]
[44]. Cao XL, Perez-Locas C, Dufresne G, Clement G, Popovic S, Beraldin F, Dabeka RW, Feeley M, Concentrations of bisphenol A in the composite food samples from the 2008 Canadian total diet study in Quebec City and dietary intake estimatesFood AdditContam Part AChem Anal Control Expo Risk Assess 2011 28:791-98.10.1080/19440049.2010.51301521623504 [Google Scholar] [CrossRef] [CrossRef]
[45]. Quirós-Alcalá L, Eskenazi B, Bradman A, Ye X, Calafat AM, Harley K, Determinants of urinary bisphenol A concentrations in Mexican/Mexican-American pregnant womenEnviron Int 2013 59:152-60.10.1016/j.envint.2013.05.01623816546 [Google Scholar] [CrossRef] [PubMed]
[46]. Zota AR, Phillips CA, Mitro SD, Recent fast food consumption and bisphenol A and phthalates exposures among the US population in NHANES, 2003-2010Environ Health Perspect 2016 124(10):1521-28.10.1289/ehp.151080327072648 [Google Scholar] [CrossRef] [PubMed]
[47]. Braun JM, Kalkbrenner AE, Calafat AM, Bernert JT, Ye X, Silva MJ, Variability and predictors of urinary Bisphenol A concentrations during pregnancyEnviron Health Perspect 2011 119(1):131-37.10.1289/ehp.100236621205581 [Google Scholar] [CrossRef] [PubMed]
[48]. Hartle JC, Navas-Acien A, Lawrence RS, The consumption of canned food and beverages and urinary Bisphenol A concentrations in NHANES 2003-2008Environ Res 2016 150:375-82.10.1016/j.envres.2016.06.00827362993 [Google Scholar] [CrossRef] [PubMed]
[49]. Fattore M, Russo G, Barbato F, Grumetto L, Albrizio S, Monitoring of bisphenols in canned tuna from Italian marketsFood Chem Toxicol 2015 83:68-75.10.1016/j.fct.2015.05.01026070504 [Google Scholar] [CrossRef] [PubMed]
[50]. Cao XL, Corriveau J, Popovic S, Bisphenol A in canned food products from Canadian marketsJ Food Prot 2010 73(6):1085-89.10.4315/0362-028X-73.6.108520537264 [Google Scholar] [CrossRef] [PubMed]
[51]. Geens T, Apelbaum TZ, Goeyens L, Neels H, Covaci A, Intake of bisphenol A from canned beverages and foods on the Belgian marketFood Addit Contam Part A Chem Anal Control Expo Risk Assess 2010 27(11):1627-37.10.1080/19440049.2010.50818320835936 [Google Scholar] [CrossRef] [PubMed]
[52]. Carwile JL, Luu HT, Bassett LS, Driscoll DA, Yuan C, Chang JY, Ye X, Calafat AM, Michels KB, Polycarbonate bottle use and urinary bisphenol A concentrationsEnviron Health Perspect 2009 117(9):1368-72.10.1289/ehp.090060419750099 [Google Scholar] [CrossRef] [PubMed]
[53]. Li X, Ying GG, Zhao JL, Chen ZF, Lai HJ, Su HC, 4-Nonylphenol, bisphenol-A and triclosan levels in human urine of children and students in China, and the effects of drinking these bottled materials on the levelsEnviron Int 2013 52:81-86.10.1016/j.envint.2011.03.02621794921 [Google Scholar] [CrossRef] [PubMed]
[54]. Mariscal-Arcas M, Rivas A, Granada A, Monteagudo C, Murcia MA, Olea-Serrano F, Dietary exposure assessment of pregnant women to bisphenol-A from cans and microwave containers in Southern SpainFood Chem Toxicol 2009 47(2):506-10.10.1016/j.fct.2008.12.01119121362 [Google Scholar] [CrossRef] [PubMed]
[55]. Azza A Gabr, Nermine N Mahfouz, Mones M Abu Shady, Mai M Youssef, Ebtissam M Salah El-Din, Alyaa H Kamhawy, Socioeconomic position as a risk factor for BPA exposure in a sample of Egyptian childrenJournal of Applied Pharmaceutical Science 2017 7(12):84-89. [Google Scholar]
[56]. Fromme H, Bolte G, Koch HM, Angerer J, Boehmer S, Drexler H, Mayer R, Liebl B, Occurence and daily variation of phthalate metabolites in the urine of an adult populationInt J Hyg Environ Health 2007 210(1):21-33.10.1016/j.ijheh.2006.09.00517182278 [Google Scholar] [CrossRef] [PubMed]
[57]. Needham LL, Calafat AM, Barr DB, Uses and issues of biomonitoringInt J Hyg Environ Health 2007 210(3-4):229-38.10.1016/j.ijheh.2006.11.00217157561 [Google Scholar] [CrossRef] [PubMed]
[58]. EFSA [European Food Safety Authority]Opinion of the Scientific Panel on Food Additives, Flavourings, Processing Aids and Materials in Contact with Food on a request from the Commission related to 2,2-bis[4-hydroxyphenyl]propane [Bisphenol A]The EFSA Journal 2006 428:01-75.10.2903/j.efsa.2007.428 [Google Scholar] [CrossRef]
[59]. EFSA [European Food Safety Authority]Scientific report on Principles and process for dealing with data and evidence in scientific assessmentsEFSA Journal 2015 13(5):4121:35pp. doi:10.2903/j.efsa.2015.412110.2903/j.efsa.2015.4121 [Google Scholar] [CrossRef]
[60]. Technical University of Denmark [DTU] [2015] ‘Evaluation of EFSA’s new Scientific Opinion on Bisphenol A’, [Online] Available from: http://www.food.dtu.dk/english [Accessed on 19th April 2015] [Google Scholar]