Comparative Analysis of Serum Levels of Total Carbohydrates and Protein Linked Carbohydrates in Normal and Diabetic Individuals
Praveen Sablania1, Montosh Chakraborty2, Manish Mandal3, Prerna Singh4, Jiut Ram Keshari5
1 Associate Professor, Department of Biochemistry, ANIIMS, Port Blair, Andaman and Nicobar Islands, India.
2 Associate Professor, Department of Biochemistry, AIIMS, Manglagiri, Andhra Pradesh, India.
3 Professor, G.I. Department of Surgery, IGIMS, Patna, Bihar, India.
4 Tutor, Department of Biochemistry, ANIIMS, Port Blair, Andaman and Nicobar Islands, India.
5 Associate Professor, Department of Biochemistry, IGIMS, Patna, Bihar, India.
NAME, ADDRESS, E-MAIL ID OF THE CORRESPONDING AUTHOR: Dr. Jiut Ram Keshari, Associate Professor, Department of Biochemistry, IGIMS, Sheikhpura, Patna, Bihar, India.
E-mail: jiutram@rediffmail.com
Introduction
Non-enzymatic glycation and enzymatic glycosylation of proteins have been proposed as a major factor in the pathogenesis of diabetic complications by altering structure-function of proteins. Though focus of previous research is primarily focussed on glycated adducts as glycated haemoglobin (HbA1c), Advanced Glycation End Products (AGEs) and glycated albumin. The effect of enzymatic glycosylation has been overlooked in monitoring of diabetes.
Aim
The present study examines the relationship between glycemic status and serum levels of protein linked total carbohydrate using inexpensive and rapid methods.
Materials and Methods
The present case-control study was conducted on 145 subjects that were divided into three groups i.e., normoglycemic controls (n=54), mild-moderate hyperglycemia (MHG) (n=44) and severe hyperglycemia (SHG) (n=47). Serum was subjected to precipitation and then precipitate was re-dissolved in urea/thiourea buffer. Protein content of re-dissolved precipitate was measured using Bradford assay. Serum total carbohydrate and carbohydrate content in resuspended pellet (mg carbohydrate per gram of protein designated as Carbohydate Protein Ratio or CPR) was measured using phenol-sulfuric acid method. Statistical analysis was done using SPSS statistics (V21.0) and Microsoft excel software, viz. Student-t-test for comparison of significant mean, binary logistic regression was used to measure Odds Ratio (OR). In all tests of significance, two sided p value have been reported and results were considered significant if p<0.05.
Results
Serum total carbohydrate and CPR were significantly increased in MHG (p<0.001 and p=0.02, respectively) and SHG (p<0.001 and p<0.001, respectively) compared to controls. CPR levels increased with increase in glycemia i.e., lowest in controls, higher in MGH and highest in SHG. We also observed a statistically significant upward trend from 1st quartile through 4th quartile for CPR in SHG (p<0.001). Likewise OR for 4th quartile compared with inter-quartile range (IQR) as reference was statistically significant for SHG {OR (95%CI)=5.27 (2.09-13.25); p<0.001}.
Conclusion
Glycated Haemoglobin (HbA1c) concentrations and self monitoring of blood glucose are widely used for monitoring of long term and short term glycemic control respectively, although overall glycation and glycosylation status of circulating or tissue proteins could also be affected by glycemic status of an individual. Therefore, it is desirable that an assay or biomarker would provide assessment of overall glycation/glycosylation process in between immediate and long term control. In this preliminary case-control study we found protein linked carbohydrates (PLC) levels and carbohydrate protein ratio (CPR) to be significantly elevated in SHG compared to controls (p<0.001 and p<0.01, respectively). The alterations in PLC levels and CPR may be attributed to difference in glycemic status between these two groups. The method used in current study is inexpensive, rapid and technically less demanding thus suitable for regions having limited resources.
Advanced glycation end products, Glycoprotein, Glycosylation, Hyperglycemia
Introduction
Prolonged exposure to hyperglycemia is recognised as the principal aetiological factor in pathogenesis of diabetic complications. Glycosylation (enzymatic) and glycation (non-enzymatic) of tissue, circulating and erythrocytic proteins can alter protein function as structural alterations, chemical modifications, cell behaviour and interaction [1]. Though alterations in both glycosylation and glycation are associated with hyperglycemia, focus of diabetes management has traditionally been assessment of glycemic control in diabetes by measurement of glycated adducts [2]. Glycated haemoglobin can reflect glucose concentration over the preceeding 8-12 weeks whereas that of glycated albumin over preceeding 2-3 weeks. Glycation of proteins can progress to form AGEs and hyperglycemia accelerates protein linked AGEs [3]. HbA1c is measured by immunoassay/High Performance Liquid Chromatography (HPLC) and AGEs by immunoassays/mass spectrometry but various factors influence either measurement or interpretation of HbA1c results such as chronic renal failure, iron deficiency anemia, erythrocyte life span, presence of deglycating enzymes leading to variable glycation, uremia and haemoglobin variants [3] while AGEs assays are either yet to be standardised or are expensive [4].
All glycated serum proteins are fructosamines, measured by Nitroblue Tetrazolium (NBT) colorimetric assay, less expensive than HbA1c assay, and is considered to reflect concentration of glycated albumin [5]. Nevertheless, glycation of albumin is affected by hypoalbuminemic states as nephrotic syndrome, cirrhosis, hyperuricemia, thyroid disease and hypertriglyceridemia [3].
The other spectrum of carbohydrate linkage to protein ie, enzyme mediated protein glycosylation differ between persons but is remarkably constant per individual. Glycosylation status changes remarkably with lifestyle changes, in pathological & inflammatory states and some congenital disorders of glycosylation [6].
Glycation and glycosylation status in an individual could be affected by hyperglycemia and homeostatic changes. Though most abundant serum protein i.e., albumin, is not glycosylated, most serum protein are glycoproteins. It is pertinent to determine alteration in total carbohydrate (of glycation or glycosylation origin) linked to protein in hyperglycaemic state inexpensively and rapidly in technically less demanding manner in resource poor regions of world. An attempt was made to address these issues in current study. The aim of the present study is to examine the relationship between glycemic status and serum levels of protein linked total carbohydrate using methods that are inexpensive and rapid.
Materials and Methods
The present case control study was conducted in Department of Biochemistry, Indira Gandhi Institute of Medical Sciences, Patna and Andaman and Nicobar Islands Institute of Medical Sciences, Port Blair on serum specimen collected for various diagnostic purposes including fasting and post-prandial plasma glucose from July, 2018 to January, 2019. The study was approved by Institutional Ethics Committee (registration no. ECR/640/Inst/BR/2014/RR-17) and informed consent was taken for both cases and control. Power of the study was 85% associated with 95% confidence interval. Fasting plasma glucose (FPG) was categorised as normoglycemic (80 to 120 mg/dL), mildly to moderately hyperglycemic (121 to 200 mg/dL) and severe hyperglycemic (>200 mg/dL) [7]. A total of 145 subjects were included in the study that were subdivided into three groups; normoglycemic controls (n=54), mild-moderate hyperglycemia (n=44) and severe hyperglycemia (n=47). Hyperglycemic samples were obtained from freshly diagnosed type 2 diabetes mellitus subjects. Individual that came to attend OPD for routine check-up were recruited as controls and were matched with respect to age and gender with hyperglycemic cases. For both controls and hyperglycemic cases, only those subjects were included that aged between 18-65 years with normal liver and renal function tests. Subjects with long term medication, active smokers, alcoholic individuals, any concurrent illness, pregnant females and abnormal liver and renal function tests were excluded from study. A 5 mL of overnight fasting blood was collected in plain vial and serum was separated by centrifugation and stored at -20°C till analysis on following day.
The sample was analysed for total carbohydrate in serum by modified phenol-sulfuric acid method [8]. C-2 hydroxyl group of free or protein linked carbohydrate (PLC) can be detected by phenol-sulfuric acid assay reliably [9,10]. Briefly, 25 μL of serum was precipitated with equal volume of 10% sodium tungstate and 2/3 N H2SO4 and 300 μL distilled water [11]. It was subjected to centrifugation at 5000 rpm for 20 minutes and then supernatant was decanted. Protein pellet was washed thrice with normal saline to remove traces of carbohydrate followed by resuspension in 500 μL of 6M urea/2M thiourea buffer [9,12]. A 100 μL of resuspended pellet was used for measuring PLC using modified phenol-sulfuric acid assay for 2.8 mL assay volume [8] and 25 μL resuspended pellet for analysing protein content using Bradford method at 595 nm for 2.5 mL assay volume [9] using spectrophotometer (Analytical Technologies Limited, Model No. UV-3366Plus). Carbohydrate content in resuspended pellet was calculated in mg per g of protein content in precipitate (designated as CPR) to offset any alteration in serum total protein or alterations in yield during extraction of protein.
Statistical analysis was done using Statistical Package for Social Sciences (SPSS) version V21.0) and Microsoft excel software. Variables in controls were compared with those of cases for significant mean with independent unpaired student t-test and pearson correlation coefficient. Mild-moderate and severe hyperglycaemic cases were categorised into quartiles according to distribution in controls. Risk was estimated using binary logistic regression while odds ratio (OR) was calculated for 4th quartile of mild-moderate and severe hyperglycemia using interquartile range (IQR) as reference. In all tests of significance, two sided p value have been reported with p-value significant at <0.05.
Results
Mean Fasting Plasma Glucose (FPG) levels were 86.72±9.29 mg/dL in normoglycemia, 164.81±15.59 mg/dL in Mild-moderate Hyperglycemia (MHG) and 256.71±52.67 mg/dL in Severe Hyperglycemia (SHG). FPG levels were significantly increased in MHG and SHG compared to controls (p<0.001 and p<0.001, respectively). Mean Serum Total Carbohydrate (STC) levels were significantly elevated in MHG and severe hyperglycemia SHG compared to controls (243±29.90 mg/dL in MHG Vs 179.42±21.79 mg/dL in controls; p=0.01 and 323.26±60.75 mg/dL in SHG Vs 179.42±21.79 mg/dL in controls; p<0.001, respectively). Protein Linked Carbohydrate (PLC) levels were not significantly increased in MHG compared to controls (146.38±24.67 mg/dL in MHG and 140.09±20.09 mg/dL in controls; p=0.17) while it was significantly higher in SHG than in controls (172.46±54.79 mg/dL and 140.09±20.09 mg/dL in controls; p=0.002). Alterations in mg of Carbohydrate Per Gram of Protein (CPR) were statistically significant both in MHG and SHG compared to controls {50.96±9.12 in MHG Vs 46.92±7.75 in controls; p=0.02 and 59.42±15.84 in SHG Vs 46.92±7.75 in controls; p<0.001). There were no alterations in mean levels of protein content in precipitate between either controls {3.01 (±0.37) g%} and MHG {2.89 (±0.34) g%; p=0.11} or between controls and SHG {2.92 (±0.45) g%; p=0.10) [Table/Fig-1].
Comparison between various parameters in normoglycemia, mild to moderate and severe hyperglycemia.
| Normoglycemia (NG) | Mild-Moderate Hyperglycemia (MHG) | Severe Hyperglycemia (SHG) | p-value N vs. MHG | p-value N vs. SHG | p-value MHG vs. SHG |
|---|
| Number of cases | 54 | 44 | 47 | | | |
| Age In years (±SD) | 46.20 (±11.20) | 48.13 (±9.86) | 48.95 (±9.39) | 0.373 | 0.188 | 0.685 |
| FPG† (±SD) mg% | 86.72 (±9.29) | 164.81 (±15.59) | 256.71 (±52.67) | <0.001* | <0.001* | <0.001* |
| STC§ (±SD) mg% | 179.42 (±21.79) | 243.33 (±29.90) | 323.26 (±60.75) | <0.001* | <0.001* | <0.001* |
| PLCπ (±SD) mg% | 140.09 (±20.09) | 146.38 (±24.67) | 172.46 (±54.79) | 0.17 | 0.002* | 0.005* |
| Protein** (±SD) g% | 3.01 (±0.37) | 2.89 (±0.34) | 2.92 (±0.45) | 0.11 | 0.10 | 0.82 |
| CPR†† (±SD) mg/g | 46.92 (±7.75) | 50.96 (±9.12) | 59.42 (±15.84) | 0.02* | <0.001* | 0.003* |
*p-value of independent unpaired student-t-test significant at <0.05; †Fasting plasma glucose; §Serum total carbohydrate; πPLC=Protein linked carbohydrate; **Protein=protein content in precipitate; ††CPR=Carbohydrate protein ratio i.e., milligram of carbohydrate per gram of protein in precipitate
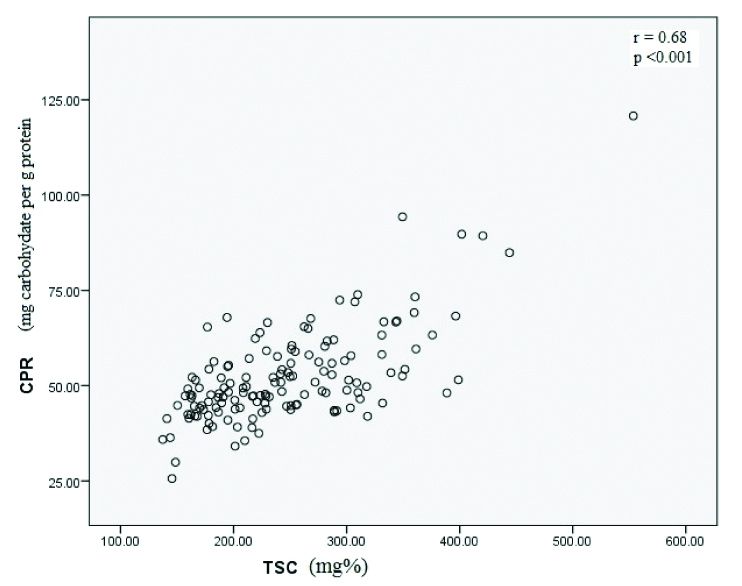
A dose dependent relationship (χ2 test for trend) was evident between risk of high CPR with SHG (p<0.001) while it was not statistically significant for MHG. When odds ratio (OR) was calculated for 4th quartile with inter-quartile range (IQR) as reference, OR was statistically significant for CPR in SHG {OR (95% CI)=5.27 (2.09-13.25); p<0.001}, while OR was not statistically significant for MHG (p=0.067) [Table/Fig-2]. When mean levels of serum total carbohydrate, PLC and CPR were compared between MHG and SHG, all were significantly elevated in SHG (p<0.001, p=0.005 and p=0.003, respectively) while protein content in precipitate revealed no significant alterations (p=0.82). Both fasting plasma glucose (FPG) and serum total carbohydrates (STC) were positively correlated with CPR (r=0.36; p<0.001 and r=0.684; p<0.001, respectively) while FPG and STC were also positively correlated (r=0.815: p<0.001) [Table/Fig-3].
Risk of glycation/glycosylation with glycemic status.
| Quartile | p-value from χ2 test for trend | Odds ratio (95% CI)§ |
|---|
| Glycemia | Variable | Count† | 1st | 2nd | 3rd | 4th | | |
|---|
| Normal | CPR | N (%) | 14 (25.9) | 13 (24.1) | 14 (25.9) | 13 (24.1) | Reference | Reference |
| MHG | CPR | N (%) | 6 (13.6) | 8 (18.2) | 9 (20.5) | 21 (47.7) | 0.09 | 2.56 (1.02-6.43) p=0.067 |
| SHG | CPR | N (%) | 1 (2.1) | 7 (14.9) | 6 (12.8) | 33 (70.2) | <0.001* | 5.27 (2.09-13.25) p<0.001* |
*p-value significant at <0.05; †Count: Count is in N (%) i.e., Number (Percentage); §OR for 4th quartile with IQR as reference; Trend was estimated using cross tab; OR (95% CI) and associated p-value was estimated by binary logistic regression
Correlation between TSC and CPR.
Discussion
To the best of author’s knowledge, no study has correlated total carbohydrates linked to serum protein with grades of hyperglycemia using inexpensive assay described in this study. In the current study, levels of STC were significantly increased in MHG and SHG than controls (p=0.01 & p <0.001, respectively). Since MHG and SHG have higher free glucose in serum than controls, it is anticipated that STC levels would be higher in them, termed spurious by Kennedy AL et al. [13]. Consequently little research has been done to estimate STC in diabetes, nevertheless a study on oral squamous cell carcinoma found STC levels to be 97.25±15.16 mg% that are lower than in current study (179.42±21.79 mg%) in controls [14]. It could be due to lack of reference method and uncertain pre-analytical/analytical variables.
There was significant difference in mean levels of PLC between SHG and controls (p <0.002) while no significant correlation was obtained between MHG and controls (p=0.17). Significant alterations in mean value of PLC were also observed between MGH and SHG (p=0.005). Measurement of PLC in re-dissolved protein precipitate can be deluding without associated measurement of protein, as changes in protein levels could nullify or inflate any actual changes in PLC. We also found CPR to be significantly elevated in MHG than in controls (p=0.02) while elevation in SHG vs control was highly significant (p <0.001). Previous studies [15-18] corroborate the result of present study, as Nelson DM et al., measured Glycosylated Serum Proteins (GSP) using affinity chromatography and reported higher fraction of GSP in diabetic patients than controls [15]. Likewise, Kumar A et al., observed highly significant levels in diabetes than control subjects [16] while Lapolla et al., observed significantly higher levels in IGT, NIDD and IDD than in NGT [17]. Besides significant elevation in diabetic subject, GSP levels reported by Beisswenger et al., [18] are much closer to CPR levels in current study than other studies [15,16, 17]. The disagreement on GSP levels in studies [15-18] mentioned earlier may either be due to use of different analytical methodology or by virtue of estimating non-enzymatic protein glycation. The present study has estimated protein linked total carbohydrate i.e., a measure of both glycation and glycosylation leading to variation in CPR level.
It was also observed that an upward trend from 1st quartile through 4th quartile for CPR in MHG and SHG but it was statistically significant only for SHG (p<0.001). Likewise OR for 4th quartile compared with IQR as reference was statistically significant only for SHG (OR=5.27; p<0.001) and not MHG (p=0.067). CPR levels are also significantly elevated in SHG compared to MHG (p=0.003). None of the studies discussed so far [15-18] have grouped the subjects in three groups that underline an important observation that both PLC and CPR levels increases with levels of hyperglycemia. FPG, STC and CPR are positively correlated with each other and it implies a strong association between increased FPG or STC with CPR. Hyperglycemia induced alterations in protein structure/function range from non-enzymatic glycation of protein and lipids, receptor/non-receptor mediated effects of AGEs that can accelerate atherosclerotic process, PK-C activation that increases expression of TGF-β leading to thickening of capillary basement membrane and hyperglycemia induced oxidative stress [19]. Besides protein glycation, exemplified by HbA1c and glycated albumin, studies on enzymatically glycosylated proteins have revealed that patients with diabetic complications have higher serum or plasma glycoprotein levels (as haptoglobin, fibrinogen, caeruloplasmin) [20], fibrinogen [21], high globulin but not albumin (as α-1 globulin, α-2 globulin, β-globulin and γ-globulins) [22], Osteoprotegerin [23], glycosylated low density lipoprotein fraction,β2-GPI-LDL and ox-LDL [24]. In particular two state of art recent studies as Phuong et al., analysed serum by LC-MSMS and found that expression of five proteins (haptoglobin alpha 2 chain, alpha-2-HS-glycoprotein, clusterin percursor, Apolipoprotein E percursor, Anti-TNFa antibody light chain) increased significantly [25] while Liu M et al., analysed serum glycan profile by microarray and revealed that relative abundance of glycan pattern exhibited significant differences between diabetic nephropathy and non-diabetic renal disease group [26]. A plausible interpretation of these observations suggest that degree of hyperglycemia is positively associated with glycation/glycosylation of serum protein.
Most studies are focussed on role of glycated haemoglobin, glycated albumin and AGEs in diagnosis or monitoring of diabetes and in predicting diabetic complications while missing the general glycosylation process in tissues or circulation. The utility of HbA1c has been argued in select groups as age and racial groups while measurement of glycated albumin/fructosamine and AGEs lack standardisation, require expensive technique or influenced by variety of factors as altered albumin metabolism [3]. The current study has attempted to address overall glycation and glycosylation process in circulation by measurement of total carbohydrate linked to serum proteins inexpensively and rapidly. The results of present study show that measurement of PLC may be used as an adjunct to measurement of glycated haemoglobin and fasting plasma glucose as it could be conducted at a time between immediate control (self monitoring of blood glucose) and long term control (HbA1c estimation). Since the results may vary among laboratories, reference levels of PLC and CPR needs to be established by individual laboratories.
Limitation
The present study had limited sample size, thus more elaborative case-controls studies are required for further evaluation of PLC in monitoring of diabetes.
Conclusion
Though glycemic status affects both glycation and glycosylation, studies have focussed mainly on glycated haemoglobin, glycated albumin and AGEs. HbA1c is widely used for monitoring long term glycemic control and self monitoring of blood glucose for immediate glycemic control. Thus there is a need of an assay or biomarker that could assess the overall glycation/glycosylation process in between immediate and long term control. The present study has addressed this issue using methods that are inexpensive and rapid. We found that protein linked carbohydrates (PLC) levels and carbohydrate protein ratio (CPR) were significantly elevated in SHG compared to controls (p<0.001 and p<0.01, respectively) and serum total carbohydrate (STC) was positively correlated with CPR (r=0.68, p<0.001). The alterations in levels of STC, PLC and CPR may be attributed to difference in glycemic status between these two groups. The methods used in current study were inexpensive, rapid and technically less demanding thus suitable for regions having limited resources.
*p-value of independent unpaired student-t-test significant at <0.05; †Fasting plasma glucose; §Serum total carbohydrate; πPLC=Protein linked carbohydrate; **Protein=protein content in precipitate; ††CPR=Carbohydrate protein ratio i.e., milligram of carbohydrate per gram of protein in precipitate
*p-value significant at <0.05; †Count: Count is in N (%) i.e., Number (Percentage); §OR for 4th quartile with IQR as reference; Trend was estimated using cross tab; OR (95% CI) and associated p-value was estimated by binary logistic regression
[1]. Dalziel M, Crispin M, Scanlan CN, Zitzmann N, Dwek RA, Emerging principles for the therapeutic exploitation of glycosylationScience 2014 343(6166):123568110.1126/science.123568124385630 [Google Scholar] [CrossRef] [PubMed]
[2]. Chandalia HB, Krishnaswamy PR, Glycated hemoglobinCurr Sci 2002 83(12):1522-32. [Google Scholar]
[3]. Welsh KJ, Kirkman SM, Sacks DB, Role of glycated proteins in the diagnosis and management of diabetes: Research gaps and future directionsDiabetes Care 2016 39(8):1299-06.10.2337/dc15-272727457632 [Google Scholar] [CrossRef] [PubMed]
[4]. Mitsuhashi T, Vlassara H, Founds HW, Li YM, Standardizing the immunological measurement of advanced glycation end products using normal human serumJ Immunol Methods 1997 207(1):79-88.10.1016/S0022-1759(97)00110-5 [Google Scholar] [CrossRef]
[5]. Schleicher ED, Mayer R, Wagner EM, Gerbitz KD, Is serum fructosamine assay specific for determination of glycated serum protein?Clin Chem 1988 34:320-23. [Google Scholar]
[6]. Clerc F, Reiding KR, Jansen BC, Kammeijer GSM, Bondt A, Wuhrer M, Human plasma protein N-glycosylationGlycoconj J 2016 33(3):309-43.10.1007/s10719-015-9626-226555091 [Google Scholar] [CrossRef] [PubMed]
[7]. Jackson RS, Amdur RL, White JC, Macsata RA, Hyperglycemia Is Associated with Increased Risk of Morbidity and Mortality after Colectomy for CancerJ Am Coll Surg 2012 214(1):68-80.10.1016/j.jamcollsurg.2011.09.01622079879 [Google Scholar] [CrossRef] [PubMed]
[8]. Rassouli M, Ravari-Ostovar H, Shokri-Afra , Characterization and improvement of phenol-sulfuric acid microassay for glucose-based glycogenEur Rev Med Pharmacol Sci 2014 18(14):2020-24. [Google Scholar]
[9]. Walker JM, The protein protocols handbook 2002 2nd editionTotowa, N.J.Humana press:80310.1385/1592591698 [Google Scholar] [CrossRef]
[10]. Saha SK, Brewer CF, determination of the concentrations of oligosaccharides, complex type carbohydrate, and glycoproteins using the phenol-sulfuric acid methodCarbohydr Res 1994 254:157-67.10.1016/0008-6215(94)84249-3 [Google Scholar] [CrossRef]
[11]. Berkman S, Henry RJ, Golub OJ, Segalove M, Tungstic acid precipitation of blood proteinsJ Biol Chem 1954 206:937-943. [Google Scholar]
[12]. Aldous SH, Weise SE, Sharkey TD, Daniel M, Stühler K, Mallmann J, Evolution of the Phosphoenolpyruvate Carboxylase Protein Kinase Family in C3 and C4 Flaveria spp.1Plant Physiol 2014 165(3):1076-91.10.1104/pp.114.24028324850859 [Google Scholar] [CrossRef] [PubMed]
[13]. Kennedy AL, Mehl TD, Merimee TJ, Nonenzymatically glycosylated serum protein: spurious elevation due to free glucose in serumDiabetes 1979 29:413-15.10.2337/diab.29.5.4137380111 [Google Scholar] [CrossRef] [PubMed]
[14]. Dhakar N, Astekar M, Jain M, Saawarn S, Saawarn N, Total sialic acid, total protein and total sugar levels in serum and saliva of oral squamous cell carcinoma patients: A case control studyDent Res J 2013 10(3):343-47. [Google Scholar]
[15]. Nelson DM, Barrow HJ, Clapp DH, Orthman NJ, Whitehurst RM, Glycosylated serum protein levels in diabetes and non-diabetic pregnant patients: an indicator of short-term glycemic control in the diabetic patientAm J Obstet Gynecol 1985 (8):1042-47.10.1016/0002-9378(85)90377-1 [Google Scholar] [CrossRef]
[16]. Kumar A, Rao P, Pattabiraman TN, A colorimetric method for the estimation of serum glycated proteins based on differential reduction of free and bound glucose by sodium borohydrideBiochem Med Metab Biol 1988 39(3):296-04.10.1016/0885-4505(88)90089-8 [Google Scholar] [CrossRef]
[17]. Lapolla A, Poli T, Meneghini F, Zucchetto M, Franchin A, Barison A, Glycated serum proteins and glucose toleranceActa Diabetol Lat 1988 25(4):325-32.10.1007/BF025811313245392 [Google Scholar] [CrossRef] [PubMed]
[18]. Beisswenger PJ, Healy JC, Shultz EK, Glycosylated serum proteins and glycosylated hemolgobin in the assessment of glycemic control in insulin-dependent and non-insulin dependent diabetes mellitusMetabolism 1993 42(8):989-92.10.1016/0026-0495(93)90011-C [Google Scholar] [CrossRef]
[19]. Aronson D, Rayfield EJ, How hyperglycemia promotes atherosclerosis: molecular mechanismsCardiovascular diabetology 2002 1:110.1186/1475-2840-1-112119059 [Google Scholar] [CrossRef] [PubMed]
[20]. Jonsson A, Wales JK, Blood glycoprotein levels in diabetes mellitusDiabetologia 1976 12(3):245-50.10.1007/BF0042209160265 [Google Scholar] [CrossRef] [PubMed]
[21]. Le DS, Miles R, Savage PJ, Cornell E, Tracy RP, Knowler WC, Krakoff J, The association of plasma fibrinogen concentration with diabetic microvascular complications in young adults with early-onset of type 2 diabetesDiabetes Res Clin Pract 2008 82(3):317-23.10.1016/j.diabres.2008.08.01918922595 [Google Scholar] [CrossRef] [PubMed]
[22]. Gul A, Rahman MA, Jaleel A, Changes in glycosylated proteins in type-2 diabetic patients with and without complicationsJ Ayub Med Coll Abbottabad 2005 17(3):33-37. [Google Scholar]
[23]. Knudsen ST, Foss CH, Poulsen PL, Andersen NH, Mogensen CE, Rasmussen LM, Increased plasma concentrations of osteoprotegerin in type 2 diabetic patients with microvascular complicationsEur J Endocrinol 2003 149(1):39-42.10.1530/eje.0.149003912824864 [Google Scholar] [CrossRef] [PubMed]
[24]. Yu R, Yuan Y, Niu D, Song J, Liu T, Wu J, Elevated beta2-glycoprotein I-low-density lipoprotein levels are associated with the presence of diabetic microvascular complicationsJ Diabetes Complications 2015 29(1):59-63.10.1016/j.jdiacomp.2014.09.01025449980 [Google Scholar] [CrossRef] [PubMed]
[25]. Phuong NTM, Thanh TT, Nhi NB, Chi PV, Analysis of glycoproteins in serum of type 2 diabetes mellitus patientsAcad J Biol 2007 29(3):90-94. [Google Scholar]
[26]. Liu M, Yu H, Zhang D, Han D, Han Q, Yan X, Alterations of glycosylation in serum proteins: a new potential indicator to distinguish non-diabetic renal diseases from diabetic nephropathyRSC adv 2018 8:38872-82.10.1039/C8RA06832A [Google Scholar] [CrossRef]