Dynamic Contrast Enhanced Magnetic Resonance Imaging (DCE-MRI) is a highly sensitive diagnostic tool used for evaluation of breast masses, especially in cases in which mammography and breast ultrasound are inconclusive or discrepant [5-7]. It helps in differentiating malignant from benign breast masses in a reproducible manner [8-10]. Several studies have also demonstrated that the addition of DWI to a standard breast MR imaging protocol, improves the specificity and enhances the sensitivity as well as diagnostic accuracy of breast MRI [7,10,11-14].
DWI provides biophysiologic information about the movement of water in normal versus abnormal tissue [7,10,15]. An ADC is the measure of magnitude of water movement in the intracellular and extracellular components of tissue. The ADCs of malignant breast masses are usually lower than those of benign masses, indicating increased cellularity and restricted water diffusion within the tightly packed cells [7,10]. Benign masses exhibit normal cellularity, no restriction of water movement and larger extracellular space; hence the ADCs are higher in these lesions [7,10,14]. Studies in the past have reported results of DWI and ADC threshold values in breast MRI performed with 1.5-T MR units [5,6,8,13,16]. Recent studies have shown that breast MRI performed on a 3.0 T magnet yields improved signal-to-noise ratio for both conventional imaging and DWI [7,8,10,14,15].
Few studies in the literature till date have evaluated the clinical utility of measuring glandular tissue-nADC for differentiating benign from malignant breast masses [7,17,18]. Therefore, the present study was conducted with an aim to assess whether nADC could further improve the diagnostic accuracy of DWI and absolute ADC mapping, in characterising breast masses.
Materials and Methods
A cross-sectional study was conducted in which 200 patients were referred for breast CE-MRI between January 2015 and February 2017. Of these, 39 patients with 51 breasts masses greater than/equal to 1 cm in diameter on CE-MRI; were included. Masses greater than/equal to 1 cm in diameter on CE-MRI were selected for the study because appropriate placement of a Region of Interest (ROI) for analysis of DWI images was possible only within such large masses [19]. The exclusion criteria were breast masses smaller than 10 mm in size, benign cysts, Non-Mass Like Enhancement (NMLE) on CE-MRI, diffuse inflammatory masses and suboptimal MRI examinations due to failed fat suppression on DWI. The study was approved by our institutional ethics committee and informed consent was obtained from all the study participants. The study group included 38 female patients and 1 male patient. Ten patients out of the 39 cases had two distinct, discontinuous masses identified on the CE-MRI. One of the patients had three separate pathologically proven masses. Hence, a total of 51 breast masses were evaluated in this study.
MRI Acquisition Protocol
MR imaging was performed on a 3.0 T MRI superconducting system (Ingenia Release 5, Philips Healthcare, Amsterdam, Netherlands) with patient in prone position using a dedicated breast coil. Conventional breast MR imaging was performed before gadolinium enhancement using the MRI protocol mentioned in [Table/Fig-1]. A single-shot echo-planar DWI sequence was acquired in axial plane prior to intravenous injection of contrast, using b values of 0 and 600 seconds/sq.mm [Table/Fig-1]. In conjunction with previous studies that have emphasized the adequacy of performing DWI using two b values for differentiating benign from malignant breast masses; this study used two b values to obtain ADC measurements [7,10,16,17,20].
Magnetic resonance imaging protocol.
| Sequence | TR/TE in ms | Acquisition Matrix | Slice thickness/Intersection gap | Field of view in mm | b-factors in s/mm2 | Flip angle |
|---|
| STIR axial (7 channel dedicated breast coil) | 6300/60 | 336×512 | 3 mm/0.3 mm | 280×340 | | |
| T1-weighted TSE axial (7 channel dedicated breast coil) | 700/16 | 512×960 | 3 mm/0.3 mm | 280×340 | | |
| T2-weighted fat suppressed axial (7 channel dedicated breast coil) | 4000/65 | 400×512 | 3 mm/0.3 mm | 280×340 | | |
| EPI- DWI (7 channel dedicated breast coil) | 4500/100 | 136×256 | 3 mm/0.3 mm | 340×340 | 0, 600 | |
| Post-contrast, 3D Dyn-eThrive in axial and sagittal planes ((7 channel dedicated breast coil) | 3.9/1.94 | 368×512 | 1 mm | 340×340 | | 12° |
TR: Repetition time; TE: Echo time; EPI: Echo planar imaging; DWI: Diffusion-weighted imaging; STIR: Short tau inversion recovery; TSE: Turbo-spin echo
Subsequently, a single bolus dose of either 0.1 mmol/kg body weight of the MRI contrast agent gadobenate dimeglumine (MultiHance, Bracco Diagnostics, Milan, Italy) or 0.2 mmol/kg body weight of gadodiamide (Omniscan, GE Healthcare, Ireland), was injected intravenously via the antecubital vein using a pressure injector (Spectris Solaris MR Injection System; Medrad, Warrendale, Pa) with an injection rate of 2.0 mL/s, followed by 20 mL saline flush at the same rate. Dynamic post contrast images were obtained using 3D Dyn-eThrive sequence. Initially a non-contrast acquisition was performed followed by six dynamics obtained after intravenous injection of contrast. Each dynamic acquisition was of around 90 seconds’ duration. Automatic subtraction images were obtained. The high-spatial-resolution dynamic post contrast as well as diffusion weighted images were obtained using Spectral Selective Attenuated Inversion-Recovery (SPAIR) sequence for fat suppression. Parallel imaging technique (SENSE, Philips Healthcare) was used to reduce acquisition times.
Image Interpretation
All cases that met our inclusion criteria were transferred to a clinical MRI workstation (Extended MR work space 2.6.3.5, Philips). Single breast radiologist with 15 years’ experience in breast MRI imaging interpreted and recorded the imaging results. The MRI interpreting radiologist was not blinded to the breast US findings, wherever available. Thorough CE-MRI analysis comprised of morphologic and kinetic curve type assessment of the breast masses, in accordance with the MRI interpretation criteria listed in the American College of Radiology-Breast Imaging Reporting and Data System (ACR BI-RADS) imaging atlas fifth edition (5thed) [21,22].
Diffusion weighted images of the breast masses identified on the conventional CE-MRI images, were assessed qualitatively as well as quantitatively. ADC maps were obtained from the DWI images using the proprietary diffusion analysis software provided by the MR imaging manufacturer (Philips Medical Systems) and the Stejkal and Tanner equation.
Qualitative DWI analysis of the 51 breast masses was performed by subjective assessment of the signal intensity on the DWI images and ADC maps. On the basis of above interpretation the masses were classified as restricted or not restricted. For quantitative analysis of the DWI data, the radiologist used an electronic cursor to demarcate ROI avoiding any haemorrhagic or cystic areas within the masses. One to three ROIs were placed depending upon the size of the breast mass (mean ROI area 2.0 square cm ± 1.0; range 0.7-3.2 cm). For each breast mass, the mean absolute ADC was derived and used for further analysis.
For each patient, ADC values in the normal glandular tissue were also obtained by carefully placing a ROI in the normal fibroglandular tissue of the ipsilateral breast, at least 2 cm away from the index lesion. The normalised ADC was calculated using the following equation: nADC of the mass=absolute ADC in the mass/ADC in the normal glandular tissue [7].
All available imaging, pathology, and clinical records were reviewed to determine the final outcome. Masses were considered benign or malignant based on pathology results from either image-guided or surgical biopsies or Fine Needle Aspiration Cytology (FNAC). Masses without a tissue diagnosis were considered benign if they were stable or showed decrease in size on two years of imaging follow-up.
Statistical Analysis
Statistical analysis was performed by using EPI-INFO software. Bivariate analysis was done and Pearson chi square test (p<0.05) was applied to compare the percentages of various parameters between benign and malignant breast masses proven on histopathology/follow-up. For the quantitative parameters (absolute ADC and nADC values) mean, standard deviation, median and range were calculated. For comparing difference in means between benign and malignant masses unpaired t-test (parametric test) was used. The sensitivity, specificity and kappa measure of agreement between the imaging and the final diagnosis were calculated for absolute and normalised ADC values in each of the selected ROIs [7]. ROC curve analysis was performed to assess the diagnostic performance of the absolute ADCs and the nADCs in differentiating benign from malignant masses. Different absolute as well as normalised ADC cut-off values used to differentiate between benign or malignant masses were tested to maximise the Area Under the ROC Curve (AUC).
Results
The mean age of the 39 patients recruited in our study was 43.3 years (age range, 21-77 years). Nine (23.0%) of these patients had positive family history of breast cancer. A total of 24 (63.1%) of the 38 female patients were premenopausal, 4 (10.5%) were peri-menopausal and 10 (26.3%) were postmenopausal.
Twenty five (49.0%) of the 51 breast masses were malignant on histopathology: 21 invasive ductal carcinomas, 2 mucinous carcinomas, 1 papillary cystic carcinoma, 1 malignant phyllodes. Twenty six (51.0%) masses were found to be benign either on biopsy/FNAC or on imaging follow-up: 11 fibroadenomas, 3 benign fibroepithelial lesions, 3 breast abscesses, 2 complex fibroadenomas, 1 sclerosing adenosis, 1 intraductal papilloma, 1 benign phyllodes and 4 lesions which remained unchanged on two years of follow-up.
Contrast Enhanced Magnetic Resonance Imaging (CE-MRI) Results
All (100%) the malignant tumours confirmed by histopathologic examination, demonstrated malignant characteristics on CE-MRI. Twenty three (88.5%) of the 26 benign masses showed benign characteristics on CE-MRI, whereas 3 (11.5%) of the benign masses showed imaging characteristics of malignant lesions.
Qualitative Analysis of the DWI Data
As depicted in [Table/Fig-2]; 21 (84%) of the biopsy proven malignant breast masses appeared hyperintense on DWI and dark on ADC images, implying restricted diffusion. Four (16%) of the biopsy proven malignant masses, did not show diffusion restriction as they demonstrated low signal intensity on DWI and iso-hyperintensity on ADC images.
Qualitative analysis of the diffusion-weighted imaging data.
| Diffusion-weighted imaging | | Biopsy/FNAC/ Follow-up result | |
|---|
| Malignant | Benign | Total |
|---|
| Restricted diffusion | Count | 21 | 7 | 28 |
| % within biopsy/FNAC/follow-up | 84.0% | 26.9% | 54.9% |
| No diffusion restriction | Count | 4 | 19 | 23 |
| % within biopsy/FNAC/follow-up | 16.0% | 73.1% | 45.1% |
| Total | Count | 25 | 26 | 51 |
| % within biopsy/FNAC/follow-up | 100.0% | 100.0% | 100.0% |
kappa=0.569 FNAC: Fine needle aspiration cytology
Quantitative Analysis of DWI Data
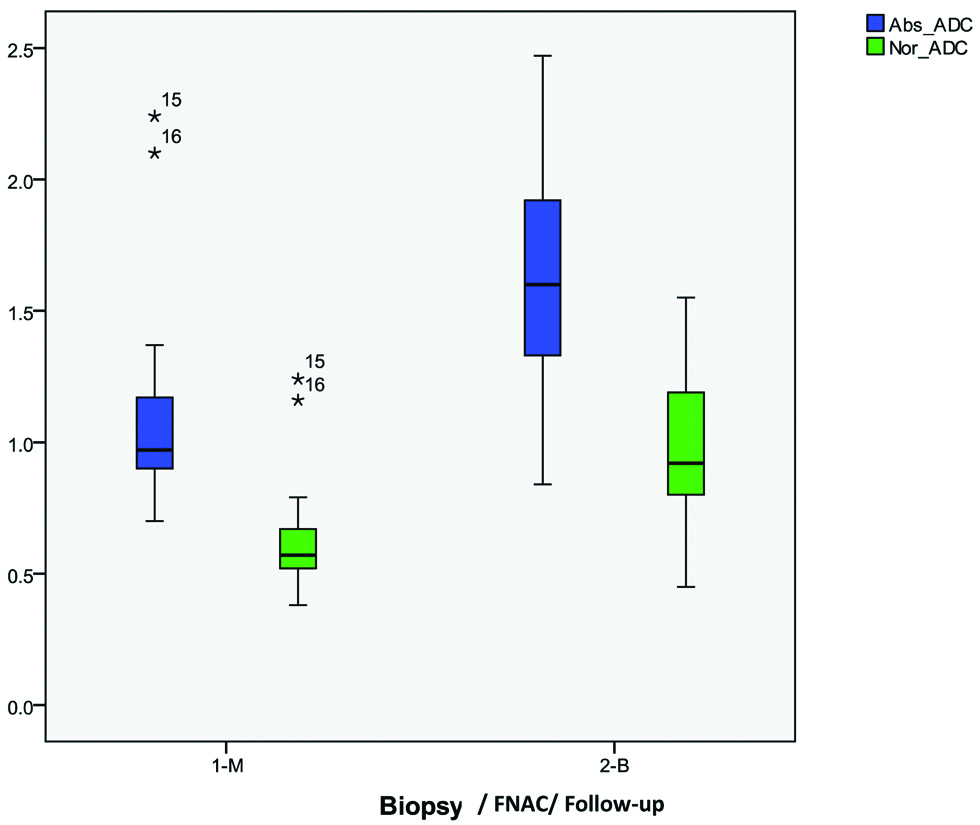
The authors observed significant association between absolute and normalised ADC values calculated within the breast masses and the final diagnosis of benign or malignant lesion (p<0.05). The mean absolute ADC obtained from malignant breast masses was 1.085+0.37×10⁻³ mm2/sec (range, 0.70×10⁻³ mm2/sec to 2.24×10⁻³ mm2/sec). It was significantly lower than the mean absolute ADC obtained from benign masses (mean, 1.562+0.42×10⁻³ mm2/sec; range, 0.84×10⁻³ mm2/sec to 2.25×10⁻³ mm2/sec; p=0.001). Similarly the mean nADC obtained from malignant breast masses was 0.619+0.21×10⁻³ mm2/sec (range, 0.38×10⁻³ mm2/sec to 1.24×10⁻³ mm2/sec). It was significantly lower than the mean nADC obtained from benign masses (mean, 0.98+0.26×10⁻³ mm2/sec; range, 0.45×10⁻³ mm2/sec to 1.55×10⁻³ mm2/sec; p<0.001) [Table/Fig-3,4 and 5]. The investigator recorded that there was less overlap between the benign and malignant breast masses when nADC values were used, as compared to absolute ADC values within the masses [Table/Fig-6].
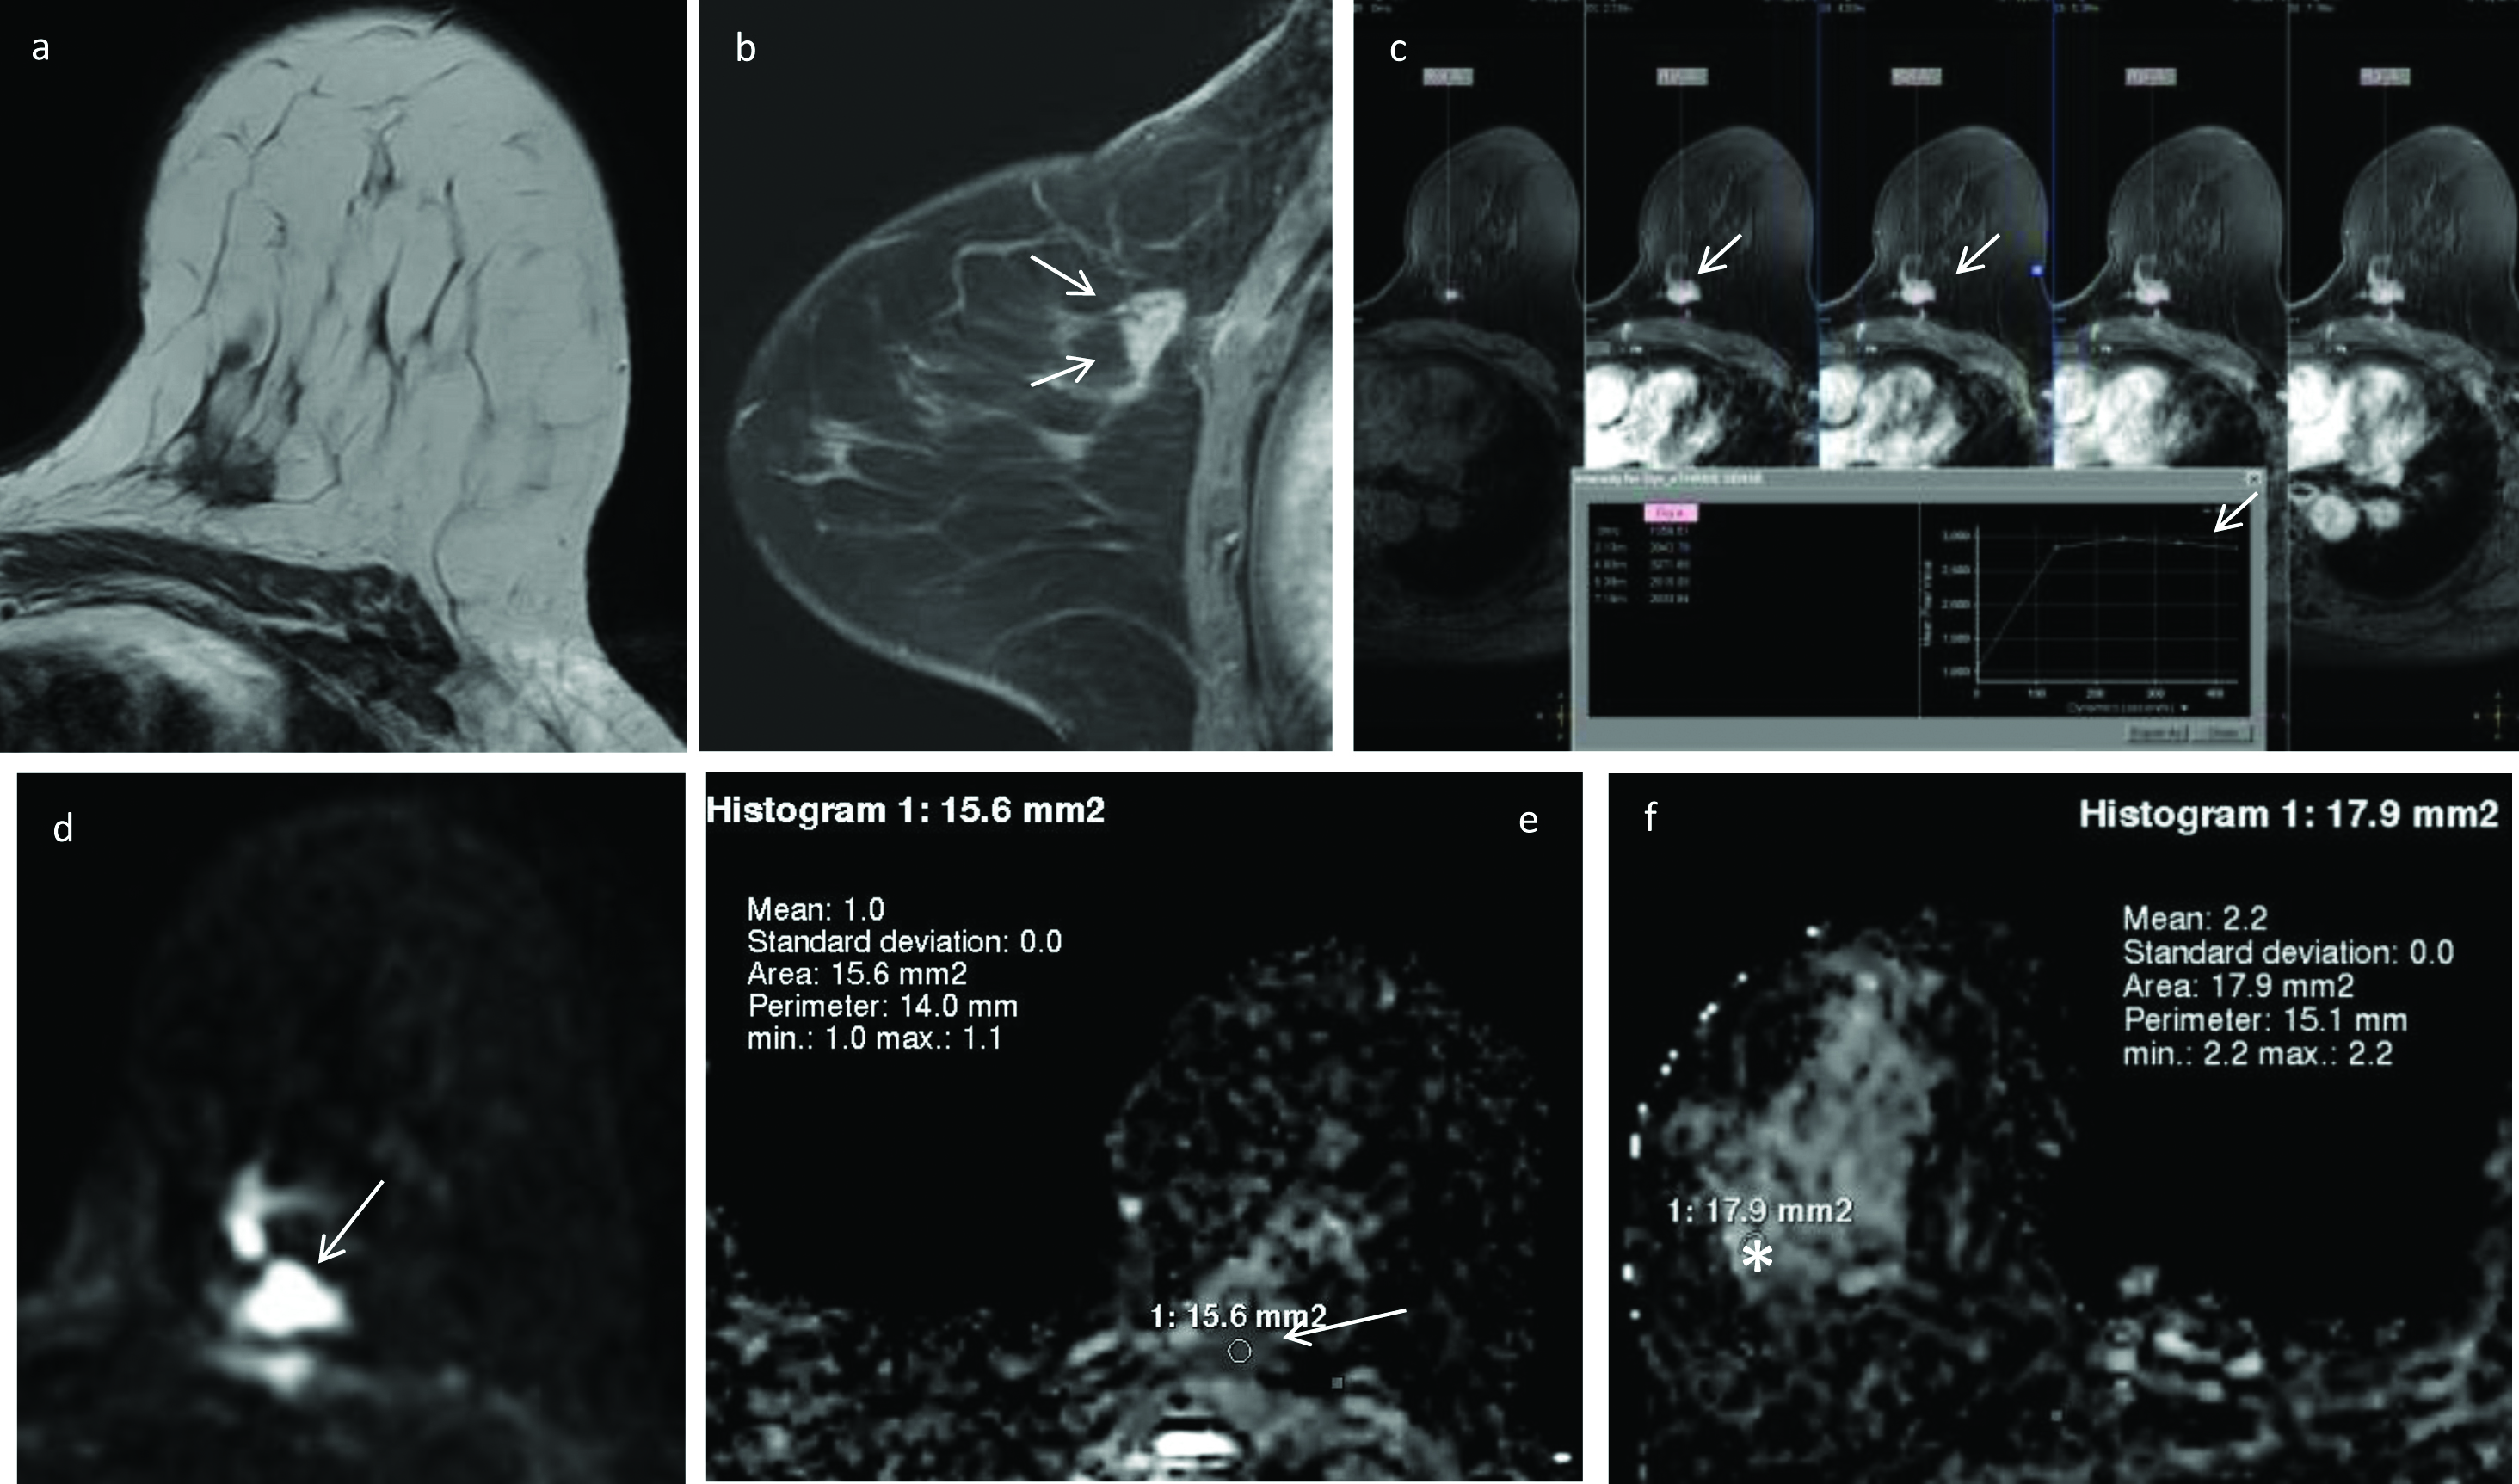
DWI and ADC measurements in invasive ductal carcinoma left breast.
Pre-contrast T1- weighted axial image shows a hypointense, spiculated mass in the left breast (a). On dynamic contrast-enhanced fat suppressed T1-weighted sagittal (b) and axial (c) images (arrows), the lesion shows type-III (washout) contrast kinetics with heterogeneous enhancement. On DWI image (d) the mass shows restricted diffusion (arrow), appears hypointense on the corresponding ADC map (e) and records lower ADC value of 1.0×10⁻³ mm2/s. ADC in the normal appearing right breast parenchyma (asterisk) is 2.2×10⁻³ mm2/s (f). The nADC calculated for the mass is 0.40×10⁻³ mm2/s. The final histo-pathology diagnosis on core biopsy was invasive ductal carcinoma-grade II.
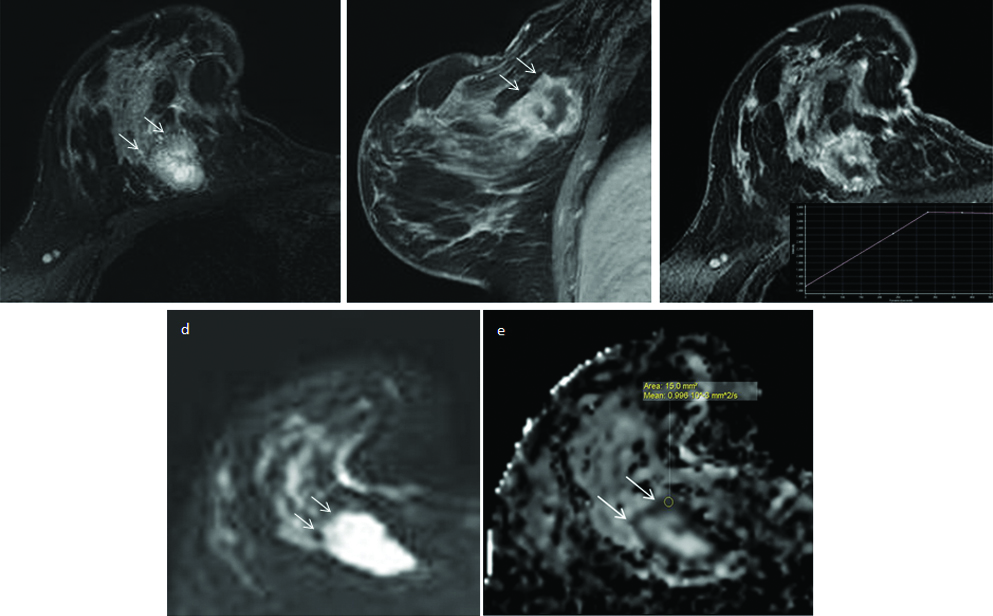
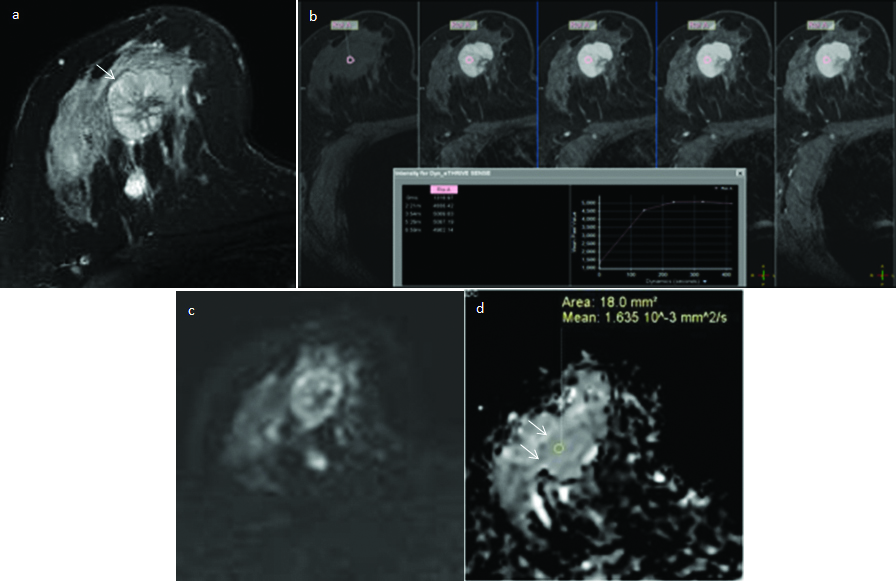
Invasive carcinoma right breast.
In a 42-year-old woman, pre-contrast, fat-suppressed T2-weighted axial image shows an irregularly marginated, mass (arrows) in the right breast (a). On the post contrast dynamic sagittal (b) and axial c) sequences the mass shows irregular, thick peripheral rim enhancement and non-enhancing necrotic central portion (arrows) with Type-III Time Intensity Curve (TIC) in the enhancing rim. On the DWI image (d) the thick peripheral wall shows restricted diffusion (arrows), appearing hypointense on the corresponding ADC map (e) and records an absolute ADC value of 0.99×10⁻³ mm2/s (arrow). Normalised ADC value calculated from the wall of the lesion is 0.54×10⁻³ mm2/s. The final diagnosis on core biopsy was invasive breast carcinoma.
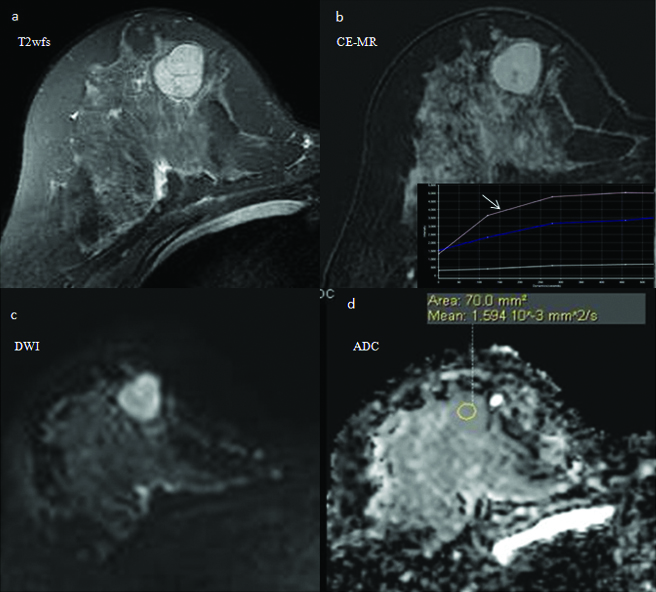
DWI and ADC measurements in a benign mass involving the right breast.
In a 26 year old woman, axial T2–weighted fat suppressed image (T2wfs) shows a well-defined, iso to hyperintense mass with smooth, lobulated margins and dark internal septae in the lower quadrant of right breast (a). On the CEMR images, it shows homogeneous postcontrast enhancement, with few non-enhancing septae within (b) and a Type II TIC curve (arrow). It appears heterogeneously hyperintense on DWI image (c), slightly isointense on corresponding ADC map (d) and records high ADC value of 1.59×10⁻³ mm2/s. Normalised ADC calculated for the lesion is 0.95×10⁻³ mm2/s. Final histopathologic diagnosis on FNAC was consistent with fibroadenoma.
Clustered Box and whisker plots showing distribution and range of the mean absolute ADC and mean normalised ADC values of benign (B) and malignant (M) breast masses. The box plots demonstrate that the degree of overlap in ADC measurements between benign and malignant breast masses is reduced by using nADC values (green coloured box-plots) within the masses, as compared to absolute ADC values (blue coloured box-plots) within the masses.
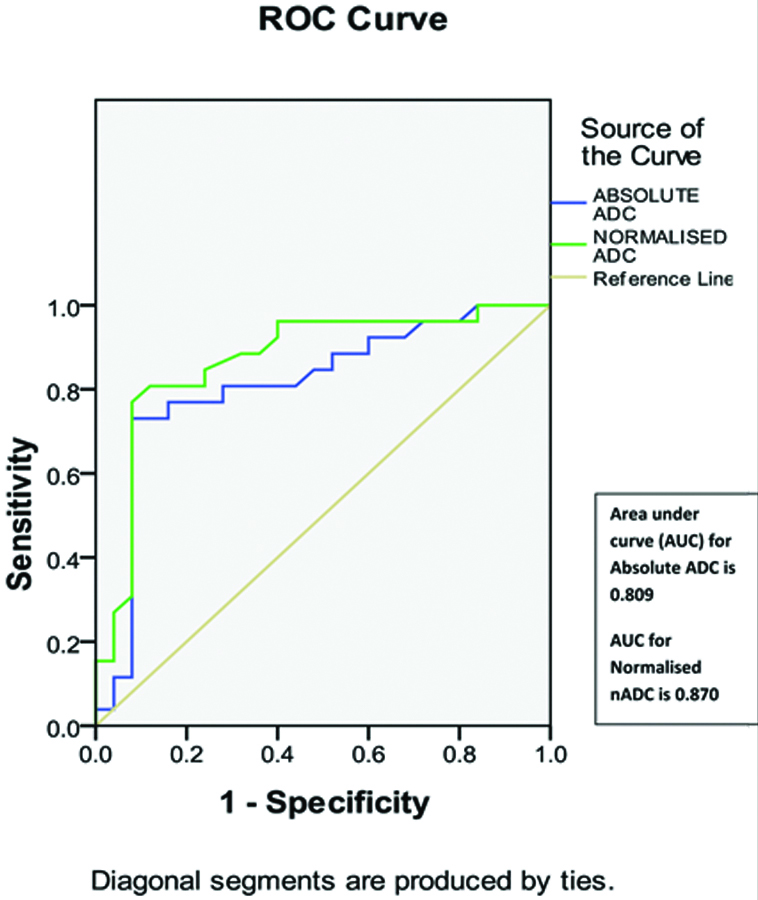
ROC curve analysis demonstrated that an absolute ADC cut-off value of 1.40×10⁻³ mm2/sec [Table/Fig-7] and a threshold normalised ADC cut-off value of 0.80×10⁻³ mm2/sec [Table/Fig-8] recorded the highest combined sensitivity, specificity, Positive Predictive Value (PPV), Negative Predictive Value (NPV) and kappa score of agreement; for differentiating benign from malignant breast masses. The AUC for nADC (0.870) was higher than the AUC for absolute ADC (0.809) [Table/Fig-9].
Diagnostic performance of different absolute ADC cut-off values for differentiating benign from malignant breast masses.
| Absolute ADC Cut-off values (x10−3 mm2/sec) | Sensitivity (%) | Specificity (%) | PPV (%) | NPV (%) | Kappa | p-value |
|---|
| 1.10 | 68.0 | 80.8 | 77.3 | 72.4 | 0.489 | 0.001 |
| 1.20 | 76.0 | 76.9 | 76.0 | 76.9 | 0.529 | 0.001 |
| 1.30 | 80.0 | 76.9 | 76.9 | 80.0 | 0.569 | 0.001 |
| 1.40 | 92.0 | 69.2 | 74.2 | 90.0 | 0.609 | 0.001 |
| 1.50 | 92.0 | 61.5 | 69.7 | 88.9 | 0.532 | 0.001 |
ADC: Apparent diffusion coefficient; PPV: Positive predictive value; NPV: Negative predictive value
Diagnostic performance of different normalised ADC cut-off values for differentiating benign from malignant breast masses.
| Normalised ADC Cut-off values (x10−3 mm2/sec) | Sensitivity (%) | Specificity (%) | PPV (%) | NPV (%) | Kappa | p-value |
|---|
| 0.50 | 24.0 | 96.2 | 85.7 | 56.8 | 0.204 | 0.037 |
| 0.60 | 56.0 | 96.2 | 93.3 | 69.4 | 0.526 | 0.001 |
| 0.70 | 76.0 | 80.8 | 79.2 | 77.8 | 0.568 | 0.001 |
| 0.80 | 92.0 | 76.9 | 79.3 | 90.9 | 0.687 | 0.001 |
| 0.90 | 92.0 | 53.8 | 65.7 | 87.5 | 0.455 | 0.001 |
ADC: Apparent diffusion coefficient; PPV: Positive predictive value; NPV: Negative predictive value
Graph shows comparison between receiver operating characteristic (ROC) curves analysis of absolute ADC values and that of normalised ADC values, for characterising breast masses. Area under curve (AUC) for Normalised ADC=0.870. It is higher than AUC for Absolute ADC=0.809.
Addition of ADCs to Contrast-Enhanced Breast MR Imaging Protocol
When CE-MRI alone was used to differentiate between benign and malignant breast masses, it resulted in a specificity of 88.5%, and kappa score of agreement with biopsy/FNAC/follow-up of 0.883. The diagnostic performance of absolute ADCs and normalised ADCs when used as stand-alone techniques while characterising breast masses, was lower as compared with CE-MRI. However, addition of absolute ADC to CE-MRI increased the specificity of CE-MRI to 92.3% and kappa score of agreement to 0.960. Adding normalised ADC to CE-MRI also resulted in a similar increase in specificity to 92.3% and kappa score of agreement to 0.960. The sensitivity was maintained using all the above techniques [Table/Fig-10].
Comparison of diagnostic performances of conventional CE-MRI, quantitative absolute ADC, quantitative normalised ADC and addition of quantitative absolute and normalised ADCs to CE-MRI; for characterising breast masses.
| Imaging | Sensitivity (%) | Specificity (%) | PPV (%) | NPV (%) | Kappa score of agreement with biopsy/FNAC/follow-up | p-value |
|---|
| Conventional CE-MRI | 100.0 | 88.5 | 89.3 | 100.0 | 0.883 | 0.001 |
| Absolute ADC alone with cut-off of 1.4×10⁻³ mm2/sec | 92.0 | 69.2 | 74.2 | 90.0 | 0.609 | 0.001 |
| Normalised nADC alone with cut-off of 0.80×10⁻³ mm2/sec | 92.0 | 76.9 | 79.3 | 90.9 | 0.687 | 0.001 |
| CE-MRI+Absolute ADC | 100 | 92.3 | 92.6 | 100.0 | 0.96 | 0.001 |
| CE-MRI+Normalised nADC | 100.0 | 92.3 | 92.6 | 100.0 | 0.96 | 0.001 |
CE-MRI: Contrast enhanced magnetic resonance imaging; ADC: Apparent diffusion coefficient; PPV: Positive predictive value; NPV: Negative predictive value
Three masses that were diagnosed as probably benign (BI-RADS category III) with CE-MRI alone were correctly downgraded to definitely benign (BI-RADS category II) by adding quantitative absolute and normalised ADC parameters. Addition of DWI analysis to the CE-MRI features helped to improve the overall diagnostic performance of breast MRI [Table/Fig-11].
Addition of DWI analysis to the CE-MRI features improves the diagnostic performance of breast MRI. In this 33 year old woman, an intensely enhancing right breast mass (arrow) with internal septae (a) shows type II-III contrast kinetics (b). It is categorised as probably benign (BI-RADS III) based on the CE-MRI features. It shows mild diffusion restricted (c) with high absolute ADC (d) value of 1.63×10⁻³ mm2/sec (arrows) and nADC value of 1.03×10⁻³ mm2/sec; both indicating benign pathology (BI-RADS II). The biopsy results revealed benign fibro-epithelial lesion.
Eight breast masses that were identified as benign on biopsy/FNAC/ two year imaging follow-up, were diagnosed as malignant on absolute ADC maps and resulted in false positive DWI inference. The masses showed either restricted diffusion or heterogeneous signal intensity on qualitative DWI analysis. Addition of nADC analysis to these masses led to the correct identification of benign nature of two amongst the eight lesions [Table/Fig-12]. Both these lesions were diagnosed as benign fibroadenoma on biopsy/FNAC. Normalised ADC measurements therefore, reduced the false-positive rate from 30.76% (8 of 26 masses) to 23.08% (6 of 26 masses). Three of the six masses with false positive DWI interpretation were diagnosed as abscesses, two were diagnosed as complex fibroadenomas (one was cellular fibroadenoma and the other was sclerosed fibroadenoma) and one of the masses in a young female patient was diagnosed as sclerosing fibroadenosis, on histopathology results.
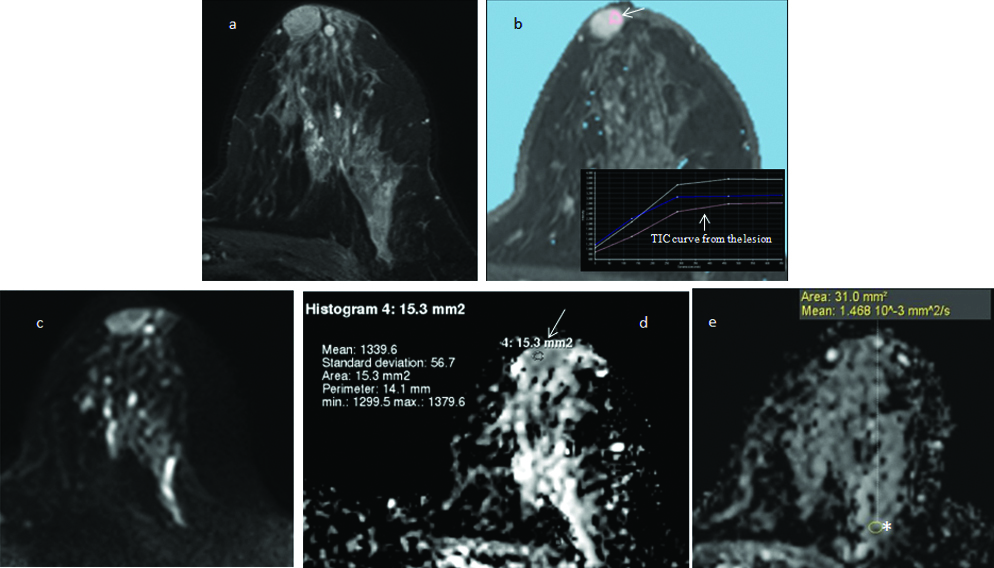
Normalised ADC calculation led to the correct identification of benign nature of breast mass. Axial T2-weighted fat suppressed image shows a smoothly marginated, retro-areolar mass in left breast (a) demonstrating moderate enhancement and type II TIC curve (arrow), on the axial dynamic post-contrast images (b) It does not show diffusion restriction on the DWI (c) and ADC images (d) Absolute ADC (arrow) recorded within the mass is 1.33×10⁻³ mm2/sec (< than the cut-off of 1.4×10⁻³ mm2/sec), suggesting probable malignant nature of the lesion. Normal glandular tissue of left breast (asterisk) records ADC of 1.46×10⁻³ mm2/sec (e) Normalised ADC of 0.91×10⁻³ mm2/sec (> than the cut-off of 0.8×10⁻³ mm2/sec) calculated within the mass, indicates benign pathology. FNAC revealed fibroadenoma.
Two breast masses appeared heterogeneously hyperintense on T2W images and showed intense, thick rim and nodular enhancement on post contrast images along with type II contrast kinetics. They were reported as BI-RADS-IVC on CE MRI interpretation; raising the suspicion of mucinous carcinoma. These masses did not show diffusion restriction and recorded higher absolute ADC (2.1-2.24×10⁻³ mm2/sec) and nADC (1.16-1.24×10⁻³ mm2/sec) values; indicating benign pathology on DWI analysis. However, both these breast masses demonstrated false negative absolute ADC and nADC results as they were diagnosed as mucinous carcinomas on core biopsy.
Discussion
In the settings of increase in incidence of breast cancer worldwide and also in Indian women, prior studies have validated the role of CE-MRI in the imaging of breast cancer [4-6,23,24]. The present study assessed the potential role of quantitative DWI including nADC measurements, in improving the diagnostic performance of breast MRI.
In 1997 Englander SA et al., were the first to explore the possibility of applying DWI to human breast [25]. Since then numerous studies have been performed in order to evaluate the clinical utility of DWI technique in breast MRI. Most of these studies were conducted on a 1.5T MR system [13,18-20]. Prior studies have concluded that DWI performed at higher magnetic field strengths i.e., with 3T systems increases the SNR and improves the visibility of smaller breast masses [7,14,17,26]. Nevertheless, 3T magnets are plagued by B0 and B1 field inhomogeneity [7,17]. This study was conducted on a 3T MR system with use of volume shimming and SPAIR fat suppression techniques to improve upon the B0 and B1 field inhomogeneity.
El Khouli RH et al., Woodhams R et al., and Periera FP et al., [7,12,20] have postulated that the choice of b values strongly influences ADC measurements. In conjunction with these studies, the authors of this study, performed EPI diffusion weighted sequence using two b values of 0 s/mm2 and 600 s/mm2 so as to obtain adequate diffusion-sensitising effect, in characterising breast masses. An attempt was made to achieve a balance between elimination of perfusion factor, maintenance of optimal SNR and reduction of examination time, by selecting these b values.
Studies in the recent past have evaluated the role of glandular tissue normalised ADC maps in distinguishing benign from malignant breast masses [7,18,27,28]. El Khouli RH et al., proposed that use of glandular tissue normalised ADCs for the breast masses is expected to overcome various factors affecting ADC measurements related to physiological body changes (hormonal variations across menstrual cycle), different scanning parameters and use of intravenous contrast agents [7]. Statistical analysis of the data from our study demonstrated significantly lower (p<0.05) mean absolute as well as nADC values obtained from malignant breast masses than the mean absolute and nADC values obtained from benign masses. An absolute ADC cut-off value of 1.40 x10⁻³ mm2/sec and a nADC cut-off value of 0.80 ×10⁻³ mm2/sec when used for differentiating benign from malignant breast masses, showed highest combined sensitivity, specificity, PPV and NPV. The AUC for stand-alone normalised ADC (0.870) was higher than AUC for stand-alone absolute ADC (0.809). These figures were largely in agreement with previously conducted comparable studies [7,10,12,14,15,17,18,28].
Similar to the observations recorded by El Khouli RH et al., Yilmaz E et al., Jang M et al., and Parsian S et al., our study reported a significantly improved diagnostic performance and increased kappa score of agreement, when DWI including absolute and normalised ADC measurements, was used along with concurrent interpretation of breast CE-MRI data [7,18,28,29].
The authors of the present study observed that calculating nADC improved the specificity and diagnostic performance of DW imaging in some cases.
As observed by Woodhams R et al., and Ibrahim YA et al., our study also recorded false positive DWI results within three breast masses diagnosed as abscesses on biopsy [12,30]. This is attributed to high viscosity of infected lesions [12,30]. Two masses diagnosed as sclerosed/atypical fibroadenomas and one mass diagnosed as sclerosing fibroadenosis on histopathology were falsely interpreted as malignant on DWI analysis. Nogueira L et al., have stated that lesions with fibrotic tissue proliferation and increased cellularity demonstrate restriction of water movement and low ADC values; our findings substantiate this claim [31].
Previous studies have demonstrated that majority of mucinous carcinomas of the breast record higher ADCs due to their histologic characteristics of high cellularity, fibrovascular tissue, and mucin-rich content [32]. In our study, the two breast masses with biopsy diagnosis of mucinous carcinoma, also recorded false negative DWI results.
Limitation
The present single centre study was performed on a relatively small study population. Increasing the sample size would improve the statistical power of the results. This study did not evaluate the diagnostic performance of DWI in Non-Mass Enhancement (NME) and diffuse inflammatory/infective pathologies such as mastitis. Similarly characterisation of malignant axillary lymph nodes using DWI was not investigated.
Conclusion
Authors of this study conclude that on addition of absolute ADC and normalised ADC to CE-MRI, there is no major impact on the overall diagnostic accuracy of contrast enhanced breast MRI. The authors also infer that nADC may have a complimentary role, in a small subset of breast masses that demonstrate equivocal CE-MRI findings and/or borderline absolute ADC values. However, multicentric studies involving larger groups of patients are needed for evaluating the feasibility and utility of nADC, in further improving the diagnostic accuracy and specificity of breast MRI.