Newer v/s Classical Anthropometric Indices as a Screening Tool for Dyslipidemia in Healthy Young Adults
Nikhil Mathur1, Srinidhi Rai2, Neveditha Sujith3, Orru Gayatri4
1 MBBS Student, Department of Biochemistry, K S Hegde Medical Academy, Dakshina Kannada, Karnataka, India.
2 Assistant Professor, Department of Biochemistry, K S Hegde Medical Academy, Dakshina Kannada, Karnataka, India.
3 MBBS Student, Department of Biochemistry, K S Hegde Medical Academy, Mangalore, Karnataka, India.
4 MBBS Student, Department of Biochemistry, K S Hegde Medical Academy, Mangalore, Karnataka, India.
NAME, ADDRESS, E-MAIL ID OF THE CORRESPONDING AUTHOR: Dr. Srinidhi Rai, Assistant Professor, Department of Biochemistry, K S Hegde Medical Academy, Deralakatte, Mangalore-575018, Karnataka, India.
E-mail: srinidhirai@nitte.edu.in
Introduction
The association of obesity with higher rates of dyslipidemia and cardiovascular diseases has been well documented. The most commonly used classical anthropometric indices do not provide an accurate distinction between adipose tissue and lean body mass and therefore are an unreliable indicator of obesity. Therefore, newer Anthropometric indices such A Body Shape Index (ABSI) and Body Roundness Index (BRI) were assessed and their co-relation with plasma lipid levels was determined to predict future at-risk population for dyslipidemia.
Aim
To compare classical and newer anthropometric indices in their ability in predicting dyslipidemia.
Materials and Methods
The cross-sectional study was conducted on 100 subjects (aged 18-35 years). The lipid profile (total cholesterol, triglycerides, high density lipoprotein, low density lipoprotein and very low density lipoprotein) was measured by enzymatic colorimetric assay. Classical anthropometric indices: Body Mass Index (BMI), Waist Circumference (WC), Waist-Hip Ratio (WHR) and Waist-Height Ratio (WHt.R) and newer anthropometric indices: ABSI and BRI were measured. Normality of the data was assessed using Kolmogorov-smirnov test. Correlation of lipid parameters with various anthropometric indices was assessed using Pearson’s correlation test. Receiver Operating Characteristics (ROC) curve analysis was done to analyse the predictive capability of various anthropometric indices for distinguishing between dyslipidemic and non-dyslipidemic individuals.
Results
In the study population, 44 (44%) participants had dyslipidemia and 56 (56%) had normal lipid levels. TC showed a statistically significant (p<0.05) positive correlation with BMI (r=0.207), WC (r=0.214) and BRI (r=0.237). TG showed a statistically significant (p<0.05) positive correlation with Wt. (r=0.209), BRI (r=0.242) and a highly significant (p<0.001) (p<0.05) positive correlation with BMI (r=0.311) and WHt.R (r=0.263). HDL-c showed a statistically significant (p<0.05) negative correlation with Wt. (r=-0.232) WC (r=-0.233), WHR (r=-0.199) and highly significant (p<0.001) negative correlation with BMI (r=-0.271) and WHt.R (r=-0.257). LDL-c showed a statistically significant (p<0.05) positive correlation with WC (r=0.249), ABSI (r=0.210) and BRI (r=0.247). BRI showed the highest prediction accuracy with the area under the ROC curve (AUC=0.637).
Conclusion
BRI is closely associated with dyslipidemia. BRI is a powerful index that outperforms the classical anthropometric indices in identifying dyslipidemia and thus shows a potential to be used as an alternative obesity measurement in healthy young adults.
Body mass index, Body roundness index, Body surface index, Waist circumference
Introduction
Cardiovascular Disease (CVD) has become the foremost cause of mortality in India [1]. Obesity associated hypertension, dyslipidemia, diabetes, increased fibrinogen and C-reactive protein increases the likelihood of development of CVD. The prevalence of obesity is increasing at an alarming pace in both men (urban: 15.9 vs. rural: 5.6%) and women (urban: 23.5 vs. rural 7.2%) [2]. Obesity is also a major modifiable risk factor in the instigation of dyslipidemia [3]. Dyslipidemia is defined as abnormal levels of Total Cholesterol (TC), Triglycerides (TG), High Density Lipoprotein cholesterol (HDL-c) and Low Density Lipoprotein cholesterol (LDL-c) individually or in combination [4]. Measurement of lipid profile levels via biochemical analysis for assessing dyslipidemia can pose socio-economic burden on the nation. Therefore, screening by simple, suitable and cost-effective anthropometric measurements is need of the hour for easy identification of risk individuals for CVD [5]. World Health Organization (WHO) recommends BMI as a valid indicator of body fat [6]. However, BMI fails to distinguish between adipose tissue and lean body mass [7]. In addition, BMI and other indices of fat mass (waist-to-height ratio), only reflect the skeletal muscle mass, and therefore cannot be used as a reliable indicator of the body fat mass, mainly in young adults [8]. WC is shown to be a good indicator for abdominal adipose tissue [9]. But dependence of WC on body size remains undetermined [10]. WHR is known to have a very weak association with CVD risk factors as WHR remains constant with changes in body weight [11].
Recently two new body indices were proposed that takes body shape into account along with other parameters and serve as an improved indicator of obesity [12]. ABSI is calculated using waist circumference, BMI, and height. Increased ABSI relates to a higher fraction of abdominal adipose tissue, that is significant risk factor for premature death [13]. BRI is another composite index that combines height and waist circumference to predict the percentage of body fat. Maessen MF et al., reported that BRI could predict the presence of CVD [14].
Based on the available literature, the present study was conducted to determine the efficacy of new anthropometric in assessment of dyslipidemia and risk of CVD. The relationship between serum lipid levels and different anthropometric indices was evaluated in healthy subjects. A comparative study was conducted on the recently described body indices, ABSI and BRI, with the classical indicators of obesity BMI, WC, WHR and WHt.R was done.
Materials and Methods
The cross-sectional study was conducted on 100 subjects (48 males and 52 females) (power of study: 80%) at KS Hegde Medical Academy from November 2017 to November 2018.
Apparently healthy individuals attending the executive health check-up plan and individuals from hospital staff aged 18-35 years were selected for the study. Diabetic or hypertensive individuals or subjects on lipid lowering drugs were excluded from the study.
The study was approved from the Institutional Ethical Clearance committee (IEC No.INST.EC/EC/047/2018-19). The informed written consent was obtained from the selected subjects who were willing to participate in the study.
After overnight fasting, 5 mL of blood was collected from anticubital vein taking all aseptic precautions. Blood collected in plain vacutainer was centrifuged at 3000 rpm for 10 minutes on the same day of collection to obtain serum.
Biochemical Analysis
Total cholesterol level was estimated by enzymatic method CHOD-PAP (Cholesterol Oxidase-Peroxidase 4-Amino antipyrine) [15]. Triglyceride level was estimated by enzymatic (Glycerol kinase, Glycerol-3-phosphate oxidase-Peroxidase) colorimetric method [16]. HDL-c and LDL-c level was estimated by enzymatic colorimetric assay using Cobas c311 autoanalyser [17]. VLDL was calculated by formula-TG/5.
Anthropometric Measurements
Body weight was measured to the nearest kilogram using standard analog weighing scale. The height, waist circumference and hip circumference were measured to the nearest 0.5 cm using a non-stretchable measuring tape.
Waist Circumference (WC) (Cm) was measured in the midway section between the iliac crests and the lower margin of the ribs at minimal respiration.
Hip Circumference (HC) (Cm) was measured at the levels of greater trochanter.
WHR was calculated as WC/HC
WHt.R was calculated as WC (Cm)/height (Cm)
BMI was calculated as weight (Kg)/height (m2)
ABSI was calculated using the formula:  [13]
[13]
BRI was calculated as  [18]
[18]
Statistical Analysis
Normality of the data was determined using Kolmogorov Smirnov test. Correlation of lipid parameters with various anthropometric indices was assessed using Pearson’s correlation test. ROC curve analysis was done to analyse the predictive capability of various anthropometric indices for distinguishing between dyslipidemic and healthy individuals.
Results
Quantitative data of the anthropometric indices were represented as mean±SD for data following normal distribution or median and interquartile range for skewed data [Table/Fig-1]. [Table/Fig-2] presents the maximum and minimum lipid profile parameters.
Anthropometric indices of the participants (n=100) under study.
| Age (years) | Weight (Kg) | Height (Cm) | BMI (Kg/m2) | WC (Cm) | HC (Cm) | WHR | WHt.R | ABSI | BRI |
|---|
| Mean | 20.40 | 58.44 | 161.60 | 22.26 | 75.69 | 89.64 | 0.84 | 0.36 | 0.076 | 2.842 |
| Std. Deviation | 2.23 | 13.13 | 7.61 | 4.08 | 10.49 | 10.39 | 0.06 | 0.07 | .005 | 1.059 |
| 95% C.I Lower | 19.96 | 55.84 | 160.09 | 21.45 | 73.61 | 87.59 | 0.83 | 0.35 | 0.07 | 2.63 |
| Upper | 20.84 | 61.04 | 163.11 | 23.07 | 77.77 | 91.69 | 0.85 | 0.37 | 0.08 | 0.85 |
| Minimum | 18 | 36 | 145 | 14.79 | 56 | 68 | 0.72 | 0.23 | .065 | 1.096 |
| Maximum | 35 | 113 | 180 | 35.27 | 108 | 123 | 1.00 | 0.63 | .086 | 6.406 |
BMI: Body mass index; WC: Waist circumference; HC: Hip circumference; WHR: Waist hip ratio; WHt.R: Waist height ratio; ABSI: A body surface index; BRI: Body roundness index
Lipid parameters of the participants (n=100) under study.
| TC (mg/dL) | TG (mg/dL) | HDL (mg/dL) | LDL (mg/dL) | VLDL (mg/dL) |
|---|
| Mean | 164.50 | 110.53 | 50.36 | 92.03 | 21.89 |
| Std. Deviation | 27.69 | 76.34 | 12.56 | 24.64 | 15.28 |
| Minimum | 102 | 33 | 29 | 24.40 | 7.00 |
| Maximum | 233 | 443 | 89 | 163.20 | 89.0000 |
TC: Total cholesterol; TG: Triglyceride; HDL: High density lipoprotein; LDL: Low density lipoprotein; VLDL: Very low density lipoprotein
According to ATP–III criteria (https://www.nhlbi.nih.gov/files/docs/guidelines/atglance.pdf) 44% of the study subjects were dyslipidemic, whereas 56% of the subjects had normal serum lipid levels. Significant differences in the anthropometric indices were observed when compared between subjects with dyslipidemia and normal lipid levels [Table/Fig-3].
Comparison of anthropometric parameters between dyslipidemic and non dyslipidemic subjects.
| Categories | Age | Weight | Height | BMI | WC | HC | WHR | WHt.R | ABSI | BRI |
|---|
| Dyslipidemia (n=44) | Mean | 20.73 | 61.14 | 161.23 | 23.36 | 78.11 | 92.18 | 0.85 | 0.38 | 0.0757 | 3.1489 |
| Std. deviation | 3.12 | 16.21 | 8.68 | 5.04 | 11.72 | 12.53 | 0.06 | 0.09 | 0.0048 | 1.2189 |
| Minimum | 18 | 36 | 145 | 14.79 | 56 | 68 | 0.73 | 0.23 | 0.068 | 1.0964 |
| Maximum | 35 | 113 | 180 | 35.27 | 108 | 123 | 1.00 | 0.63 | 0.086 | 6.4060 |
| Non dyslipidemia (n=56) | Mean | 20.14 | 56.32 | 161.89 | 21.39 | 73.79 | 87.64 | 0.84 | 0.35 | 0.0752 | 2.6075 |
| Std. deviation | 1.09 | 9.73 | 6.72 | 2.89 | 9.08 | 7.89 | 0.06 | 0.05 | 0.0044 | 0.8536 |
| Minimum | 18 | 37 | 148 | 15.81 | 56 | 71 | 0.72 | 0.24 | 0.065 | 1.1916 |
| Maximum | 23 | 78 | 176 | 28.25 | 91 | 106 | 0.93 | 0.44 | 0.084 | 5.2304 |
| p-value | 0.195 | 0.069 | 0.666 | 0.016 | 0.040 | 0.029 | 0.564 | 0.032 | 0.598 | 0.010 |
BMI: Body mass index; WC: Waist circumference; HC: Hip circumference; WHR: Waist hip ratio; WHt.R: Waist height ratio; ABSI: A body shape index; BRI: Body roundness index. (Student’s t-test)
TC showed a positive but weak correlation with weight, HC, WHR, WHt.R and ABSI. Statistically significant (p≤0.05) positive correlation was observed with BMI, WC and BRI. TC also showed a negative correlation with height. Degree of correlation of TC: BRI>>WC>BMI [Table/Fig-4].
Correlation between lipid profile and anthropometric parameters.
| Categories | TC (mg/dL) | TG (mg/dL) | HDL (mg/dL) | LDL (mg/dL) | VLDL (mg/dL) |
|---|
| Weight (n=100) | Pearson’s correlation | 0.162 | 0.209* | -0232* | 0.170 | 0.193 |
| Sig. (2-tailed) | 0.107 | 0.036 | 0.020 | 0.090 | 0.054 |
| Height (n=100) | Pearson’s correlation | -0.019 | -0.046 | -0.029 | 0.022 | -0.056 |
| Sig. (2-tailed) | 0.851 | 0.650 | 0.774 | 0.829 | 0.580 |
| BMI (n=100) | Pearson’s correlation | 0.207* | 0.311** | -0.271** | 0.178 | 0.298** |
| Sig. (2-tailed) | 0.039 | 0.002 | 0.006 | 0.077 | 0.003 |
| WC (n=100) | Pearson’s correlation | 0.214* | 0.179 | -0.233* | 0.249* | 0.167 |
| Sig. (2-tailed) | 0.032 | 0.075 | 0.019 | 0.013 | 0.097 |
| HC (n=100) | Pearson’s correlation | 0.180 | 0.176 | -0.176 | 0.183 | 0.158 |
| Sig. (2-tailed) | 0.073 | 0.079 | 0.080 | 0.069 | 0.117 |
| WHR (n=100) | Pearson correlation | 0.145 | 0.112 | -0.199* | 0.195 | 0.118 |
| Sig. (2-tailed) | 0.150 | 0.266 | 0.048 | 0.052 | 0.244 |
| WHt.R (n=100) | Pearson’s correlation | 0.188 | 0.263** | -0.257** | 0.179 | 0.247* |
| Sig. (2-tailed) | 0.061 | 0.008 | 0.010 | 0.074 | 0.013 |
| ABSI (n=100) | Pearson’s correlation | 0.109 | -0.146 | -0.014 | 0.220* | -0.142 |
| Sig. (2-tailed) | 0.280 | 0.148 | 0.893 | 0.028 | 0.159 |
| BRI (n=100) | Pearson’s correlation | 0.237* | 0.242* | -0.255* | 0.247* | 0.232* |
| Sig. (2-tailed) | 0.017 | 0.015 | 0.010 | 0.013 | 0.020 |
*p<0.05 statistically significant, **p<0.001 statistically highly significant
BMI: Body mass index; WC: Waist circumference; HC: Hip circumference; WHR: Waist hip ratio; WHt.R: Waist height ratio; ABSI: A body shape index; BRI: Body roundness index; TC: Total cholesterol; TG: Triglyceride; HDL: High density lipoprotein; LDL: Low density lipoprotein; VLDL: Very low density lipoprotein
TG showed a positive but weak correlation with WC, HC and WHR. Statistically significant (p≤0.05) positive correlation was observed with weight and BRI, and highly significant (p≤0.001) positive correlation with BMI and WHt.R. TG also showed a negative correlation with height and ABSI. Degree of correlation of TG: BMI>Wht.R>>BRI>weight [Table/Fig-4].
HDL-c showed a negative but weak correlation with height, HC and ABSI, statistically significant (p<0.05) negative correlation with weight, WC and BRI, and highly significant (p<0.001) negative correlation with BMI and WHt.R Degree of correlation of HDL-c: BMI>Wht.R>BRI>WC>weight>WHR [Table/Fig-4].
LDL-c showed a positive but weak correlation with weight, height, BMI, HC, WHR and WHt.R. Statistically significant (p<0.05) positive correlation with WC, ABSI and BRI. Degree of correlation of LDL: WC>BRI>ABSI [Table/Fig-4].
VLDL showed a positive but weak correlation with weight, WC, HC and WHR, statistically significant (p<0.05) positive correlation with WHt.R and BRI, highly significant (p<0.001) positive correlation BMI, and negative correlation with Ht. and ABSI. Degree of correlation of VLDL: BMI>Wht.R>BRI [Table/Fig-4].
BRI showed the highest prediction accuracy with the area under the ROC curve (AUC=0.637) [Table/Fig-5].
ROC analysis for differentiating between dyslipidemic and non dyslipidemic subjects.
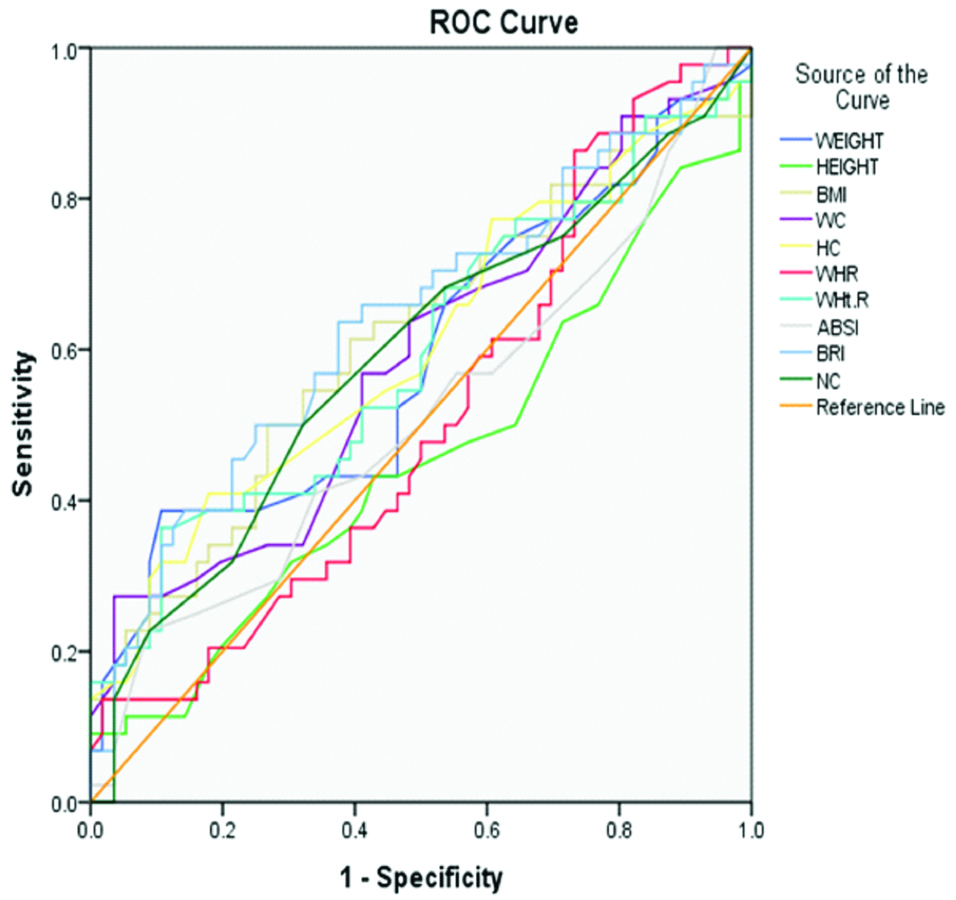 |
| Test result variable (s) | Area | Std. errora | Asymptotic sig.b | Asymptotic 95% confidence interval |
| Lower bound | Upper bound |
| Weight | 0.587 | 0.059 | 0.135 | 0.472 | 0.703 |
| Height | 0.457 | 0.060 | 0.466 | 0.341 | 0.574 |
| BMI | 0.614 | 0.058 | 0.051 | 0.500 | 0.728 |
| WC | 0.589 | 0.058 | 0.128 | 0.475 | 0.703 |
| HC | 0.604 | 0.058 | 0.075 | 0.490 | 0.718 |
| WHR | 0.511 | 0.059 | 0.857 | 0.396 | 0.625 |
| WHt.R | 0.595 | 0.059 | 0.106 | 0.480 | 0.710 |
| ABSI | 0.513 | 0.060 | 0.821 | 0.396 | 0.630 |
| BRI | 0.637 | 0.057 | 0.019 | 0.525 | 0.749 |
BMI: Body mass index; WC: Waist circumference; HC: Hip circumference; WHR: Waist hip ratio; WHt.R: Waist height ratio; ABSI: A body shape index; BRI: Body roundness index
Discussion
To screen the population for dyslipidemia, various classical anthropometric indices have been identified [19]. These classical anthropometric indices fails to distinguish between adipose tissue mass and muscle mass, and with the introduction of newer anthropometric indices, the reliability of classical anthropometric indices have been widely questioned [20].
Therefore the major goal of the present work is to examine the relationship between different the classical and newer anthropometric indices with Dyslipidemia and assess the efficacy of the various anthropometric indices in predicting dyslipidemia. The anthropometric indices and lipid profile of the study subjects was measured. Distribution of study subjects based on the ATP–III guidelines showed that 44% of the study group had dyslipidemia whereas lipid profile was normal in 56% of the study population. TC showed a statistically significant (p≤0.05) positive correlation with BMI, WC and BRI. TG showed a statistically significant (p≤0.05) positive correlation with weight and BRI, and highly significant (p≤0.001) positive correlation with BMI and WHt.R. HDL-c showed a statistically significant (p<0.05) negative correlation with weight, WC and BRI, and highly significant (p<0.001) negative correlation with BMI and WHt.R. LDL-c showed a statistically significant (p<0.05) positive correlation with WC, ABSI and BRI. VLDL showed a statistically significant (p<0.05) positive correlation with WHt.R and BRI, highly significant (p<0.001) positive correlation with BMI. Mota dos Santos C et al., in his study showed that TG was positively correlated with BMI, WC and WHt.R. HDL-c was negatively correlated with BMI, WC and WHt.R. [21]. Yang Z et al., in his study showed that BMI and WHt.R were significantly related with LDL-c, HDL-c and TG. BMI, WC and WHt.R remained independent relationships with HDL-c [22]. Solak I et al., in his study showed that ABSI had weak positive correlation with TC, TG and LDL-c. Weak negative correlation was found between ABSI and HDL-c. BRI showed a weak positive correlation between HDL-c and LDL-c. A statistically significant correlation was found between BRI and TC and TG [23].
Zaid M et al., in his study reported that different anthropometric indices were significantly different between dyslipidemic and non-dyslipidemic participants. Receiver operating characteristics curve analyses showed increased predictive capacity hypertriglyceridemia as compared to other forms of plasma lipid abnormalities. Slightly higher BRI AUC values in predicting different forms of dyslipidemia were observed in comparison to BMI and ABSI gave very low values [24].
According to a study by Chang Y et al., BRI had a larger AUROC value than BMI and WC and had a good discriminative ability for CVD and its risk factors [25]. Accurate estimation of the percentage of body fat and visceral adipose tissue was possible by BRI [18]. These findings were similar to outcomes of our study where BRI showed highest prediction accuracy with the area under the ROC curve (AUROC=0.637).
Fujita M et al., in his study concluded that ABSI is not the best predictor of CVD risk factors [26]. Our results support the above findings. AUROC value for ABSI (AUC=0.513), was lower than AUROC of BRI, WHt.R, BMI, HC and WC.
According to the authors knowledge no comprehensive work has been dedicated to find the correlation between newer anthropometric indices (ABSI and BRI) with lipid profile in India. The present study supports that BRI is better than the classical anthropometric indices in predicting dyslipidemia. This finding may help us to make use of simple anthropometric index as a screening tool in the prediction of cardiovascular disease.
Limitation
Dietary factors which can influence lipid profile were not considered in the study. The sample size was relatively small, age was restricted between 18-35 years and all the subjects belonged to the same region. ABSI was developed to predict mortality hazard in a follow-up study; however we used ABSI to predict dyslipidemia. Therefore, further studies involving a larger randomised community-based population are needed to determine whether the results are consistent under different criteria.
Conclusion
The present study showed that the capacity of BRI to predict dyslipidemia was superior to the classical indicators of obesity. This observation may have implications in the diagnosis and characterisation of dyslipidemia as well as for the assessment of CVD risks.
BMI: Body mass index; WC: Waist circumference; HC: Hip circumference; WHR: Waist hip ratio; WHt.R: Waist height ratio; ABSI: A body surface index; BRI: Body roundness index
TC: Total cholesterol; TG: Triglyceride; HDL: High density lipoprotein; LDL: Low density lipoprotein; VLDL: Very low density lipoprotein
BMI: Body mass index; WC: Waist circumference; HC: Hip circumference; WHR: Waist hip ratio; WHt.R: Waist height ratio; ABSI: A body shape index; BRI: Body roundness index. (Student’s t-test)
[1]. Prabhakaran D, Jeemon P, Roy A, Cardiovascular diseases in India current epidemiology and future directionsCirculationaha 2016 133:1605-20.10.1161/CIRCULATIONAHA.114.00872927142605 [Google Scholar] [CrossRef] [PubMed]
[2]. Pradeepa R, Anjana RM, Joshi SR, Bhansali A, Deepa M, Joshi PP, Prevalence of generalized and abdominal obesity in urban and rural India- The ICMR-INDIAB Study (Phase I)Indian J Med Res 2015 112(2):139-50.10.4103/0971-5916.16423426354211 [Google Scholar] [CrossRef] [PubMed]
[3]. Reddy RR, Nambiar S, Correlation of anthropometric indices with lipid profile in adult femalesNational Journal of Physiology, Pharmacy and Pharmacology 2018 18(4):512-16. [Google Scholar]
[4]. Joshi SR, Anjana RM, Deepa M, Pradeepa R, Bhanasali A, Vinay K, Prevalence of dyslipidemia in urban and rural India: The ICMR-INDIAB studyPlos one 2014 9(5):e9680810.1371/journal.pone.009680824817067 [Google Scholar] [CrossRef] [PubMed]
[5]. Qiao Q, Nyamdorj R, Is the association of type II diabetes with waist circumference or waist-to-hip ratio stronger than that with body mass index?Eur J Clin Nutr 2010 64:30-34.10.1038/ejcn.2009.9319724291 [Google Scholar] [CrossRef] [PubMed]
[6]. Feng RN, Zhao C, Wang C, Niu YC, Li K, Guo FC, BMI is strongly associated with hypertension and waist circumference is strongly associated with type 2 diabetes and dyslipidemia, in northern Chinese adultsJ Epidemiol 2012 22:317-23.10.2188/jea.JE2011012022672914 [Google Scholar] [CrossRef] [PubMed]
[7]. Romero-Corral A, Somers VK, Sierra-Johnson J, Thomas RJ, Collazo-Clavell ML, Korinek J, Accuracy of body mass index in diagnosing obesity in the adult general populationInt J Obes (Lond) 2008 32:959-66.10.1038/ijo.2008.1118283284 [Google Scholar] [CrossRef] [PubMed]
[8]. Zaccagni L, Barbieri D, Gualdi-Russo E, Body composition and physical activity in Italian university studentsJ Transl Med 2014 12:12010.1186/1479-5876-12-12024885945 [Google Scholar] [CrossRef] [PubMed]
[9]. Janssen I, Heymsfield SB, Allison DB, Kotler DP, Ross R, Body mass index and waist circumference independently contribute to the prediction of nonabdominal, abdominal subcutaneous, and visceral fatAm J Clin Nutr 2002 75:683-88.10.1093/ajcn/75.4.68311916754 [Google Scholar] [CrossRef] [PubMed]
[10]. Hsieh SD, Yoshinaga H, Do people with similar waist circumference share similar health risks irrespective of height?Tohoku J Exp Med 1999 188:55-60.10.1620/tjem.188.5510494900 [Google Scholar] [CrossRef] [PubMed]
[11]. Schneider HJ, Glaesmer H, Klotsche J, Bohler S, Lehnert H, Marz W, Accuracy of anthropometric indicators of obesity to predict cardiovascular riskJ Clin Endocrino Metab 2007 92(2):589-94.10.1210/jc.2006-025417105840 [Google Scholar] [CrossRef] [PubMed]
[12]. Ashwell M, Gunn P, Gibson S, Waist-to-height ratio is a better screening tool than waist circumference and BMI for adult cardiometabolic risk factors: systematic review and meta-analysisObes Rev 2012 13:275-86.10.1111/j.1467-789X.2011.00952.x22106927 [Google Scholar] [CrossRef] [PubMed]
[13]. Krakauer NY, Krakauer JC, A new body shape index predicts mortality hazard independently of body mass indexPLoS One 2012 7:e3950410.1371/journal.pone.003950422815707 [Google Scholar] [CrossRef] [PubMed]
[14]. Maessen MF, Eijsvogels TM, Verheggen RJ, Hopman MT, Verbeek AL, de Vegt F, Entering a new era of body indices: the feasibility of a body shape index and body roundness index to identify cardiovascular health statusPLoS One 2014 9:1-9.10.1371/journal.pone.010721225229394 [Google Scholar] [CrossRef] [PubMed]
[15]. Allian CC, Poon LS, Chon CSG, Richmond U, Enzymatic determination of total serum cholesterolClin Chem 1974 20:470-75. [Google Scholar]
[16]. Kohlmeier M, Direct enzymic measurement of glycerides in serum and in lipoprotein fractionsClin Chem 1986 32(1):63-66. [Google Scholar]
[17]. Miida T, Nishimura K, Okamura T, Hiramaya S, Ohmura H, Yoshida H, Validation of homogeneous assays for HDL-cholesterol using fresh samples from healthy and diseased subjectsAtherosclerosis 2014 233(1):253-59.10.1016/j.atherosclerosis.2013.12.03324529153 [Google Scholar] [CrossRef] [PubMed]
[18]. Thomas DM, Bredlau C, Bosy-Westphal A, Mueller M, Shen W, Gallagher D, Relationships between body roundness with body fat and visceral adipose tissue emerging from a new geometrical modelObesity (Silver Spring) 2013 21:2264-71.10.1002/oby.2040823519954 [Google Scholar] [CrossRef] [PubMed]
[19]. Vieira BA, Sauer P, Marcadenti A, Piovesan CH, Association between LAP index (Lipid accumulation product) and metabolic profile in hospitalized patientsNutr Hosp 2015 31(6):2771-74. [Google Scholar]
[20]. Yashavanth HS, Bharath MS, Comparison of Body mass index and lipid accumulation product as a better indicator of metabolic syndromeInternational Journal of Advances in Medicine 2017 4(3):728-33.10.18203/2349-3933.ijam20172262 [Google Scholar] [CrossRef]
[21]. Mota dos Santos C, Sa Silva C, Cesar de Araujo E, Kruze Grande de Arruda I, da Silva Diniz A, Coelho Cabral P, Lipid and glucose profiles in outpatients and their correlation with anthropometric indicesRev Port Cardiol 2013 32:35-41.10.1016/j.repc.2012.05.01723266377 [Google Scholar] [CrossRef] [PubMed]
[22]. Yang Z, Ding X, Liu J, Duan P, Si L, Wan B, Associations between anthropometric parameters and lipid profiles in Chineese individuals with age >40 years and BMI <28 kg/m2PLoS One 2017 12(6):e017834310.1371/journal.pone.017834328632766 [Google Scholar] [CrossRef] [PubMed]
[23]. Solak I, Guney I, Cihan FG, Mercan S, Eryilmaz MA, Evaluation of A body shape index and body roundness index, two new anthropometric indices in obese individualsActa Medica Mediterranea 2018 34:1546-50. [Google Scholar]
[24]. Zaid M, Ameer F, Munir R, Rashid R, Farooq N, Hasnain S, Anthropometric and metabolic indices in assessment of type and severity of dyslipidemiaJournal of Physiological Anthropology 2017 36(19):1-10.10.1186/s40101-017-0134-x28241855 [Google Scholar] [CrossRef] [PubMed]
[25]. Chang Y, Guo X, Li T, Guo J, Sun Y, A body shape index and body roundness index: two new indices to identify left ventricular hypertrophy among rural populations in northeast ChinaHeart and Lung Cir C 2016 25:358-64.10.1016/j.hlc.2015.08.00926530436 [Google Scholar] [CrossRef] [PubMed]
[26]. Fujita M, Sato Y, Nagashima K, Takahashi S, Hata A, Predictive power of a body shape index for development of diabetes, hypertension and dyslipidemia in Japaneese adults: a retrospective studyPlos One 2015 10:e012897210.1371/journal.pone.012897226030122 [Google Scholar] [CrossRef] [PubMed]