Introduction
Obesity and metabolic syndrome frequently co-exist and are one of the major health problems around the globe and its prevalence is 25-30%. In India prevalence of metabolic obesity is ≥30%, among females who have higher levels as compared to males. There is a significant proportion of the population who are obese (BMI >25 kg/m2) but metabolically healthy, likewise some people with normal BMI status, but metabolically obese. In this study, we have evaluated the association between metabolic obesity and severity of Coronary Artery Disease (CAD) in stable angina patients.
Aim
To assess the association of severity of angiographic CAD based on the Metabolically Obese (MO) status and Body Mass Index (BMI).
Materials and Methods
Total 408 subjects with stable angina and with positive stress test were included in the study and severity of CAD was measured by SYNTAX score. Obesity was defined as BMI ≥25 kg/m2, and normal weight was defined as BMI <25 kg/m2. The metabolic obesity was determined using the National Cholesterol Education Program-Adult Treatment Panel III (NCEPATP-III) classification in which Asian-specific cut-offs for abdominal obesity is used. Therefore, study subjects were categorised as follows: 1) Metabolically Healthy and Normal Weight (MHNW); 2) Metabolically Obese but Normal Weight (MONW); 3) Metabolically Healthy but Obese (MHO); and 4) Metabolically Abnormally Obese (MAO). Statistical analysis was carried out using statistical package for social sciences (SPSS) version 20. Baseline clinical, demographic, anthropometric and laboratory data are presented as mean±Standard Deviation (SD), median (range), or number (%) unless specified. Comparison among groups was calculated with an analysis of variance (ANOVA) test and Kruskal-Walis test for continuous variables and the Pearson chi-square test for categorical variables. Association between groups and severity of CAD was done by Kruskal-Wallis test. The p-value <0.05 was considered statistically significant.
Results
Out of 408, 70.3% (n=287) subjects were male, 52.7% (n=215) subjects were hypertensive, and 42.9% (n=175) subjects had high BMI. Metabolic obesity showed higher prevalence of CAD (MO, OR=0.25, 95% (1): 0.31-1.03) than patients with higher BMI status (BMI, OR=1.39, 95% (1): 0.79-2.4). Syntax score which measures the severity of CAD is marginally high in MONW group (p-value-0.003) when compared to MHNW group.
Conclusion
MO group was associated with a high prevalence and severity for CAD than metabolically healthy group irrespective of their weight status.
Introduction
Metabolic obesity or metabolic syndrome is also called insulin resistance syndrome; a cluster of risk factors causing major concern around the globe. In western countries like the United States, the prevalence of insulin resistance syndrome is around 23-30%, but it is gradually decreasing due to modification of their lifestyle. But in South Asian countries especially in India, it is one of the major public concerns. It may be due to increased risk factors, drastically growing urbanisation, and socioeconomic status [1].
Obesity and Metabolic obesity are two entirely different entities. Metabolic obesity is defined by National Cholesterol Education Program-Adult Treatment Panel III (NCEPATP-III) criteria in which for abdominal obesity (Waist circumference) Asian specific cut-offs are used. Obesity (phenotypic obesity) is defined as per Asia specific criteria if a person who has BMI more than 25 kg/m2 [2,3]. Phenotypic Obesity is mainly due to increased intake of high-calorie diet and lesser expenditure of it.
Interestingly, there are a significant proportion of individuals who are phenotypically obese but metabolically healthy. Likewise, people with normal weight can be a MO [4]. Therefore, it is important to screen the obese subjects who are at increased threat for obesity-related metabolic abnormalities when compared to the subjects who are metabolically healthy. So, individual with MO status and normal weight is clinically more important [5].
A group of some individual whose BMI is high means they are obese, but they are showing resistance or protective in nature regarding obesity-related comorbidities, this is also called as obesity paradox. We can divide these types of individuals as a healthy metabolic status but obese (metabolically healthy but obese; MHO), even though they have extreme body fat. Clinically, they show a constructive metabolic status characterised by a positive immune profile, low inflammation, elevated insulin sensitivity level, normal blood pressure, normal level of lipid and hormonal profile [6].
Also, some individual whose BMI is normal but their metabolic status is obese can be grouped as MONW [7]. Approximately, 20 50% of the population contains the metabolically healthy obese group [8].
Patients of CAD or IHD are mostly due to the lesser supply of blood to the myocardium. Supply of blood decreases because of obstruction in the coronary arteries; the main reason for the obstruction is nothing but atherosclerosis.
When there is an increased demand for oxygen in myocardium than its supply, the symptoms occur. It causes chest discomfort during exertion and relieves at rest.
Coronary Angiogram (CAG) is a gold standard procedure for the diagnosis of coronary atherosclerosis, but it is not a reliable indicator of the functional significance of any single coronary artery stenosis. By CAG, we can identify the disease extent and severity of the disease. A finding of an angiogram is a powerful clinical predictor for the disease prognosis also it guides the therapy for the same.
There is a significant proportion of the population who are obese (BMI >25 kg/m2) but metabolically healthy, likewise some people with normal BMI status, but MO. Therefore, our keen interest in this study was to find out the relative importance of metabolic obesity and BMI status with the severity of CAD.
Materials and Methods
The study was conducted from Jan 2016 to Dec 2018 at the Department of Cardiology, Manipal Academy of Higher education, Manipal, Karnataka, India. Ethical clearance was obtained from Institutional ethical committee (IEC 644/2015). Sample size was calculated by using formula for sample size evaluation for two proportion where Confidence Interval (CI) was 95% with 80% power and (P1=0.2, P2=0.35) [9]. In this prospective observational study, 408 patients with the with age limit of 25 to 80 years presented to the cardiology department for evaluation of stable angina and/or Tread Mill Test (TMT) positive and undergoing coronary angiogram were included in the study. Patients with known CKD, hepatic dysfunction, known as endocrinal or rheumatological diseases, or chronic infections were excluded from the study. All cases were interviewed using a questionnaire, which included data on smoking, physical activity, height, weight were measured to calculate BMI and waist and hip circumference to calculating the Waist-Hip Ratio (WHR). Data on clinical History of Hypertension (HTN), DM and medications were also acquired.
Fasting blood sampleswere collected after 12 hours of fasting. Total cholesterol, triglyceride, High-Density Lipoprotein (HDL) cholesterol, Low-Density Lipoprotein (LDL) cholesterol, and Very Low-Density Lipoprotein (VLDL) cholesterol were measured using Cholesterol Oxidasepara Aminoantipyrine (CHOD-PAP) and Lipase Glycerolkinase (LIP/GK) enzymatic clearance method respectively. Friedewald’s formula calculated LDL and VLDL.
Classification according to metabolic obesity and weight status: Normal weight was defined as BMI (kg/m2) <25 (n=233; 57.1%) and obesity was defined as BMI≥25 (n=175; 42.9%) according to the Asia-specific criteria for obesity [2]. We did not form a separate analysis group for “underweight” subjects (BMI<18.5) because very few subjects met this definition, and the results were essentially unchanged when these subjects were excluded.
Metabolic obesity was defined as the presence of three or more of the following five metabolic components: 1) waist circumference ≥90 cm in men and 85 cm in women; 2) High-Density Lipoprotein Cholesterol (HDL-C) <40 mg/dL in men and 50 mg/dL in women; 3) TG ≥150 mg/dL; 4) blood pressure ≥130/85 mmHg or treatment of hypertension; and 5) FPG ≥100 mg/dL.
We categorised our subjects into four groups according to metabolic obesity and weight status as follows: 1) MHNW group; 2) MONW group; 3) MHO group; and 4) MAO group. Height was measured to the nearest 0.1 cm using a standard stadiometer. Weight was measured, in light clothes; to the nearest 0.1 kg using a set of standard calibrated electronic scales. WC and HC were measured using a constant-tension tape. WC was measured at the midpoint between the lowest rib and the upper point of the iliac crest and at the end of normal expiration. HC was measured at the maximum protrusion of the buttocks. Anthropometric measurements, such as height, weight, waist circumference, hip circumference were measured before the patient undergoing a coronary angiogram.
The severity of CAD was measured by the SYNTAX scoring system by the same cardiologist. The Syntax score was assessed by a computer program consisting of sequential and interactive self-guided questions which are available online [10].(www.syntaxscore.com).
Statistical Analysis
Statistical analysis was carried out using Statistical Package for Social Sciences (SPSS) version 20. Baseline clinical, demographic, anthropometric and laboratory data were presented as mean±Standard Deviation (SD), median (range), or number (%) unless specified. Comparison among groups was calculated with an analysis of variance (ANOVA) test and Kruskal-Walis test for continuous variables and the Pearson chi-square test for categorical variables. Association between groups and severity of CAD was done by Kruskal-Wallis test. The p-value <0.05 was considered statistically significant.
Results
Baseline characteristics of subjects: A total of 408 patients were recruited in which 70.3% were males [Table/Fig-1]. Subjects were classified into four groups; MHNW (n=119, 29.1%), MONW (n=111, 25.8%), MHO (n=88, 21.56%) and MAO (n=90, 22.05%). The prevalence of metabolic obesity was 49.26% (n=201). In our study population 50.5% (n=206) subjects had mild CAD, 19.9% (n=81) subjects had Single Vessel Disease (SVD), 14.5% (n=59) subjects had double vessel disease, 7.8% (n=32) subjects had triple vessel disease and 6.6% (n=27) subjects has multivessel disease. The population distribution of age, BMI, FPG, HbA1c, Triglycerides, HDL-C differed significantly among the four groups [Table/Fig-2]. The mean age was almost similar in all the groups, but MONW showed the elderly population where MAO group indicated the young population than other groups. FPG in the MAO group was significantly higher than that in the MHNW and MHO groups. HDL in the MONW and MAO groups was significantly lower than that in the MHNW and MHO groups, and TG in the MONW and MAO groups was significantly higher than that in the other two groups.
Demographic characterstics of study population (n=408).
| Variables | Percentage/Proportion |
|---|
| Males | 287 (70.3%) |
| Females | 121 (29.7%) |
| Presence of Hypertension | 215 (52.7%) |
| Smoking (Yes) | 43 (10.5%) |
| Alcohol (Yes) | 108 (26.5%) |
| High BMI | 175 (42.9%) |
| Metabolic Obesity | 201 (49.26%) |
| Mild CAD | 206 (50.5%) |
| SVD | 81 (19.9%) |
| DVD | 59 (14.5%) |
| TVD | 32 (7.8) |
| MVD | 27 (6.6) |
Baseline characteristics of subjects.
| MHNW (n=119) Mean±SD | MONW (n=111) Mean±SD | MHO (n=88) Mean±SD | MAO (n=90) Mean±SD | p-value* |
|---|
| Age (in years) | 57.45±10.93 | 58.20±9.48 | 56.7±9.7 | 55.6±9.9 | 0.329 |
| BMI (Kg/m2) | 22.04±2.2 | 22.62±2.3 | 27.1±2.93 | 28.72±3.17 | <0.001 |
| WC (cm) | 85.7±7.21 | 88.1±10.3 | 90.59±10.12 | 95.54±9.89 | <0.001 |
| WHR | 0.95±0.028 | 0.96±0.028 | 0.95±0.02 | 0.95±0.02 | 0.025 |
| FPG (mg/dL) | 101.75±18.7 | 112.2±21.32 | 102.3±17.3 | 115.7±23.8 | <0.001 |
| HbA1c | 5.94±0.62 | 5.96±0.81 | 5.87±0.49 | 6.2±0.9 | <0.001 |
| Total Cholesterol (mg/dL) | 150.6±60.97 | 180.4±48.18 | 180.2±48.14 | 179.6±38.2 | 0.99 |
| Triglycerides (mg/dL) | 126.37±50.57 | 169.52±55.58 | 126.9±44.6 | 167.8±51.8 | <0.001 |
| HDL-C (mg/dL) | 46.37±12.4 | 38.42±8.17 | 43.26±10.55 | 39.13±8.7 | <0.001 |
| LDL-C (mg/dL) | 106±34.83 | 110±38.83 | 112±35.7 | 103±29.04 | 0.296 |
| TC/HDL ratio | 4.08±1.37 | 4.82±1.43 | 4.31±1.15 | 4.7±1.45 | 0.001 |
| HOMA-IR | 9.42±14.76 | 9.9±11.48 | 8.0±9.74 | 13.8±19.04 | 0.32 |
| Urea (mg/dL) | 23.9±7.98 | 23.28±6.4 | 24.69±9.8 | 22.8±12.4 | 0.54 |
| Creatinine (mg/dL) | 0.94±0.23 | 0.96±0.22 | 0.95±0.21 | 0.89±0.21 | 0.15 |
| Uric acid(mg/dL) | 4.24±0.94 | 4.6±1.78 | 5.06±3.73 | 4.8±3.93 | 0.24 |
| eGFR (mL/min/1.73 m2) | 83.3±18.6 | 78.4±19.9 | 83.15±17.3 | 84.9±21.8 | 0.10 |
| hsCRP | 5.35±11.9 | 6.4±10.4 | 7.6±24.49 | 6.8±10.1 | 0.82 |
| Haemoglobin (g/dL) | 14.36±1.96 | 13.23±1.73 | 13.63±1.48 | 13.46±1.63 | 0.21 |
*One-way Anova test done. MHNW: Metabolically healthy and normal weight; MONW: Metabolically obese but normal weight; MHO: Metabolically healthy but obese; MAO: Metabolically abnormal obese group, LDL_-C: Low density cholesterol; HSCRP: High sensitive C reactive protein; EGFR: Estimated glomerular filtration rate; HOMA-IR: Homeostatic model assessment insulin resistance
Prevalence and severity of angiographic CAD according to metabolically obese and weight status: Compared with MHNW, MONW group showed a higher prevalence of angiographic CAD in all the subjects [Table/Fig-3]. There is a 1.11 times more chance of getting CAD in patients who have metabolic obesity when compared to metabolically healthy patients [Table/Fig-4].
Severity of coronary artery disease among the four groups.
| Variable | MHNW | MONW | MHO | MAO |
|---|
| Syntax Score |
| Median (Q1,Q3) | 5 (2,15) | 12 (4,18.5) | 9 (2,20) | 7 (2,16) |
| p-value* | 0.003 | 0.003 | 0.003 | 0.003 |
*Non parametric tests carried out by Kruskal wallis one-way Anova test Null hypothesis Syntax score of all the groups are equal, alternate atleast 1 group is not equal.
Odds ratio of CAD according to metabolic status.
| Syntax score | Odds ratio | p-value |
|---|
| Metabolically Obese |
| Absence® | | |
| Presence | 1.11 | 0.041* |
| Gender |
| Female® | | |
| Male | 1.17 | 0.001** |
| Age |
| Adult® | | |
| Senior | 1.25 | 0.000*** |
| Hypertension |
| Absence® | | |
| Presence | 1.04 | 0.346 |
| Smoking |
| Absence® | | |
| Presence | 1.01 | 0.883*** |
*p<0.05,**p<0.01,***p<0.001
Compared to subjects in MHNW group, the MONW group showed higher association with severity of angiographic CAD. SYNTAX score which was used for measure the severity of CAD showed high association with MONW group when compared to other groups (p-value-0.003).
Furthermore, we compared the association of severity of CAD in between groups: when we compared MHNW group with MONW group, it showed high significance, i.e., p-value <0.001, when MHNW group compared with MHO group p-value was 0.008, and with MAO group p-value was 0.006 [Table/Fig-5,6]. It is clearly seen from the results that the severity of angiographic CAD was high in MONW group. Unexpectedly, the MAO group showed a lesser association of severity of angiographic CAD than the MONW and MHO groups in comparison with MHNW group.
Severity of coronary artery disease between the groups.
| Comparison | p-value |
|---|
| Syntax Score p-value* <0.008 |
| MHNW V/S MONW | <0.001 |
| MHNW V/S MHO | 0.008 |
| MHNW V/S MAO | 0.006 |
| MONW V/S MHO | 0.023 |
| MONW V/S MAO | 0.015 |
| MHO V/S MAO | 0.93 |
*Non parametric tests carried out by Mann-Whitney test, MHNW: Metabolically healthy and normal weight, MONW: Metabolically obese but normal weight, MHO: Metabolically healthy but obese, MAO: Metabolically abnormal obese group
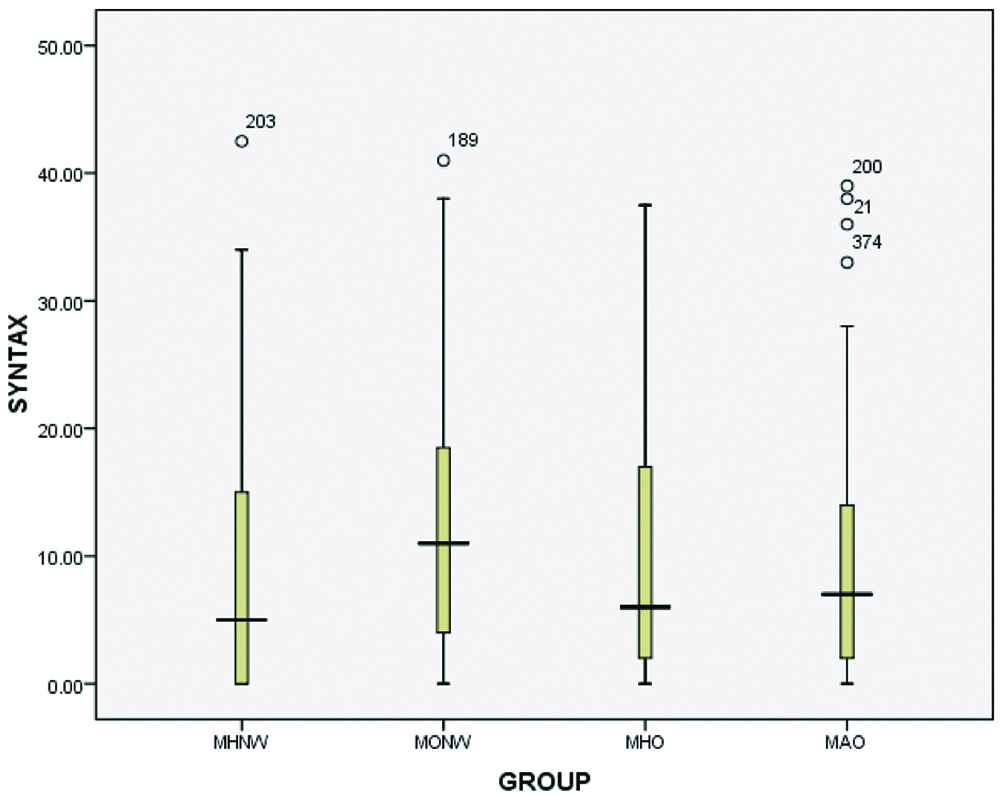
Severity of coronary artery disease among four groups.
Groups 1: MHNW 5 (0,15), Groups 2: MONW 11 (4,19), Groups 3: MHO 6 (2,17.5), Groups 4: MAO 7 (2,14)
Discussion
This is the first type of study in India which compares both the presence and association of severity of angiographic CAD between the metabolic obesity groups and weight status.
The main finding of the present is that the study subjects in MONW group have significant association with the severity of CAD when compared to subjects in other groups. Even subjects in MHO and MAO group are also showing lesser association with severity of CAD concerning MHNW group. There are some previous studies which showed MONW group was associated with a high prevalence of cardiovascular diseases [11,12]. This study also shows that the MO group (combination of MONW and MAO), rather than the weight status, was associated with the prevalence and severity of angiographic CAD. These results emphasize the importance of metabolic obesity as a risk factor for angiographic CAD again, regardless of phenotypic obesity which is measured by the BMI. The metabolic obese status, not just weight status also predicts future cardiovascular risk. This study shows the similar results with the studies presented in literature [10,11]. However, this study suggests that the greater part of severity or adverse association with angiographic CAD is in MO group patients with normal weight, but not group with high BMI status (phenotypic obesity).
Other than this angiographic CAD, MONW group patients associated with subclinical left ventricular dysfunction, new-onset diabetes, heart failure and significant mortality [13-15]. Major differences between previous studies are that all the subjects included in this study had positive stress test findings or came with the complaint of stable angina and underwent invasive CAG for the exact evaluation of CAD burden. We included more than 400 subjects in our study. Second, we assessed the severity of angiographic CAD by the latest online scoring system using coronary angiogram called SYNTAX score. Third, all the patients included in our study were the nondiabetic or recent onset of diabetes who are not started on any hypoglycaemicdrug yet.
One of the important findings of our study is that the adverse association of metabolic obesity with both prevalence and severity of angiographic CAD were more prominent in subjects with a BMI less than 25.0 (normal weight), as compared to those with BMI of 25.0 or above. Therefore our data suggests that the group with normal BMI was more prone to angiographic CAD than that with a high BMI, in case of Metabolic Obesity status also. Our definition of metabolic obesity was similar to that of existing MetS [16]. So the novelty of our study is that we added weight status to the group along with MO or MetS. It is already known that MetS are associated with CAD and more to the point, classification of MO or MetS might be more meaningful with normal weight subjects than obese according to our findings [17]. Other previous studies also showed that the MONW has trend more adverse cardiac events than MAO group [14]. In particular, we could consider more aggressive pharmacological treatment in MONW patients who need to undergo CAG. Therefore tendency to treat subjects with MO or MetS like others might be feckless. Large and prospective trails will help to settle this issue more definitely. Underweight and normal-weight status subjects were more associated with higher long-term mortality rates and incidence of major cardiovascular events, suggesting that obesity paradox is also manifested in Asian patients with CAD [18].
It is consistent from our study findings that classification based on only BMI does not help to predict the severity and prevalence of angiographic CAD. Other studies have reported that in contrast to normal weight with insulin resistance individual, metabolically healthy obese individuals show decreased heart failure risk in a six-year follow-up study [15]. The different hormonal, metabolically and pro-inflammatory activities of various adipose depots seem to play a major role in understanding this phenomenon [9].
Several mechanisms can explain the association of adverse profile of angiographic CAD with MONW group. First thing is hypertension and hyperglycaemia in the subjects of this group may have contributed to the adverse outcomes. The second thing is WHR is an anthropometric measurement of central obesity which is associated with CVD and mortality and MONW group has higher WHR compared to the other three groups [19]. Our study with those previous studies suggests that central obesity or body fat content might be more clinically important than BMI.
Limitation
We had considered NCEP ATP III Asia specific criteria to define the MO, so our results might vary if we involve other criteria. Second, BMI cut-off points for obesity should be lower for Asian populations than they are for European populations. However, the available data were not sufficient to support Asian-specific cut-off points to define “overweight” and “obese” [20].
Conclusion
The MONW or MO group is associated with the prevalence and severity of angiographic CAD. In particular, MONW group is independently associated with severity of CAD when compared to MHNW group. So, it is important to give more focus on the subjects with MO with normal BMI while assessing the risk factor for angiographic CAD.
*One-way Anova test done. MHNW: Metabolically healthy and normal weight; MONW: Metabolically obese but normal weight; MHO: Metabolically healthy but obese; MAO: Metabolically abnormal obese group, LDL_-C: Low density cholesterol; HSCRP: High sensitive C reactive protein; EGFR: Estimated glomerular filtration rate; HOMA-IR: Homeostatic model assessment insulin resistance
*Non parametric tests carried out by Kruskal wallis one-way Anova test Null hypothesis Syntax score of all the groups are equal, alternate atleast 1 group is not equal.
*p<0.05,**p<0.01,***p<0.001
*Non parametric tests carried out by Mann-Whitney test, MHNW: Metabolically healthy and normal weight, MONW: Metabolically obese but normal weight, MHO: Metabolically healthy but obese, MAO: Metabolically abnormal obese group
[1]. Deepa M, Farooq S, Datta M, Deepa R, Mohan V, Prevalence of metabolic syndrome using WHO, ATPIII and IDF definitions in Asian Indians: the Chennai Urban Rural Epidemiology Study (CURES-34)Diabetes Metab Res Rev 2007 23(2):127-34.10.1002/dmrr.65816752431 [Google Scholar] [CrossRef] [PubMed]
[2]. Weisell RC, Body mass index as an indicator of obesityAsia Pacific Journal of Clinical Nutrition 2002 11:S681-S84.10.1046/j.1440-6047.11.s8.5.x [Google Scholar] [CrossRef]
[3]. Mulhall BP, Ong JP, Younossi ZM, Non-alcoholic fatty liver disease: An overviewJ Gastroenterol Hepatol 2002 17(11):1136-43.10.1046/j.1440-1746.2002.02881.x12453271 [Google Scholar] [CrossRef] [PubMed]
[4]. Reaven GM, Role of insulin resistance in human diseaseDiabetes 1988 37(12):1595-607.10.2337/diab.37.12.15953056758 [Google Scholar] [CrossRef] [PubMed]
[5]. Kwon B-J, Kim D-W, Her S-H, Kim D-B, Jang S-W, Cho E-J, Metabolically obese status with normal weight is associated with both the prevalence and severity of angiographic coronary artery diseaseMetabolism 2013 62(7):952-60.10.1016/j.metabol.2013.01.00623391273 [Google Scholar] [CrossRef] [PubMed]
[6]. Karelis AD, Faraj M, Bastard J-P, St-Pierre DH, Brochu M, Prud’homme D, The metabolically healthy but obese individual presents a favorable inflammation profileThe Journal of Clinical Endocrinology & Metabolism 2005 90(7):4145-50.10.1210/jc.2005-048215855252 [Google Scholar] [CrossRef] [PubMed]
[7]. St-Pierre AC, Cantin B, Mauriège P, Bergeron J, Dagenais GR, Després J-P, Insulin resistance syndrome, body mass index and the risk of ischemic heart diseaseCMAJ 2005 172(10):1301-05.10.1503/cmaj.104083415883404 [Google Scholar] [CrossRef] [PubMed]
[8]. Wildman RP, Muntner P, Reynolds K, McGinn AP, Rajpathak S, Wylie-Rosett J, The obese without cardiometabolic risk factor clustering and the normal weight with cardiometabolic risk factor clustering: prevalence and correlates of 2 phenotypes among the US population (NHANES 1999-2004)Arch Intern Med 2008 168(15):1617-24.10.1001/archinte.168.15.161718695075 [Google Scholar] [CrossRef] [PubMed]
[9]. Coelho M, Oliveira T, Fernandes R, Biochemistry of adipose tissue: An endocrine organArch Med Sci 2013 9(2):19110.5114/aoms.2013.3318123671428 [Google Scholar] [CrossRef] [PubMed]
[10]. Sianos G, Morel M-A, Kappetein AP, Morice M-C, Colombo A, Dawkins K, The SYNTAX Score: An angiographic tool grading the complexity of coronary artery diseaseEuro Intervention 2005 1(2):219-27. [Google Scholar]
[11]. Conus F, Rabasa-Lhoret R, Peronnet F, Characteristics of metabolically obese normal-weight (MONW) subjectsAppl Physiol Nutr Metab 2007 32(1):4-12.10.1139/h06-09217332780 [Google Scholar] [CrossRef] [PubMed]
[12]. Kelishadi R, Cook SR, Motlagh ME, Gouya MM, Ardalan G, Motaghian M, Metabolically obese normal weight and phenotypically obese metabolically normal youths: the CASPIAN StudyJ Am Diet Assoc 2008 108(1):82-90.10.1016/j.jada.2007.10.01318155992 [Google Scholar] [CrossRef] [PubMed]
[13]. Kip KE, Marroquin OC, Kelley DE, Johnson BD, Kelsey SF, Shaw LJ, Clinical importance of obesity versus the metabolic syndrome in cardiovascular risk in women: a report from the Women’s Ischemia Syndrome Evaluation (WISE) studyCirculation 2004 109(6):706-13.10.1161/01.CIR.0000115514.44135.A814970104 [Google Scholar] [CrossRef] [PubMed]
[14]. Meigs JB, Wilson PW, Fox CS, Vasan RS, Nathan DM, Sullivan LM, Body mass index, metabolic syndrome, and risk of type 2 diabetes or cardiovascular diseaseJ Clin Endocrinol Metab 2006 91(8):2906-12.10.1210/jc.2006-059416735483 [Google Scholar] [CrossRef] [PubMed]
[15]. Voulgari C, Tentolouris N, Dilaveris P, Tousoulis D, Katsilambros N, Stefanadis C, Increased heart failure risk in normal-weight people with metabolic syndrome compared with metabolically healthy obese individualsJ Am Coll Cardiol 2011 58(13):1343-50.10.1016/j.jacc.2011.04.04721920263 [Google Scholar] [CrossRef] [PubMed]
[16]. Third Report of the National Cholesterol Education Program (NCEP) Expert Panel on Detection, Evaluation, and Treatment of High Blood Cholesterol in Adults (Adult Treatment Panel III) final reportCirculation 2002 106(25):3143-421.10.1161/circ.106.25.314312485966 [Google Scholar] [CrossRef] [PubMed]
[17]. Kim JY, Mun HS, Lee BK, Yoon SB, Choi EY, Min PK, Impact of metabolic syndrome and its individual components on the presence and severity of angiographic coronary artery diseaseYonsei Medical Journal 2010 51(5):676-82.10.3349/ymj.2010.51.5.67620635441 [Google Scholar] [CrossRef] [PubMed]
[18]. Park HW, Kim KH, Song IG, Kwon TG, Kim WH, Bae JH, Body mass index, carotid plaque, and clinical outcomes in patients with coronary artery diseaseCoron Artery Dis 2017 28(4):278-86.10.1097/MCA.000000000000046728121665 [Google Scholar] [CrossRef] [PubMed]
[19]. Radholm K, Chalmers J, Ohkuma T, Peters S, Poulter N, Hamet P, Use of the waist-to-height ratio to predict cardiovascular risk in patients with diabetes: Results from the ADVANCE-ON studyDiabetes Obes Metab 2018 10.1111/dom.1331129603537 [Google Scholar] [CrossRef] [PubMed]
[20]. WHO Expert ConsultationAppropriate body-mass index for Asian populations and its implications for policy and intervention strategiesLancet (London, England) 2004 363(9403):15710.1016/S0140-6736(03)15268-3 [Google Scholar] [CrossRef]