Children worldwide can reach their growth standard potential if they are reared in healthy environmental circumstances and their caregivers pursue the recommended best care practices and proper nutrition. The nutritional status of children under-five years of age, in terms of energy, proteins and micronutrient status is one of the best predictors of child survival [1-4].
According to Egypt Demographic and Health Survey (EDHS), more than one in four children suffer from some degree of anaemia with prevalence of 27.2%, among children aged 6-59 months compared to 45% according to world health organisation (WHO). In addition, WHO reported that nutritional anaemia is most prevalent in preschool children (47.4%) followed by school children (25.4%) [5,6].
Iron deficiency appears to be a current epidemic in various societies due to insufficient food intake, the early introduction of whole cow’s milk and a consequence of late weaning. Under five years of age children have higher iron requirements in comparison with other age groups as their growth is rapid [7-9].
Evidence-based interventions addressing different forms of malnutrition to improve nutritional status and growth in children should include health-related interventions as nutrition assessment, counselling, caregiver education, multiple micronutrient supplementations. These interventions are complemented by a broader, non-health related approaches as household food security, maternal and child care, and a clean environment [10,11].
The key messages of health-related interventions should address activities to improve poor habits and practices of caregivers during feeding theirs under five years of age children like poor quality foods, inadequate practices, food, and water safety and inadequate breastfeeding practices. Caregiver’s educational intervention primarily depends on Interpersonal Communication (IPC) which employs face-to-face interaction between health educators or service providers and clients. IPC may occur in one-on-one as well as group settings as long as the group is small enough to allow effective interactions between members of the group and the educator. These interactions can occur in a PHC facility or at home [12].
Interventions implemented at the Primary Health Care (PHC) facility level became a core policy for the WHO. Since PHC offers “essential health care” that is based on scientifically sound and socially acceptable methods and technology at a low cost. The key messages of interventions should include activities to improve worthless caregivers’ habits and practices during feeding theirs under five years of age children [13].
Previous studies have succeeded in using different health educational approaches while managing childhood anaemia through promoting dietary diversity, caregivers education and nutrition counselling for families [14].
The present study aimed to test the impact of a nutrition education message delivered to mothers of under-five children presenting with mild anaemia, through encouraging mothers to provide a diverse range of local iron rich food to their anaemic children and thus improving their haemoglobin level.
Materials and Methods
Study Setting
The study was conducted in the PHC of Meet Rahina village, located 50 km west of Cairo governorate, Egypt’s capital city; with a population of nearly 500 000. The PHC offers a package of preventive, promotional, and curative services for women and children.
Study Design and Population
A community-based intervention study was delivered to mothers of children under the age of five years of Meet Rahina village, along a period of one year starting from January 2017.
The number of under-five years of age children in Meet Rahina village was estimated to be 10% of the population, nearly 50 000 [15]. The sample size calculation was based on statistical power (95% confidence level, 5% margin of error, 11% prevalence rate of anaemia according to (EDHS; 2014) and 80% response rate [5]. The minimum recommended size for the target anaemic children were 245 children.
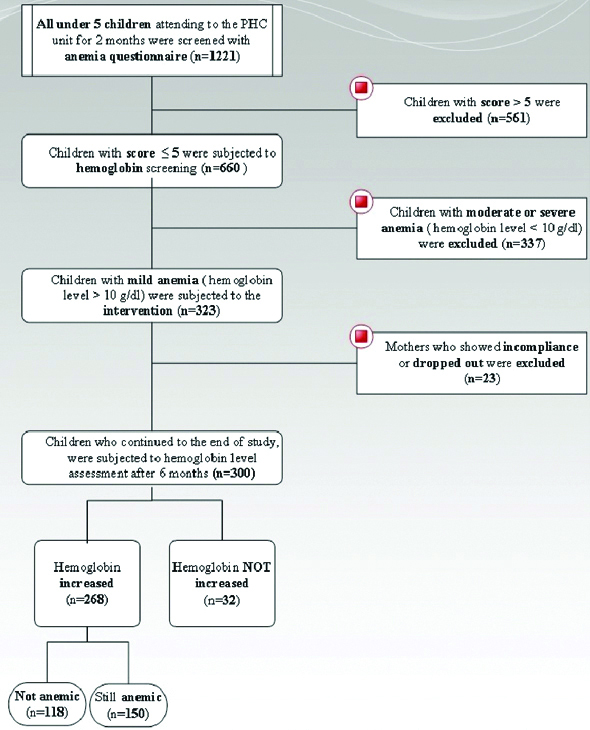
Preparations: Before implementation of the proposed intervention, an in-depth investigation of the current functioning maternal and child health services in the PHC of the village was done. All instruments and procedures needed for the study were standardised and tested by the research team. This phase took two months starting from January 2017. Screening and recruitment are shown in [Table/Fig-1]:
A Flowchart Showing consecutive stages of this community-based intervention.
Phase I
Screening of all children under the age of five years (1220) who were seeking services at the PHC, along a period of two months (March and April 2017) was done by interviewing the mothers or guardians with a constructed interview questionnaire including:
a) Socio-demographic characteristics of the child such as name, sex, age, mother’s name, address, telephone number, parents’ education, occupation and income.
b) Anaemia questionnaire developed by Eastern Oregon University Head Startin USA was used. Internal consistency reliability for the questionnaire, using Cronbach’s alpha ranged from 0.788-0.827. The three questions related to Women, Infant, and Children program (WIC) in USA were: whether the child is currently enrolled in the (WIC) program, whether the child is currently being treated or followed by WIC or a physician for the diagnoses of being anaemic and whether child enrolled in the WIC program at 24-months of age [16]. Since WIC was not implemented in health services in Egypt, the questionnaire was applied after excluding these three questions only. The questionnaire was translated into Arabic, and checked by three public health and paediatrics professors to ensure validity and keeping the original meanings of the end point of the questions. A pilot study was carried out to measure acceptability, the time needed for questionnaire filling and way of data collection.
Construct validity: Construct validity was checked on basis of the experience of study investigators, extensive consultative processes and previous research conducted in PHC and rural communities prior to data collection.
Face validity: Face validity was measured using some clients’ opinion and no items were changed on basis of their feedback. The total score of the questionnaire was 17. A score of ≤5 means children were at risk for anaemia. Results revealed that 660 children were at risk of anaemia with a total score of ≤5.
Phase II
Screening by laboratory investigations was done among the previous sample of 660. Points of contact with the study population were in the form of the already existing child-oriented national programs such as immunisation, monitoring of growth and development, and management of mild morbidity problems.
Laboratory Investigations
Complete blood picture by using Mindray Automatic Cell Counter PC 2800.
The first haemoglobin measurement was part of the assessment that was done when the child was suspected to be anaemic (gets score ≤5 by anaemia questionnaire) to classify him normal, mild, moderate or severe anaemia and to exclude any blood diseases that may cause anaemia. Mild anaemia was defined as haemoglobin level 10-11.9 g/dL, moderate anaemia as haemoglobin 7-9.9 g/dL and severe anaemia as haemoglobin <7 g/dL [17]. The second haemoglobin measurement was done at the end of intervention. Haemoglobin was measured using a portable haemoglobin meter instrument (Haemo Cue Ltd., Angelholm, Sweden). A drop of capillary blood was collected from the fingertip of each child and the readings were obtained within half a minute and estimated to an accuracy of 1 g/dL.
Urine analysis: To exclude blood in urine, proteinuria, and casts using a direct microscopic examination of the urine sample after its centrifugation.
Stool analysis: To exclude blood in stool and parasitic infestation using the Kato–Katz test [18].
Inclusion Criteria
Inclusion Criteria for the Study Population who were Recruited for the Intervention of mothers of children under the age of five and their children with a score ≤5 by anaemia questionnaire, with mild anaemia, normal stool, and urine analysis findings were included in the study. Finally, 323 children and their mothers were eligible, approached and accepted to participate in the intervention.
Exclusion Criteria
Mothers of under five years of age children and their children, who take multivitamins, with a haemoglobin level less than 10 gm/dL (moderate or severe anaemia), with blood diseases that lead to anaemia (evidenced by history and complete blood picture). Children with abnormal stool or urine analysis were excluded from the study.
Phase III
Target children were subjected to the following:
Assessing the general condition was done by clinical examination.
Anthropometric measures: The child’s weight and height were measured twice and the average of the two measurements was used. The supine length was measured for children <2 years of age and standing height for children >2 years of age. Height and weight were recorded for children without shoes and wearing light clothes, standing straight, with their weight uniformly distributed on both feet and their arms hanging freely at their sides. Weights were measured using electronic scales and heights were measured using length boards. For children over two years of age, height sticks were used. Weight, height, and age data were used to calculate z-scores of the three different nutritional indicators in comparison to the newly published World Health Organisation/National Centre for Health Statistics (WHO/NCHS) reference population [19], using the WHO Anthro Plus Software (Version 10.4, 2010).
These indicators were underweight, defined as weight-for-age Z-score (WAZ) <±2 SD, stunting defined as height-for-age Z-score (HAZ) <±2SD, and wasting defined as weight-for-height Z-score (WHZ) <±2SD [19]. Intervention:
All mothers participating in the study were granted a course of two sessions entitled “Infant Nutrition and Anaemia”. Authors hypothesised that this intervention would lead to enhanced feeding practices, dietary intakes, improve the haemoglobin level of the children with mild anaemia [Table/Fig-2] [20,21].
Health education intervention.
| Program title: | Infant Nutrition and Anaemia |
|---|
| Goal: | Improve the haemoglobin level of the children under the age of 5 with mild nutritional anaemia to reach or exceed 11 mg/dL. |
| Objectives: | 1-To increase awareness of mothers towards anaemia of the children under the age of 5. |
| 2-To provide basic information to mothers about the importance of anaemia control. |
| Teaching methodology: | Group health education through mini lecture and open discussion. |
| Tools used: | Picture-rich booklets, power point presentation and TV movies. These tools were copied and gifted to the PHC staff (doctors, nurses, dieticians) at the end of the study to be used in health education for ensuring continuity of the message and maintaining the aim of the study. |
| Activities during session: | The session started by registration of the attending mothers, greeting them for their attending, explaining the message of the session and finally review key ideas covered during each session. |
| Messages of 1st session: | To explain to mothers what is nutritional anaemia, its risk factors, clinical picture, functional consequences of iron deficiency on physical and mental development, sources of iron. |
| Messages of 2nd session: | To explain to mothers nutritional guidelines for managing anaemic child, breastfeeding, feeding during infancy. |
| Evaluation method: | 1-Verbal feedback during and immediately after the sessions. |
| 2-Subjective questionnaire filled by the mother immediately after the sessions i.e. happy sheets (where participants circle a happy face or sad face for each question). |
An announcement was done before starting the nutritional, health education sessions by about one week with the aid of the members of the PHC unite and or mosques, supported by advertising posters located at different places in the village.
Regular announcement for the health education sessions were done. This helped in accepting the idea, alleviation of confusion of mothers and increasing their attendance.
Sessions: Sessions for group health education were scheduled for each Saturday and Wednesday, every week for six months. Recording of the participants’ names and addresses was done before the start of each session to ensure their attendance. The educational sessions were standardised since they were lead only by the researchers themselves. They were held in a meeting room at Meet Rahina health unit, which is of an adequate area about 85 m2, well ventilated, adequately lighted and prepared by an adequate number of chairs, microphone, T.V., and receiver. The average time for each session was about 45-minutes. Attending mothers per session were within 6-10. A total number of 40 group health education sessions, were needed throughout the study duration, to cover the target 323 mothers. The boredom of waiting mothers, forgetfulness or lack of interest in the topic may be the factors which resulted in the drop out of 23 mothers and their children from the study and they were excluded.
Ethical Disclosures
Approval of the study protocol was obtained from the Ethical Committee at the Faculty of Medicine, Cairo University. The protocol was examined and registered in December 2016 with the report number N-56-2016. Required permissions for conducting the study were obtained from the local health authorities and the PHC management. Informed consent was obtained directly from enrolled mothers of children before data collection and after explanation of the study objectives. All procedures for data collection were treated with confidentiality.
Statistical Analysis
Epi-infoTM version 7.0 software was used for the initial sample size calculation in the first survey. Collected data were entered and analysed using the Statistical Package for Social Science (SPSS) software program, version 21.0 IBM.
Tests of normality of data (like Shapero-Wilk test) revealed that data was not normally distributed. That’s why non-parametric tests like Mann–Whitney test and Kruskal-Wallis test were used while comparing groups to quantify the associations of continuous variables. In the case of categorical variables, the chi-square test was used. To evaluate the impact of the intervention, haemoglobin percent change was calculated as an indicator of the change in the health status of the children (i.e., Haemoglobin (Hb) % change}={(Hb after – Hb before)÷Hb before×100}.
Spearman’s correlation coefficient was used to detect the correlation between haemoglobin percent change and continuous variables like age of the child (months), the age of mothers (years), weight, height and the Z scores (WAZ, HAZ, and WHZ).
A statistically significant association was indicated by p-value ≤0.05.
Results
Socio-demographic characteristics revealed that most of the children’s fathers (73.3%) and mothers (60.7%) received high education (diploma or university graduates) with family income either totally insufficient for the living (40%) or almost sufficient and the family can’t save (45%) [Table/Fig-3].
Socio-demographic characteristics of the studied population (n=300).
| Demographic characteristics* | Description (n=300) |
|---|
| Age of child (months) mean±SD | 41.6±10 |
| Age of mothers (years) mean±SD | 25±3 |
| Sex (n (%)) |
| Male | 141 (47) |
| Female | 159 (53) |
| Father’s education† |
| Low | 80 (26.7) |
| High | 220 (73.3) |
| Father’s occupation n (%) |
| Unskilled | 18 (6) |
| Skilled | 95 (31.7) |
| Clerk | 162 (54) |
| Professional | 25 (8.3) |
| Mother’s education† n (%) |
| Low | 118 (39.3) |
| High | 182 (60.7) |
| Mother’s occupation n (%) |
| Unskilled | 62 (20.7) |
| Skilled | 50 (16.7) |
| Clerk | 86 (28.7) |
| Professional | 89 (29.7) |
| House wife | 13 (4.3) |
| Monthly income*** n (%) |
| Insufficient | 120 (40) |
| Sufficient and can’t save | 135 (45) |
| Sufficient and can save | 45 (15) |
| Crowding index** n (%) |
| ≥3 | 97 (32.3) |
| <3 | 203 (67.7) |
*Qualitative variables described as number (percentage), while quantitative ones described as mean±SD (Standard deviation); **Crowding index=Number of individuals÷Number of rooms; ***Income answers were ordinal choices because participants refused to specify the income; †Education was specified as follows: -High education (diploma or university graduates), -Low education (primary or preparatory or secondary grades)
Pallor (20.7%) was the most prevalent abnormal clinical finding while for malnutrition disorders, wasting was (8%) followed by stunting and underweight respectively [Table/Fig-4].
Anthropometric measures, clinical findings and haemoglobin level of the studied children (n=300).
| Variables | Description (n=300) |
|---|
| Anthropometric measures mean±SD |
| Weight (kg) | 15.6±2.1 |
| Height (cm) | 101.2±8.5 |
| *BMI | 15.3±1.5 |
| **WAZ | 0.3±0.7 |
| ***HAZ | 0.9±1.1 |
| ****WHZ | -0.5±1.1 |
| Malnutrition disorders n (%) |
| Underweight | 4 (1.3) |
| Stunting | 5 (1.7) |
| Wasting | 24 (8) |
| Abnormal clinical findings n (%) |
| Pallor | 62 (20.7) |
| Skin manifestations † | 3 (1) |
| Breathlessness | 6 (2) |
| Chest Deformities | 3 (1) |
| Heart Murmurs | 5 (1.7) |
| Haemoglobin level mean±SD |
| Haemoglobin level before intervention | 10.4±0.2 |
| Haemoglobin level after intervention | 10.7±0.4 |
| Haemoglobin % change†† | 2.5±1.8 |
| Children with increased haemoglobin level n (%) | 268 (89.3) |
| Children with normal haemoglobin level n (%) | 118 (39.3) |
*BMI: Body mass index; **Weight for Age Z-score; ***Height for Age Z-score; ****Weight for Height Z-score; †Skin manifestations {angular stomatits-epithelial changes as platynychia (flat nails) or koilonychias (spoon shaped nails)}; ††Haemoglobin (Hb) % change={(Hb after – Hb before)÷Hb before}×100
The mean of the haemoglobin percent change was 2.5±1.8. The majority of the children (89.3%) whose mothers received the intervention evinced haemoglobin improvement [Table/Fig-4].
Comparing socio-demographic variables suggested having a possible effect on haemoglobin improvement like: parent’s occupation revealed that the mean of the haemoglobin percent change was significantly higher among children whose fathers worked in professional jobs (4±1.1) and those whose mothers were housewives (4.2±1.1). (p-value ≤0.001) [Table/Fig-5]. Families whose monthly income was sufficient with saving ability and those who lived in houses with crowding index <3 individuals per room displayed significantly higher mean haemoglobin percent change (p-value ≤0.001) [Table/Fig-5].
Factors determining haemoglobin percent change (n=300).
| Variables | Haemoglobin % change | p-value* |
|---|
| Demographic characteristics | | |
| Sex | Male | 2.4±1.7 | 0.716 |
| Female | 2.6±1.8 |
| Father’s education | Low | 2.3±1.7 | 0.272 |
| High | 2.6±1.8 |
| Father’s occupation | Unskilled | 1.2±0.9 | <0.001 |
| Skilled | 2.7±1.8 |
| Clerk | 2.3±1.8 |
| Professional | 4±1.1 |
| Mother’s education | Low | 2.3±1.8 | 0.112 |
| High | 2.7±1.8 |
| Mother’s occupation | Unskilled | 2.6±1.8 | 0.008 |
| Skilled | 2.1±1.6 |
| Clerk | 2.3±1.9 |
| Professional | 2.6±1.6 |
| House wife | 4.2±1.1 |
| Monthly income | Insufficient | 1.1±1.1 | <0.001 |
| Sufficient and can’t save | 3.2±1.6 |
| Sufficient and can save | 4.2±0.9 |
| Crowding index | ≥3 | 1.1±1.2 | <0.001 |
| <3 | 3.2±1.6 |
| Malnutrition disorders |
| Underweight | Yes | 3±2.1 | 0.646 |
| No | 2.5±1.8 |
| Stunting | Yes | 1.7±1.8 | 0.350 |
| No | 2.5±1.8 |
| Wasting | Yes | 2.8±2 | 0.542 |
| No | 2.5±1.7 |
| Abnormal clinical findings |
| Pallor | Yes | 2.4±1.8 | 0.426 |
| No | 2.5±1.8 |
| Skin manifestations | Yes | 4.7±0.9 | 0.032 |
| No | 2.5±1.8 |
| Breathlessness | Yes | 2.1±2 | 0.519 |
| No | 2.5±1.8 |
| Chest Deformities | Yes | 1.9±1.9 | 0.531 |
| No | 2.5±1.8 |
| Heart Murmurs | Yes | 2.2±2.2 | 0.785 |
| No | 2.5±1.8 |
*Either mann-whitney test or kruskal-wallis test were used (p<0.05; p<0.01; p< 0.001 are statistically significant)
Meanwhile, no statistically significant differences were detected between the means of the haemoglobin percent change on basis of malnutrition disorders. The only clinical manifestation which showed a statistically significant difference for the mean of haemoglobin percent change was abnormal skin manifestations (p-value=0.032) [Table/Fig-5]. The [Table/Fig-6] demonstrated a positive, significant relationship between the mean of the haemoglobin percent change and the mean of the haemoglobin level before the intervention and weight for age z-score. (p-value ≤0.001).
Correlation between haemoglobin % change with age, anthropometric measures and haemoglobin level before intervention (n=300).
| Variables | Correlation coefficient (r) | p-value* |
|---|
| Age of child (months) | -0.035 | 0.545 |
| Age of mothers (years) | 0.042 | 0.472 |
| Weight (kg) | 0.060 | 0.301 |
| Height (cm) | -0.009 | 0.880 |
| BMI | 0.061 | 0.292 |
| WAZ | 0.185 | 0.001 |
| HAZ | 0.071 | 0.223 |
| WHZ | 0.070 | 0.230 |
| Haemoglobin level before intervention | 0.622 | <0.001 |
(r)*= Spearman correlation test. (*p<0.05; p< 0.01; p<0.001 are statistically significant)
Discussion
On basis of haemoglobin measurement, the percent of mild anaemic children in the current study was 49%. This is in concordance with previous studies that investigated iron deficiency anaemia in another Egyptian governorate like Alexandria governorate which estimated under five years of age anaemic children to be 52.2% and El Fayoum governorate to be 64% [22,23]. By the end of the current study educational intervention, 56% of the children became no more anaemic with haemoglobin level >11 mg/dL thus haemoglobin percent change showed significant increase. Such enhancements are consistent with several studies that proved the significant effect of various nutritional educational programs on improving haemoglobin level [24-26]. A study was done in Egypt by Abdel-Rasoul Gafar M et al., who conducted a maternal nutritional education program for prevention and control of anaemia among under five children, reported that one of the major factors responsible for anaemia was inadequate nutrition [22]. Another interventional study done in India by Jayanta S et al., to study and improve nutritional knowledge of rural women regarding iron deficiency anaemia, displayed the need to use intervention measures as nutritional education approaches for addressing major preventable causes of anaemia [27]. A similar study was done in Karnataka state, India (2015) aiming to promote maternal anaemia awareness and dietary modifications to increase children iron intake. Their study showed improved haemoglobin values and reduced anaemia prevalence among 12-59 month children in the short term. [25] Another study done in Sao Paulo, Brazil (2010) to evaluate the effect of a proposed training, supported the present finding; where anaemia was chosen as an indicator of the change in the health status of the children, and the risk factors studied were based on the effects of anaemia [28]. A similar study performed in Maharashtra, India (2011) where there was a significant reduction in the prevalence of nutritional anaemia from 78.2% to 64.2% among the children. The awareness of iron-rich food items among the mothers got better with the nutrition education sessions [29].
In the current study, majority of the children’s parents received a high education (Diploma or University grade). Since education makes parents or caregivers refuse faulty traditional practices, improve their ability to understand and respond to nutrition behaviour change messages, thus, become more receptive to alternative food preparation methods. Nutrition educational intervention can increase or refresh educated parent’s nutrition and food science-related knowledge. The educated counselled parents especially mothers can serve as agents of change [30,31].
In the same context, the higher levels of haemoglobin improvement were significantly noticed among children whose family’s monthly income was sufficient with or without saving ability. The data reported by the Central Agency for Public Mobilisation And Statistics (CAPMAS) 2017 in Egypt, revealed an increasing trend of the national poverty line (i.e. the cost of obtaining basic goods and services to the individual or family) to become 29.5 thousand L.E. per family. Meanwhile, the average annual family income in Egyptian rural areas remains low at 26.8 thousand L.E. per family [15].
The significantly higher levels of haemoglobin improvement were observed among children whose fathers worked in professional jobs with sufficient income and those whose mothers were housewives. Fathers’ professional occupation is translated to increased household income, which in turn ensures adequate nutrition, with adequate food in the right quantity and quality and access to child health facilities. Also, housewives have better chances of child care [31].
Meantime, the significantly higher levels of haemoglobin improvement were observed among children who lived in houses with crowding index less than three individuals per room. This coincides with the data reported by (EDHS) 2014 which revealed that 22% of Egyptian households have only one room that is used for sleeping in their dwelling, 60 % live in a dwelling with two rooms for sleeping [5]. Substandard housing has a direct impact on child health as they influence the transmission of infectious diseases to children. Houses with insufficient access to safe water and good sanitation facilities serve as important barriers to appropriate hygiene practices and safe preparation of complementary foods [32].
Limitation
While conducting the study, some administrative and human barriers were perceived. Administrative barriers included difficulty in obtaining well-organised, updated computerised or at least manual database of the families in the village from the local health authority. Human barriers were mainly in the form of local, inherited culture of the mothers which created resistance to change the traditional nutritional behavior of some of them. Moreover; family, peers, media, environment influenced the dietary habits of some participants.
Conclusion
Higher levels of haemoglobin improvement were observed among under five years of age children whose parents were educated, worked in suitable jobs, living in adequate houses, with sufficient monthly income since they’re more likely to receive quality nutrition and health services care. Practically, knowledge acquired through educational intervention is translated into better children feeding practices.
*Qualitative variables described as number (percentage), while quantitative ones described as mean±SD (Standard deviation); **Crowding index=Number of individuals÷Number of rooms; ***Income answers were ordinal choices because participants refused to specify the income; †Education was specified as follows: -High education (diploma or university graduates), -Low education (primary or preparatory or secondary grades)
*BMI: Body mass index; **Weight for Age Z-score; ***Height for Age Z-score; ****Weight for Height Z-score; †Skin manifestations {angular stomatits-epithelial changes as platynychia (flat nails) or koilonychias (spoon shaped nails)}; ††Haemoglobin (Hb) % change={(Hb after – Hb before)÷Hb before}×100
*Either mann-whitney test or kruskal-wallis test were used (p<0.05; p<0.01; p< 0.001 are statistically significant)
(r)*= Spearman correlation test. (*p<0.05; p< 0.01; p<0.001 are statistically significant)