World Health Organisation defines “Anaemia is a condition in which the number of red blood cells or their oxygen-carrying capacity is insufficient to meet physiological needs, which vary by age, sex, attitude, smoking and pregnancy status” [1]. Worldwide, IDA is the prevalent type which contributes 50% of the total anaemia. Other conditions including folate, Vitamin A and vitamin B12 deficiencies, intestinal parasites especially hookworm infestations, chronic inflammation, malaria and poor bioavailability of dietary iron can also cause anaemia [1,2].
IDA is considered as one of the most common public health problem which affects low, middle and high level countries and it also affects all age groups including infants, adolescents, reproductive age group women and elderly people [3,4]. Iron is an important element required for the synthesis of haemoglobin. A high demand for iron is required during menstrual blood loss, pregnancy and lactaton. Any divergence in the demand leads to nutritional deficiencies, which is the most common causes of iron deficiency in reproductive age group women. IDA in reproductive age group not only affects their cognitive and motor development, it also affects their productivity like low birth weight and increased risk of perinatal and maternal mortality [3,4]. Although the diagnosis of anaemia is relatively simple, it may go undiagnosed for a long time because of its nonspecific clinical signs [5].
Worldwide around 1.7 billion people are affected by IDA with the global prevalence of 25.1%. The prevalence of anaemia was highest among Asian people followed by Africans [6]. The prevalence rates for reproductive age group pregnant women and non-pregnant women are 29% and 38%, respectively; however, among different age group people, reproductive age group women were commonly affected which is nearly 468 million [7].
Compared with global scenario, India has highest prevalence of IDA among reproductive age group women [8]. As per National Family Health Survey-4 (NFHS-4) in Tamil Nadu, prevalence of anaemia among non-pregnant women and pregnant women were 55.4% and 44.4% respectively [8]. Similarly urban-rural differences were also found in the prevalence [7]. Knowing the importance of consequences of anaemia, in 2012 World Health Assembly made a resolution and endorsed a “Comprehensive implementation plan on maternal, infant and young child nutrition”. This plan has six global nutrition targets to be achieved in 2025 and second target specifically emphasising on 50% reduction of anaemia in reproductive age group women [9].
In India, prevalence of anaemia and its associated factors among reproductive age group women have largely been overlooked. Incorporating these findings would help us in having in-depth understanding of the effect of disease on various dimensions of health. With these vacuities in literature, this study was conducted to find the prevalence of IDA and its associated factors among reproductive age women in a rural area of Karaikal, Puducherry, India.
Materials and Methods
A cross-sectional study was done in Serumavilangai village, the rural field practice area of Department of Community Medicine, Vinayaka Mission Medical College and Hospital, Karaikal during November 2015 to April 2016. Reproductive age group women of 18 to 45 years residing at Serumavilangai Village, Karaikal at the time of study were included. Unwilling participants and participants not available after two consecutive visits were excluded for the study. Ethical clearance was obtained from institutional human ethical committee before conducting the study.
Sample Size and Sampling Procedure
Sample size was calculated by using the following formula, n=(zα)2pq/l2, with 5% absolute error and 95% confidence. Considering the prevalence of anemia among reproductive age women in rural Puducherry is 54.8% [8]. Sample size was calculated to be around 436 (including 10% non-response rate).
Simple random sampling was done to select houses in the village. Reproductive age group women (18-45 years of age) from the village were selected. One member of each randomly selected house was interviewed. If the house was locked or no member is fulfilling the inclusion criteria in the house or participants not available after two consecutive visits, again random selection was done to select the study subjects.
Data Collection Procedure
The importance of the study was explained by the trained staff nurse to the participants in their local language and informed written consent was obtained. Socio-demographic health survey questionnaire was developed to collect information’s like economic details, social data, family history, marital and pregnancy history and contraception history.
During the data collection period, measurement like height and weight were recorded as per the standard guidelines. The height was measured using a portable height measuring device (Stadiometer Galaxy 214) in standing position without their footwear, with heels together and their head positioned straight. A standard calibrated weighing machine was used for taking weight. The zero error was checked for and removed before starting the examination. The weight and height were recorded to the nearest 0.1 kg by weighing scale and 0.5 cm by measuring scale respectively. Body Mass Index (BMI) was calculated using the following formula: weight in kg/height in metre square. All the readings were made by the same observer to avoid inter-observer variation.
Blood sample was collected by a trained laboratory technician from all the reproductive age group women and haemoglobin concentration was analysed by using cyan-methemoglobin method. Severity of anaemia was graded as per WHO criteria. Levels of haemoglobin in different categories was defined as follows: a) Severe anaemia <7 g/dL; b) Moderate anaemia 7-9.9 g/dL; c) Mild anaemia in pregnant women 10-10.9 g/dL; mild anaemia in non-pregnant women 10-11.9 g/dL [1].
The nutritional status of each participant was explained to them and health education regarding nutritional habits was given at the end of the study. Women who found anaemic were referred to the health facility and proper treatment was given.
Statistical Analysis
The data was analysed using Statistical Package for the Social Sciences software for Windows (SPSS Inc., Chicago, Illinois, USA) version 17.0. Percentages, ratios and frequencies were applied for descriptive analysis. Chi-square test was done. Subject confidentiality was maintained during and after information collection.
Results
Socio-Demographic Information
A total 436 reproductive age group women participated in the study. The mean age of the participants was 30.5±5.6 years. Majority of the participants were from the age group of 21-30 years (39.4%) followed by 41 to 45 years (30%). About 59% of them belonged to Hindu religion followed by Muslim (36.9%). More than three fourth of the reproductive age group females were educated till 12th standard (10.8% graduate and above; 63.5% till 12th standard) and only one fourth of them were illiterate in the present study. Most of the study participants were housewives (53.9%) and they belong to class III and IV socio-economic status as per Modified BG Prasad classification [Table/Fig-1] [10].
Socio-demographic information of the study participants (n=436).
| Characteristics | Response n (%) |
|---|
| Age in years | 18-20 | 27 (6.2) |
| 21-30 | 172 (39.4) |
| 31-40 | 106 (24.4) |
| 41-45 | 131 (30) |
| Religion | Hindu | 258 (59.2) |
| Muslim | 161 (36.9) |
| Christian | 17 (3.9) |
| Literacy status | Illiterate | 112 (25.7) |
| Upto 12th std | 277 (63.5) |
| Graduation and above | 47 (10.8) |
| Occupation | Housewife | 235 (53.9) |
| Government job | 13 (3) |
| Private job | 54 (12.4) |
| Self-employment | 32 (7.3) |
| Labourer/farmer | 102 (23.4) |
| Socio-economic status* | I | 48 (11) |
| II | 79 (18.1) |
| III | 152 (34.9) |
| IV | 96 (22) |
| V | 61 (14) |
*Socio economic status classified as per modified BG Prasad classification
Reproductive Status Information
Majority of the study participant’s menarche status was not-pregnant/not-breastfeeding (95.9%). The mean age of marriage was 21.7±2.8 years, majority of the women were married at the age group of 21 to 30 years (89.9%). The mean age of first pregnancy was 22.4±1.7 years and 6.4% of them had their first pregnancy under the age of 20. The mean number of live children among study participants was 2.1±0.8. Current use of contraception among study participant including permanent and temporary methods was 41.3% (16.1% condom, 14.9% tubal ligation, 5.3% Intra-Uterine Device and 5% Oral Contraceptive Pills) [Table/Fig-2].
Reproductive information of the study participants (n=436).
| Characteristics | Response n (%) |
|---|
| Age of marriage (years) | ≤20 | 32 (7.3) |
| 21-30 | 392 (89.9) |
| >30 | 12 (2.8) |
| Age of first pregnancy (years) | ≤20 | 28 (6.4) |
| 21-30 | 394 (90.4) |
| >30 | 14 (3.2) |
| Number of pregnancies | 0-2 | 344 (78.9) |
| >2 | 96 (22) |
| Number of live children | 0-2 | 351 (80.5) |
| >2 | 85 (19.5) |
| Current contraception status | None | 256 (58.7) |
| Condom | 70 (16.1) |
| Oral Contraceptive Pills | 22 (5) |
| Intra Uterine Devices | 23 (5.3) |
| Tubectomy | 65 (14.9) |
| Current Menarche Status | Pregnant | 11 (2.5) |
| Breast feeding | 7 (1.6) |
| Not Pregnant/Not Breast feeding | 418 (95.9) |
Prevalence of Iron Deficiency Anaemia
The prevalence of IDA among study participants was 35.9%. Their different levels of severity of anaemia were as follows: 23.6% with mild anaemia, 8.9% with moderate, and 3.4% with severe anaemia. The mean haemoglobin level among the participants was 11.9±3.6 g/dL [Table/Fig-3].
Severity of anaemia among study participants (n=436).
| Severity of anaemia | n (%) |
|---|
| Normal | 279 (64.1) |
| Mild* | 103 (23.6) |
| Moderate** | 39 (8.9) |
| Severe*** | 15 (3.4) |
*mild-pregnant women: 10-10.9 g/dL/ non pregnant women: 10-11.9 g/dL; **moderate– 7-9.9 g/dL; ***severe- <7 g/dL
Associated Factors for Iron Deficiency Anaemia
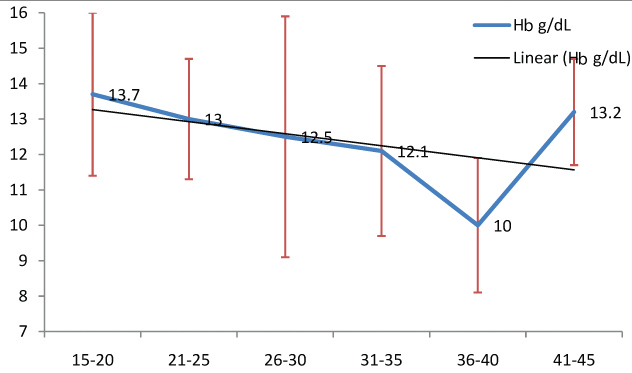
The highest prevalence (51.9%) of IDA was reported in the age group of 31 to 40 years, while lowest prevalence (24.4%) was found in the age group of 41-45 years with significant association (p<0.001) [Table/Fig-4]. Negative linear trend of association was found between mean haemoglobin level (g/dL) with age group from 18 to 40 years [Table/Fig-5]. Significant association was also found between socio-demographic variables and anaemic status of the reproductive age group women in terms of religion, literacy status, occupation and socio-economic status with p-value <0.001 [Table/Fig-4].
Association of socio-demographic variables with anaemic status (n=436).
| Characteristics | Anaemicn (%)n=157 | Not anaemicn (%)n=297 | Chi-squarevaluep-value |
|---|
| Age in years | 18-20 (n=27) | 8 (29.6) | 19 (70.4) | 19.69<0.001 |
| 21-30 (n=172) | 62 (36.1) | 110 (63.9) |
| 31-40 (n=106) | 55 (51.9) | 51 (48.1) |
| 41-45 (n=131) | 32 (24.4) | 99 (75.6) |
| Religion | Hindu (n=258) | 89 (34.5) | 169 (65.5) | 9.14<0.001 |
| Muslim (n=161) | 67 (41.6) | 94 (58.4) |
| Christian (n=17) | 1 (5.9) | 16 (94.1) |
| Literacy status | Illiterate (n=112) | 53 (47.3) | 59 (52.7) | 13.79<0.001 |
| Upto 12th std (n=277) | 96 (34.7) | 181 (65.3) |
| Graduation and above (n=47) | 8 (17) | 39 (83) |
| Occupation | Housewife (n=235) | 79 (33.6) | 156 (66.4) | 31.39<0.001 |
| Government job (n=13) | 1 (7.7) | 12 (92.3) |
| Private job (n=54) | 9 (16.7) | 45 (83.3) |
| Self-employment (n=32) | 11 (34.4) | 21 (65.6) |
| Labourer/ farmer (n=102) | 57 (55.9) | 45 (44.1) |
| Socio-economic status* | I (n=48) | 6 (12.5) | 42 (87.5) | 91.35<0.001 |
| II (n=79) | 11 (13.9) | 68 (86.1) |
| III (n=152) | 99 (65.1) | 53 (34.9) |
| IV (n=96) | 23 (24) | 73 (76) |
| V (n=61) | 18 (29.5) | 43 (70.5) |
*socio economic status classified as per modified BG Prasad classification
Level of mean haemoglobin (95% CI) between different age groups.
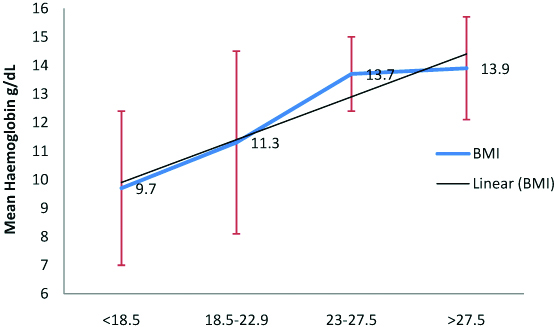
The highest prevalence of IDA was found among women who were married before 20 years (71.9%) and were pregnant with first child before 20 years (67.9%) with significant association (p<0.05). Similarly women who had more than two pregnancies (74%) and also more than two live children (82.3%) have higher prevalence of IDA (p<0.05). Regarding contraception usage, highest prevalence was found among those who did not use any method of contraception (47.7%) [Table/Fig-6]. Decreasing trend of IDA was found with increasing BMI. Also, linear relationship was found between increasing mean haemoglobin level with increasing BMI status [Table/Fig-7,8].
Association of reproductive information with anaemic status (n=436).
| Characteristics | Anaemic n (%) | Not anaemic n (%) | Chi-square value p-value |
|---|
| Age of marriage (years) | ≤20 (n=32) | 23 (71.9) | 9 (28.1) | 22.67 <0.001 |
| 21-30 (n=392) | 127 (32.4) | 265 (67.6) |
| >30 (n=12) | 7 (58.3) | 5 (41.7) |
| Age of first pregnancy (years) | ≤20 (n=28) | 19 (67.9) | 9 (32.1) | 13.68<0.001 |
| 21-30 (n=394) | 132 (33.5) | 262 (66.5) |
| >30 (n=14) | 6 (42.9) | 8 (57.1) |
| Number of pregnancies | 0-2 (n=344) | 86 (25) | 258 (75) | 85.75 <0.001 |
| >2 (n=96) | 71 (74) | 21 (26) |
| Number of live children | 0-2 (n=351) | 87 (24.8) | 264 (75.2) | 78.38 <0.001 |
| >2 (n=85) | 70 (82.3) | 15 (17.7) |
| Current contraception status | None (n=256) | 122 (47.7) | 134 (52.3) | 42.39 <0.001 |
| Condom (n=70) | 14 (20) | 56 (80) |
| Oral Contraceptive Pills (n=22) | 9 (41) | 13 (59) |
| Intra Uterine Devices (n=23) | 4 (17.4) | 19 (82.6) |
| Tubectomy n=65) | 8 (12.3) | 57 (87.7) |
| Current Menarche Status | Pregnant (n=11) | 3 (27.3) | 8 (72.7) | 1.860.394 |
| Breast feeding (n=7) | 1 (14.3) | 6 (85.7) |
| Not Pregnant/ Not Breast feeding (n=418) | 153 (36.6) | 265 (63.4) |
Association between body mass index and anaemic status of reproductive age group women (n=436).
| Characteristics | Anaemic n (%) | Not Anaemic n (%) | Chi-square value p-value |
|---|
| Body Mass Index | <18.5 (n=83) | 52 (62.7) | 31 (37.3) | 39.73 <0.001 |
| 18.5-22.9 (n=127) | 48 (37.8) | 79 (62.2) |
| 23-27.5 (n=132) | 39 (29.5) | 93 (70.5) |
| >27.5 (n=94) | 18 (19.1) | 76 (80.9) |
Level of mean haemoglobin (95% CI) between different categories of body mass index.
Discussion
The present study was done in Serumavilangai village in Karaikal district. The principal focus of the study was to assess the prevalence of IDA and its associated factors among reproductive age group women in the study village.
As per 2011 census in Pondicherry, the literacy status among females were 71% [11]. In our present study, 74.3% of the reproductive age females were literate, which was similar to the studies conducted in Tamil Nadu (72%) and Haryana (75%) [12,13]. Whereas the study conducted in Orissa [14] reported low literacy rate (31.3%). This shows that literacy rate is high in the study area compared to that of census. The mean age of the participants was 30.5±5.6 years which was similar to the study conducted in Haryana and Orissa [14,15]. Regarding occupation in the present study, majority of them were Housewives (53.9%) followed by farmer/labourer (23.4%). This stresses the fact that predominant reproductive age group females were involved in house making and not employed in any works.
In the current study, majority of the study participant’s menarche status was not-pregnant/not-breastfeeding (95.9%). The mean age of first pregnancy was 22.4±1.7 years, while 6.4% of them had their first pregnancy under the age of 20 which was similar to the study conducted by Mangla M et al., [13]. The mean number of live children among study participants was 2.1±0.8 which was higher than the Net Reproductive Rate of Pondicherry (1.8) [11]. More than 50% of the study participants were not using any methods of contraception which was similar to National Family Health Survey-4 Tamilnadu (48%) [8]. This shows that the awareness on contraception methods were very low in the study area.
The prevalence of IDA in this study is 35.9%, which was lower than NFHS-4 Tamilnadu (54.8%) and India (53%) [8]. In contrast to our study, prevalence of IDA was high (60-72%) in Tamilnadu, Orissa, Karnataka, Haryana, Bangladesh and Iran [12-19]. [Table/Fig-9] describes the prevalence of degrees of anemia among various states in India [8,12-16,20]. The variation might be due to difference in the cultural practices and health services received by the study participants.
Comparison of prevalence of anemia among various states in India with the present study [8,11-14,16,20].
| Indicators | Places | Total Prevalence of anemia (%) | Mild (%) | Moderate (%) | Severe (%) |
|---|
| Southern states | Present study | 35.9 | 23.6 | 8.9 | 3.4 |
| Karaikal [20] | 42 | 28.5 | 11.2 | 2.3 |
| Pondicherry [8] | 55.7 | 42.6 | 12 | 1.1 |
| Tamilnadu [8] | 56.8 | 40.8 | 13.7 | 2.3 |
| Kerala [8] | 32.8 | 25.8 | 6.5 | 0.5 |
| Karnataka [16] | 34.8 | 20.2 | 13.3 | 1.3 |
| Other states | Punjab [11] | 38 | 26.2 | 10.4 | 1.4 |
| Arunachal Pradesh [8] | 50.6 | 36.6 | 12.5 | 1.6 |
| Orissa [13] | 60.8 | 39.6 | 20 | 1.2 |
| Haryana [12] | 56.1 | 37.6 | 16.7 | 1.7 |
| Haryana [14] | 48.9 | 18.8 | 27.6 | 2.5 |
| West Bengal [8] | 63.2 | 45.8 | 16.4 | 1 |
| Rajasthan [8] | 53.1 | 35.2 | 15.4 | 2.5 |
Our study finding shows that participants in the age group of 31-40-year-old were anaemic. Similar study in Orissa and Bangladesh reported these age groups of reproductive women were relatively more affected than other age groups [13,17]. But reports in other states of India show that age group of less than 25 years old were most affected [12-15]. This variation might be due to difference in child bearing ages and nutritional factors among reproductive age group women.
Middle and lower economic level were significantly associated with increased prevalence of IDA. Similar finding was reported by Bharati P et al., and Panigrahi A et al., [12,14]. This could be due to the fact that those from lower economic status lack the ability to purchase the quality and/or quantity of foods compared with those from higher economic status. Decreasing trend of anaemia was found with increasing BMI, also linear relationship found between increasing mean haemoglobin level with increasing BMI status. This might be due to the fact that anaemia is one of the most common nutritional deficiency disorders. It was supported by findings in India and Bangladesh [12,18].
In the current study, significant association was also found between socio-demographic variables and anaemic status of the reproductive age group women in terms of religion, literacy status, occupation and socio-economic status. Similar findings were reported by Bharati P et al., Mangla M et al., Panigrahi A et al., and Kamruzzaman et al., [12-14,18]. This stresses the fact that socio-demographic variables highly influences the nutritional status of the reproductive age group women.
The highest prevalence of anaemia was found among women who were married before 20 years and their age of first pregnancy before 20 years with significant association. Similarly women who had more than two pregnancies and also more than two live children have higher prevalence of anaemia. Regarding contraception usage among reproductive age group women, highest prevalence was found among those who did not use any method of contraception which was similar to the study conducted by Sadeghian M et al., [19]. This shows besides socio-economic factors, there are other factors like increased parity, reduced birth spacing and low usage of contraceptive methods may also indirectly influence the prevalence of anemia.
Limitation
Only reproductive and socio-economic factors were studied and other causes like dietary factors, parasitic infestation, haemolytic disease, malaria and bioavailability of iron were under looked in this study. Role of health facilities and awareness on factors predisposing to anemia were not studied.
Conclusion
In the current study, IDA is a major public health problem (35.9%- prevalence); coordinated efforts should be paid to control anaemia. Recognised risk factors should be considered in prevention and control strategies of IDA among reproductive age group women in this region. Although predisposing factors for anaemia were documented, large scale studies should be done to identify specific aetiologies and root causes of anaemia among the groups by assessing micronutrients (serum iron, folate, and vit-b12 levels).