The association between CRP and cardiovascular events with hypertension being the risk factor has been studied extensively and correlated with the end-organ damage [1-4]. The presence of T2DM adds incremental value to the combination Hypertension (HTN) and elevated high-sensitivity C-reactive protein (Hs-CRP) in associating multi-vessel coronary artery disease [5,6]. However, studies have shown when compared to other serum biomarkers, Hs-CRP has less significance in assessing the cardiovascular risk assessment [7-9]. Ambulatory 24-hour Blood Pressure (ABPM) is superior to office BP in relation to advanced hypertensive target organ damage and cardiovascular outcome [10-12].
Blood pressure variability has been linked to target organ damage and cardiovascular outcome irrespective of severity of hypertension [13,14]. This variability is usually underappreciated. Blood pressure variability is estimated from mean systolic and diastolic SD which is assessed from 24-hours ABPM [15]. So, the identification of increased BP variability by ambulatory monitoring may be one way of detecting the high-risk subject among hypertensive patients. The exact mechanism between BP variability and cardiovascular outcome is not clearly known. One hypothesis is in addition to mechanical stress induced by systemic hypertension, altered blood flow secondary to blood pressure variability induces chronic inflammatory response by stimulating vascular endothelial cells [16,17]. Many studies have proved the positive correlation between CRP and blood pressure variability [18-20]. However, data for Hs-CRP, diabetes mellitus and Blood Pressure Variability (BPV) is limiting.
The present study was conducted to compare the blood pressure variability with the marker of inflammation (Hs-CRP) to study the impact of effect of BPV in diabetes patients on vascular endothelial cells using 24-hours ABPM.
Materials and Methods
This case-control study included 50 patients who were known or newly detected with HTN and diabetes mellitus. They visited the Out Patient Department of Karnataka Institute of Medical Science, Hubballi, Karnataka, India, for follow-up or check-up and were enrolled in the study, after taking their written informed consent. The study was done from June 2017 to December 2017. Fifty people, who are non-diabetic and non-hypertensive, had come to Out Patient Department of Karnataka Institute of Medical Science, Hubballi, Karnataka, India, for other ailments were included in control group. The exclusion criteria were, previously diagnosed to have secondary hypertension, unstable cardiovascular disease, renal failure, malignancy and other inflammatory diseases. All participants were aware of the investigational nature of the study and provided written informed consent before the study procedure. Ethical committee clearance was taken (KIMS/PGS/SYN/447/2017-18).
Sample Size Estimation
SD-Standard deviation=from previous study or pilot study
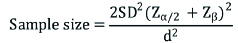
Zα/2=Z0.05/2=Z0.025=1.96 (from Z table) at type 1 error of 5%
Zβ=Z0.2=0.842 (from Z table) at 80 % power
d=effect size=difference between mean values
So now formula will be
Zα at 95% confidence level (1% alpha error)=1.96
Zβ at 80% power=0.84
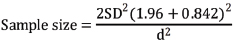
Using these values at 95% Confidence limit and 80% power sample size of 38 was obtained in each group by using the above mentioned formula and Medcalc sample size software. With 20% non response sample size of 38+7.6≈46 rounded of to 50 subjects in each group were included.
Study Protocol
Office SBP and diastolic BP were measured twice in both arms using an automatic device after 10 minutes of rest in a sitting position. The mean BP reading of the arm with the highest BP was used in the statistical analysis. Data related to personal medical history were collected accessing the patients’ medical records, namely age, gender, T2DM duration, HTN duration and smoking status. American diagnostic criteria 2012 was included to diagnose T2DM. Fasting Blood Sugar (FBS)- >126 mg/dL OGTT with two hour post-load value >200 mg/dL, HbA1C >6.5, and RBS >200 mg/dL with symptoms such as polyuria, polydipsia, polyphagia. HTN was diagnosed according to the European Society of Hypertension criteria [21]. Height, weight and abdominal circumference were recorded and body mass index was calculated. ECG was done for all patients to rule out ischaemic heart disease and such patients were excluded from the study. Fundoscopy was done for all study group patients to know the severity of HTN and Diabetes.
Biochemical Measurements
Early morning overnight fasting blood samples were collected to assess FBS, HbA1c and fasting lipid profile. Other routinely performed blood investigations like complete blood count, blood urea, serum creatinine and urine analysis is done to rule out infections, nephropathy. Glycated haemoglobin (HbA1c) was assessed immediately using commercially available methods (Hitachi, Roche Diagnostics). Hs-CRP serum levels were measured once using a commercially available ELISA kit according to the manufacturers’ instructions (DRG Instruments, GmbH, Marburg, Germany). The intra- and inter-assay coefficients of variation for Hs-CRP were about 5%.
Ambulatory Blood Pressure Monitoring
Ambulatory BP was obtained using a non-invasive oscillometric system (P6 Pressurometer; Del Mar Reynold, CA, USA) validated according to the Protocol of the European Hypertension Society. The arm with the highest BP was used for 24-hour BP measurement. Patients were instructed to go about his or her normal activities during the 24-hours ambulatory BP monitoring period but to refrain from vigorous physical activity. BP measurements taken between 07.00 hours and 24.00 hours were regarded as ‘awake (daytime)’ measurements and measurements taken between 24.00 hours and 07.00 hours were ‘asleep (night-time)’ measurements. The ambulatory monitor was programmed to record a subject’s BP every 30 minutes during the awake period and every 60-minutes during the sleep period. All patients in this study had complete data on at least 70% of the total possible measurements. For each time period, authors estimated the mean BP and the Standard Deviation (SD) of the BPs.
Statistical Analysis
Data were entered into Microsoft excel data sheet and was analysed using SPSS software version 22.0. Categorical data were represented in the form of frequencies and proportions. Chi-square test was used as test of significance for qualitative data. Continuous data was represented as mean and standard deviation. Independent t-test was used as test of significance to identify the mean difference between two quantitative variables. The p-value <0.05 was considered as statistically significant after assuming all the rules of statistical tests.
Results
Among the cases, mean age was 54.4±12.3 years, mean BMI was 23.2±2.9 and mean Waist/Hip (W/H) Ratio was 1±0.1 and among controls mean was 54.2±7.6 years, mean BMI was 23±2.7 years and mean W/H Ratio was 1±0.1. There was no significant difference in mean age, BMI and W/H Ratio between cases and controls [Table/Fig-1]. Among cases, 66% were males, 34% were females and among controls, 76% were males and 24% were females. There was no significant difference in gender distribution between two groups [Table/Fig-2]. Mean duration of DM among cases was 5.8±2.8 years, 66% were on OHA’s and 34% were on Insulin, 10% had Diabetic foot [Table/Fig-3]. Among cases 42% were smokers and among controls 48% were smokers. There was no significant difference in smoking history between cases and controls [Table/Fig-4].
Profile of subjects in the study.
| Variables | Groups | p-value |
|---|
| Cases | Controls |
|---|
| Mean | SD | Mean | SD |
|---|
| Age | 54.4 | 12.3 | 54.2 | 7.6 | 0.762 |
| BMI | 23.2 | 2.9 | 23.0 | 2.7 | 0.657 |
| W/H ratio | 1.0 | 0.1 | 1.0 | 0.1 | 0.382 |
Gender distribution of subjects.
| Variables | Groups |
|---|
| Cases | Controls |
|---|
| Count | % | Count | % |
|---|
| Sex | Male | 33 | 66.0% | 38 | 76.0% |
| Female | 17 | 34.0% | 12 | 24.0% |
χ2=1.214, df=1, p=0.271
Diabetic profile of subjects among cases.
| Variables | Groups |
|---|
| Cases |
|---|
| Count | % |
|---|
| Mean duration of DM | Mean±SD | 5.8±2.8 years |
|---|
| Drugs (OHAs/Insulin) | OHA | 33 | 66.0% |
| Insulin | 17 | 34.0% |
| Fundus | 1 | 31 | 62.0% |
| 2 | 13 | 26.0% |
| 3 | 6 | 12.0% |
| Diabetic foot | Yes | 5 | 10.0% |
| No | 45 | 90.0% |
Smoking profile of subjects.
| Variables | Groups |
|---|
| Cases | Controls |
|---|
| Count | % | Count | % |
|---|
| Smoker | Yes | 21 | 42.0% | 24 | 48.0% |
| No | 29 | 58.0% | 26 | 52.0% |
χ2=0.364, df=1, p=0.546
Among cases mean FBS was 130.6±18.5 mg/dL, mean Post Prandial Blood Sugar (PPBS) was 211.9±41.5 mg/dL and mean HbA1c was 7.3±1.8. Among controls mean FBS was 94.5±10.3 mg/dL, mean PPBS was 150.8±14.6 mg/dL and mean HbA1c was 5.4±0.4. This difference in mean FBS, PPBS, HbA1c between cases and controls There was no significant difference in mean Hb%, Total count, Total Cholesterol, TG, LDL, VLDL and HDL between cases and controls [Table/Fig-5].
Comparison of investigations between cases and controls.
| Variables | Groups | p-value |
|---|
| Cases | Controls |
|---|
| Mean | SD | Mean | SD |
|---|
| FBS | 130.6 | 18.5 | 94.5 | 10.3 | <0.001* |
| PPBS | 211.9 | 41.5 | 150.8 | 14.6 | <0.001* |
| HbA1c | 7.3 | 1.8 | 5.4 | 0.4 | <0.001* |
| Hb% | 11.2 | 7.9 | 12.2 | 11.0 | 0.601 |
| Total count | 8940.0 | 3070.7 | 9076.0 | 2892.9 | 0.820 |
| Total cholesterol | 184.7 | 42.1 | 190.3 | 49.8 | 0.544 |
| TG | 178.0 | 52.4 | 201.1 | 66.7 | 0.057 |
| LDL | 92.1 | 38.4 | 94.5 | 46.3 | 0.782 |
| VLDL | 44.2 | 13.7 | 46.9 | 16.7 | 0.379 |
| HDL | 52.7 | 11.9 | 52.2 | 15.7 | 0.853 |
Among cases Mean SBP was 122.6±16.2 mmHg, mean SBP variability was 13±3.8, mean DBP was 79.5±9.4 mmHg and mean DBP variability was 12.2±2.4. Among controls Mean SBP was 108.5±6.7 mmHg, mean SBP variability was 11.2±1.6, mean DBP was 73.7±5.4 mmHg and mean DBP variability was 11.1±1.6. There was significant difference in Mean SBP, SBP variability, DBP and DBP variability between cases and controls [Table/Fig-6]. Among cases 20% had Hs-CRP <3 and 80% had Hs-CRP >3 and among controls 78% had Hs-CRP <3 and 22% had Hs-CRP >3. This difference in Hs-CRP between two groups was statistically significant [Table/Fig-7].
Comparison of blood pressure between cases and controls.
| Variables (mmHg) | Groups | |
|---|
| Cases | Controls |
|---|
| Mean | SD | Mean | SD |
|---|
| SBP | 122.6 | 16.2 | 108.5 | 6.7 | |
| SBP variability | 13.0 | 3.8 | 11.2 | 1.6 | |
| DBP | 79.5 | 9.4 | 73.7 | 5.4 | |
| DBP variability | 12.2 | 2.4 | 11.1 | 1.6 | |
Comparison of Hs-CRP among cases and controls.
| | Groups |
|---|
| Cases | Controls |
|---|
| Count | % | Count | % |
|---|
| Hs-CRP | <3 | 10 | 20.0% | 39 | 78.0% |
| >3 | 40 | 80.0% | 11 | 22.0% |
χ2=33.65, df=1, p<0.001*
Among the cases, those with Hs-CRP <3, mean SBP was 113.6±8.8 mmHg, those with Hs-CRP >3, mean SBP was 124.9±16.9 mmHg. This difference in mean SBP was statistically significant. Those with Hs-CRP <3, mean DBP was 79.4±6.4 mmHg, those with Hs-CRP >3, mean DBP was 79.6±10.0 mmHg. This difference in mean DBP was not statistically significant [Table/Fig-8].
SBP and DBP comparison between Cases and controls with respect to Hs-CRP values.
| SBP (mmHg) | DBP (mmHg) |
|---|
| Mean | SD | p-value | Mean | SD | p-value |
|---|
| Groups | Cases | Hs-CRP | <3 | 113.6 | 8.8 | 0.047* | 79.4 | 6.4 | 0.959 |
| >3 | 124.9 | 16.9 | 79.6 | 10.0 |
| Controls | Hs-CRP | <3 | 109.1 | 7.0 | 0.293 | 73.8 | 5.3 | 0.755 |
| >3 | 106.6 | 4.9 | 73.1 | 6.0 |
Among the controls, those with Hs-CRP <3, mean SBP was 109.1±7.0 mmHg, those with Hs-CRP >3, mean SBP was 106.6±4.9 mmHg. This difference in mean SBP was not statistically significant. Those with Hs-CRP <3, mean DBP was 73.8±5.3 mmHg, those with Hs-CRP >3, mean DBP was 73.1±6.0 mmHg. This difference in mean DBP was not statistically significant. The p-values based on multiple linear regression analysis. The model included age, duration of DM, FBS, HbA1C, SBP and DBP variability. R-square value was 57% [Table/Fig-9].
Multiple linear regression analysis with as the outcome variable.
| Parameter | Beta Coefficient | 95% CI | p-value |
|---|
| Age | -0.008 | -0.067 to 0.05 | 0.782 |
| Duration of DM | 0.385 | 0.09 to 0.68 | 0.012* |
| FBS | -0.009 | -0.048 to 0.030 | 0.635 |
| HbA1C | 0.423 | -0.375 to 0.509 | 0.762 |
| SBP variability | 0.424 | 0.217 to 0.630 | <0.001* |
| DBP variability | 0.259 | -0.852 to 0.604 | 0.136 |
Among cases there was significant positive correlation between Hs-CRP, SBP Variability, DBP Variability and Duration of DM i.e., with increase in Hs-CRP, there was significant increase in SBP Variability, DBP Variability and Duration of DM and vice versa.
Among controls there was significant negative correlation between Hs-CRP, SBP, SBP Variability and BMI i.e., with increase in Hs-CRP, there was significant decrease in SBP, SBP Variability and BMI and vice versa [Table/Fig-10].
Correlation between Hs-CRP and variables between Cases and controls.
| Correlations |
|---|
| Hs-CRP | SBP (mmHg) | SBP Variability (mmHg) | DBP (mmHg) | DBP Variability (mmHg) | Duration of DM (years) | BMI | W/H Ratio | FBS | PPBS | HbA1c |
|---|
| Cases Hs-CRP | Pearson’s correlation (r) | 1 | 0.137 | 0.650** | 0.110 | 0.525** | 0.535** | 0.005 | 0.132 | 0.034 | 0.108 | 0.259 |
| p-value | | 0.344 | <0.001* | 0.448 | <0.001* | <0.001* | 0.970 | 0.359 | 0.815 | 0.453 | 0.069 |
| Controls Hs-CRP | Pearson’s correlation (r) | 1 | -0.284* | -0.291* | -0.261 | -0.064 | | -0.289* | 0.060 | -0.103 | 0.239 | 0.128 |
| p-value | | 0.046* | 0.04* | 0.067 | 0.661 | | 0.042* | 0.679 | 0.478 | 0.094 | 0.375 |
Discussion
The most important finding of the present study is that Hs-CRP is significantly associated with 24-hour systolic and diastolic BP variability in T2DM compared to healthy control subjects. These results suggest that Hs-CRP might be better associated to cardiovascular risk through BP variability than mean BP values in T2DM patients. Although HTN has been established to be a predictor for cardiovascular disease, the concept of 24-hour SBP and diastolic BP variability might also have a prognostic impact. Even when trying to control the factors that might influence BP variability, such as patients’ anxiety or accuracy of the measurement technique, it is known that BP has biological short-term (e.g., minute-to-minute) and long-term variations. All these BP variations had comparable effects on cardiovascular risk events [22]. However, SD has been questioned as an appropriate estimator of BP variability, considering that it is sensitive to the number of BP measurements and it is calculated as dispersion values around the BP mean [23].
Although other methods were described for measuring BP variability, authors demonstrated that SD was a useful parameter to assess BP variability given the ability of 24-hour diastolic BP variability to independently predict Hs-CRP levels in T2DM patients [19]. BP variability is increased in hypertensive compared to normotensive patients and increases with the severity of HTN [24,25]. Similar results regarding the association of BP variability with CRP were previously reported in hypertensive adults.
In addition, the present study offers new insights in the simultaneous measurement of Hs-CRP and BP variability in hypertensive T2DM patients. Abramson JL et al., suggested that low grade inflammation may be one of the factors that promote increased BP variability in normotensive middle-aged adults [18]. According to the present results, increased BP variability, 24-hours systolic and diastolic BP variability were the factors that predicted the Hs-CRP levels. Since the independent presence of T2DM, BP variability and Hs-CRP was previously demonstrated to have a predictive value for the development of cardiovascular disease, their additive effect might result in a more increased cardiovascular risk [20]. The American Heart Association published a statement which recommended the use of Hs-CRP to evaluate the risk for heart disease in the adult population. The lowest cut-off points for Hs-CRP stratification risk were lower than 1 mg/L for low risk and higher than 3 mg/L for high risk [26]. The contribution of Hs-CRP and ambulatory BP variability to cardiovascular risk stratification in T2DM and control subjects needs to be evaluated in prospective studies.
Limitation
The study was single-centred. Patients who were known cases of malignancy and inflammatory disorders were excluded from the study. Investigations were not directed to diagnose the new cases. Patients with early diabetic nephropathy were not completely ruled out among the cases as only RFT and urine routine was considered.
Conclusion
Hs-CRP is associated with 24-hours systolic BP variability, 24-hours diastolic BP variability and duration of Type 2 Diabetes Mellitus. Blood pressure variability was independent predictors for Hs-CRP. The highest Hs-CRP levels were detected in T2DM patients and high BP variability.
χ2=1.214, df=1, p=0.271
χ2=0.364, df=1, p=0.546
χ2=33.65, df=1, p<0.001*