Identification of human remains is an important ingredient in medico-legal investigations. This process is a frequently encountered problem for researchers, mass disasters, explosions, airplane crashes, fire disasters, or murder cases where they are disintegrated to suppress the identity of the deceased. One of the most important responsibilities of forensic anthropologists is the identification of dismembered, mutilated and fragmentary human remains and they realise this by determining the age, sex, stature and race of the cases [1-4]. Accurate sexing of human remains narrows the research to a certain extent and thus prepares the ground for final identification by directing the ongoing judicial investigation to other descriptive markers [1,5].
Anthropometry, a multi-faceted technique for investigating sexual dimorphism, is a practical method with high predictivity and validity using regression analyses [6-10]. In order to assist the process in forensic investigations, various sex prediction studies were conducted using various body parts such as upper and lower extremities including hand and foot dimensions [6,7,9,11,12]. Besides the IFL and RFL, finger length ratios (IFL/RFL) were also utilised for sex determination [1-5,13-15]. Finger ratios demonstrated to be sexually dimorphic population marker [1,16-18], and these ratios are related to prenatal oestrogen and testosterone levels. It is genetically controlled by the HOX genes [4,19] which indirectly influence the prenatal production of testicular androgen and the development of the fingers [4]. It has been proven that sexual dimorphism in finger ratios, develops in the uterus at 13 and 14 weeks of gestation [4,20] due to the effect of parental androgen and oestrogen [4,21]. It is known for years that IFL/RFL ratio varies according to sex. Previous studies generally presented that males have a lower IFL/RFL ratio than females [2-4,14,15] and this sex variation begins in fetal life, and individual IFL/RFL remains stable throughout the life [13,22].
Previous studies on the IFL/RFL ratio in sex estimation has shown variable results and it is determined that the IFL/RFL ratios differ between populations [14,15,23]. Also, its utility seems to be limited in medico-legal investigations [4]. Considering the large number of racial and ethnic diversity due to genetic and environmental factors, more regional studies are needed [1]. Turkey, as a country, consists of seven geographic regions and several ethnic groups are (average 23) in the minority in Turkey (Kurd, Circassian, Azeri, Laz, Armenian, Gagavuz, Arab, Tatar etc.,). Individuals with Turkish ethnicity constitute 78.1% of the population according to 2010 data [24]. In cases where only a part of the hand is available in forensic cases, it is clear that population-specific sex estimation models need to be developed by using a hand or some part of the fingers. In this context; the current study was carried out to investigate sexual dimorphism in index and ring finger lengths as well as IFL/RFL ratio and to develop reference models for sex estimation in Turkish population.
Materials and Methods
Participants
The study period was from December 2017 to October 2018. This cross-sectional study was carried out among 394 individuals (197 males and 197 females) from the Karadeniz Technical University (KTU), Trabzon, Turkey. The volunteers were aged between 18 and 25 years. The total number of students who were enrolled in the courses during 2016-2017 and 2017-2018 academic years of the university was determined as 861 by KTU Student Affairs. Stratified randomisation method was utilised according to sex with 1:1 ratio, owing to the fact that most of the students were females (70%; 252 males, 609 females). The reason for using this ratio was to use a balanced sample for the models for which sex estimation was to be made. An internal cross-validation approach was used by randomly splitting the total sample into two groups. A total of 314 individuals (157 males, 157 females) were selected for the train group, and 80 individuals (40 males, 40 females) were selected for the test group. The reliability of the derived equations in the train group were evaluated by blind method in the test group. The train and test group were balanced for ethnic origin, age and sex diversity.
The aim of the study was explained to the participants in detail and an informed consent was taken from each of them prior to recording their measurements. The study was based on the principle of volunteerism. All participants were born and grew up in Turkey and had a Turk ethnic background. The participants were free from any physical deformity of hands and fingers. Subjects with function disorders in the measurement areas, or a history of hand injury, any muscular disease, congenital disorder, deformity, fracture, movement restriction, systemic arthropathy, trauma or surgery and non-Turkish ethnicity were excluded from this study. Ethical approval was obtained from the University Ethics Committee (protocol no: 24237859-508; approval no: 2016/87).
Procedure
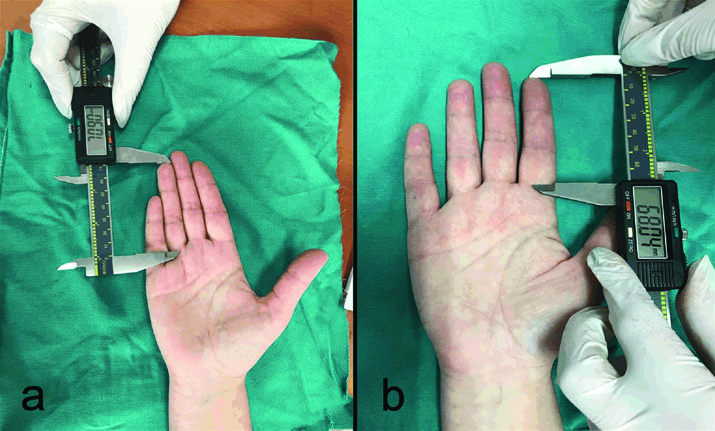
The anthropometric measurements were carried out according to the methods described by Weiner and Lourie [25]. The finger measurements recorded were Index Finger Length of Right hand (RIFL), Index Finger Length of Left hand (LIFL), Ring Finger Length of Right hand (RRFL) and Ring Finger Length of Left hand (LRFL). The index and ring finger ratio was calculated for both hands by dividing IFL by RFL (IFL÷RFL). The IFL and RFL were measured as the linear distance between the midpoint of the proximal most flexion crease of the base, and the anterior most points of the index and ring finger (tip) in the midline on the palmer surface respectively [Table/Fig-1]. Finger measurements were taken using digital calipers with a 0-300 mm measurement capacity sensitive to ±0.01 mm. During the measurement, attention was paid to avoid abduction and adduction of the wrist. Measurements were recorded to nearest 0.1 cm.
The measurement of ring (a) and index finger (b) lengths.
It is known that there may be a difference in the stature of the individuals of about 1.5 cm between the time of awakening in the morning and the last hours of the day. In the first hours of day, the stature is at the highest level and descends to the lowest level in the evening hours [26]. For this reason, measurements were performed at the same time of the day between 1 and 3 PM to avoid diurnal variation. To prevent interpersonal error, all measurements were taken by the same person. Each participant was measured twice, and an average of the two readings was recorded. Very high values of (R>0.96) were obtained for all the finger lengths and these were higher than the cut-off value of 0.95 [27].
TEM Analysis
The Technical Error of Measurement (TEM) was determined to check the consistency and reliability for the intra-observer differences in connection with the measurements. TEM was calculated as TEM=√ (ΣD2/2N), where ‘D’ is the difference between two measurements, and ‘N’ is the number of individuals. Then the relative Technical Error of Measurement (rTEM) was calculated from two successive set of measurements by dividing the TEM for a given variable by the grand mean of that variable and multiplying the result by 100. The Coefficient of Reliability (R) and Coefficient of Variation (CV) was calculated by following equation: CV=SD*100/X̄. In this equation, X̄ is the average of measurements and SD is the standard deviation. The CV shows sample variability relative to the mean of the sample [28]. For estimating TEM in the present study, before collecting data, LIFL, RIFL, LRFL and RRFL were measured twice in 30 (15 males and 15 females) randomly selected 18-25 years aged individuals other than those included in the present study by one of the author. Measurements were made on two separate days. Stratified randomisation method was used to avoid bias accounting for sex.
The intra-observer measurement error and reliability were calculated to be within the acceptable standards for all measurements (R>0.9; rTEM< 5%) [29]. Thus, the anthropometric measurements obtained in the present study were reliable, reproducible and free from any observer bias, and TEM was not taken into consideration for further statistical analysis. The systematic errors due to the shift in the style or landmark interpretations or between instruments (e.g., sliding caliper) were also tested using the standard procedure [30]. [Table/Fig-2,3] shows the results of precision and reliability analysis of anthropometric measurements found statistically significant in binary logistic regression analyses (p<0.001).
Finger length measurements, TEM, rTEM and R-values.
| a | B | d2 | TEM | rTEM (%) | R | p |
|---|
| RIFL | 6.64±1.07 | 6.75±1.08 | -0.12±0.05 | 0.09 | 1.34 | 0.993 | <0.001 |
| RRFL | 6.74±1.11 | 6.92±1.12 | -0.19±0.06 | 0.14 | 2.03 | 0.984 | <0.001 |
| LIFL | 6.58±1.1 | 6.73±1.09 | -0.16±0.06 | 0.12 | 1.78 | 0.988 | <0.001 |
| LRFL | 6.71±1.09 | 6.84±1.09 | -0.13±0.05 | 0.10 | 1.41 | 0.992 | <0.001 |
n=30, a: Average of the first measurement, b: Average of the second measurement, d: Difference between the average, TEM: Technical error measurement; rTEM: Relative technical error of measurement; R: Coefficient of reliability, p: Statistical significance level of R
TAverage, standard deviation and coefficient of variation.
| X̄ | SD | CV |
|---|
| RIFL | 6.69 | 1.08 | 16.08 |
| RRFL | 6.83 | 1.11 | 16.31 |
| LIFL | 6.66 | 1.09 | 16.44 |
| LRFL | 6.78 | 1.09 | 16.07 |
n=30, X: Average; SD: Standard deviation; CV: Coefficient of variation
Statistical Analysis
The statistical analysis was done using the Statistical Package for Social Sciences (SPSS version 23.0, Chicago, Illinois, USA). Except for the Mc-Nemar test and Hosmer & Lemeshow test, a p-value of less than 0.05 was considered to be statistically significant. Independent samples t-test was performed to compare sex differences in IFL, RFL, and IFL/RFL ratio (left and right) between sexes. The bilateral differences were also evaluated between measurements in right and left hands using paired sample t-test.
The study sample (n=394) was randomly split into two groups based on computer program and Pareto principle [31] with 80:20 ratio; the first group (train sample) comprised of 314 (80% of total sample) participants (157 males and 157 females) on which the statistical analysis was performed to derive sex discriminating models and the second group of 80 (20% of total sample) participants (40 males and 40 females) was designated as test group on which the validity of derived models were tested. The Binary Logistic Regression (BLR) analysis [32] was employed to derive the predicting models for estimation of sex from IFL and RFL. The accuracy of models derived using BLR analysis from the 314 participants was tested on the sample from the same population which was designated as test group. These samples were taken into consideration using the random sampling method to test the accuracy of the derived models in BLR analysis. Sectioning point in logistic regression analysis was 0.5. In BLR analysis for sex estimation; all scores greater than 0.5 for the derived value of function (y) were classified as a male, and scores below 0.5 as a female.
Mc-Nemar test was used to compare similarity for contingency tables expected value and predicted value distributions additionally by using Kappa (κ) statistic contingency table predicted and expected value agreements was measured. The accuracy was thus, obtained on the test sample. Besides, drawing prediction percentage based on BLR analysis, Akaike Information Criteria (AIC) [33] and Bayesian Information Criteria (BIC) [34] was used and then Receiver Operating Curve (ROC) analysis was performed on the predicting probabilities obtained from the BLR analysis. BLR models goodness of fit values were tested using Hosmer & Lemeshow test. Area Under the Curve (AUC) was considered as the predictive accuracy of IFL and RFL in sex estimation. The AUC was considered as the predictive accuracy of finger lengths in sex estimation. An AUC of >0.9 is considered to be outstanding, >0.8-0.9 as excellent, 0.7-0.8 as acceptable, and <0.7 is considered poor [2]. BLR models observed power(1-β) statistic was calculated using G-Power 3.1 program [35].
Results
A total of 394 volunteers (study group) were enrolled in investigation, including 157 male and 157 female for train group and 40 male and 40 female for test group. Mean age of males: 19.65±1.91 years, mean age of females: 18.82±1.10 years for train group; and mean age of males: 19.65±1.63 years, mean age of females: 19.05±1.28 years for test group. The descriptive statistics of IFL, RFL, IFL/RFL ratios for both sides and the mean differences between measurements in both sexes for train and test groups are presented in [Table/Fig-4,5], respectively. The IFL and RFL were found to be significiantly longer in males than females in both right and left hands (p<0.001). The RRFL and LRFL were found to be longer than RIFL and LIFL among both sexes. The mean values of IFL/RFL ratio were not statistically significiant (p>0.05) for both sexes [Table/Fig-4,5].
Descriptive statistics of index, ring finger lengths and their ratio variables.
| Variables | Train group (n=314) | Test group (n=80) |
|---|
| Male (n=157) | Female (n=157) | Male (n=40) | Female (n=40) |
|---|
| Range | Mean±SD | Range | Mean±SD | Range | Mean±SD | Range | Mean±SD |
|---|
| RIFL | 3.87-8.27 | 7.07±0.74 | 3.51-7.74 | 6.25±0.96 | 4.22-8.77 | 6.97±0.98 | 4.29-7.54 | 6.34±0.65 |
| LIFL | 3.95-8.14 | 7.03±0.77 | 3.24-7.78 | 6.16±0.98 | 4.06-8.68 | 6.94±1.05 | 4.04-7.65 | 6.27±0.68 |
| RRFL | 3.66-8.61 | 7.17±0.81 | 3.68-7.62 | 6.29±0.93 | 4.27-8.69 | 7.11±1.02 | 4.27-7.50 | 6.37±0.67 |
| LRFL | 3.76-8.70 | 7.19±0.83 | 3.70-7.61 | 6.28±0.93 | 4.12-8.59 | 7.11±1.06 | 4.30-7.63 | 6.39±0.65 |
| RR | 0.84-1.14 | 0.99±0.04 | 0.86-1.19 | 0.99±0.05 | 0.91-1.04 | 0.98±0.02 | 0.95-1.07 | 1.00±0.03 |
| LR | 0.89-1.08 | 0.98±0.03 | 0.78-1.18 | 0.98±0.05 | 0.92-1.02 | 0.98±0.02 | 0.92-1.05 | 0.98±0.03 |
RIFL: Right index finger length; LIFL: Left index finger length; RRFL: Right ring finger length; LRFL: Left ring finger length; RR: Right index and ring finger ratio; LR: Left index and ring finger ratio; SD: Standard deviation; df: Degree of freedom
Mean differences in anthropometric measurements using independent samples t-test.
| Variables | Train group (n=314) (157 male and 157 female) |
|---|
| t | df | p |
|---|
| RIFL (cm) | -8.448 | 312 | <0.001 |
| LIFL (cm) | -8.823 | 312 | <0.001 |
| RRFL (cm) | -8.955 | 312 | <0.001 |
| LRFL (cm) | -9.148 | 312 | <0.001 |
| RR | 1.419 | 312 | >0.05 |
| LR | -0.155 | 312 | >0.05 |
RIFL: Right index finger length; LIFL: Left index finger length; RRFL: Right ring finger length; LRFL: Left ring finger length; df: Degree of freedom, p<0.05 statistical significance
Descriptive statistics for paired left and right finger length differences were shown in [Table/Fig-6]. Bilateral asymmetry was observed in RIFL and LIFL for both sexes (p<0.05). Statistically significiant side differences were not observed in RRFL and LRFL for both sexes in the train group (p>0.05) [Table/Fig-7]. Models derived for estimation of sex from IFL and RFL using BLR analysis were shown in [Table/Fig-8] and Binary logistic regression models goodness of fit and information criteria statistics were presented in [Table/Fig-9]. All variables in the models were found to be significant (p<0.001).
Descriptive statistics for paired left and right finger length differences.
| Left and Right (Paired) | Train group (n=314) |
|---|
| Male (n=157) | Female (n=157) |
|---|
| r* | Mean±SD | r* | Mean±SD |
|---|
| IFL (cm) | 0.973 | 0.03±0.18 | 0.976 | 0.09±0.21 |
| RFL (cm) | 0.974 | -0.20±0.19 | 0.978 | 0.00±0.20 |
IFL: Index finger length; RFL: Ring finger length; SD: Standard deviation; *: Left and right finger measurements correlation coefficient (p<0.001)
Bilateral asymmetry in finger lengths using paired samples t-test.
| Left and Right (Paired) | Sex | Train group (n=314) (157 male and 157 female) |
|---|
| t | df | p |
|---|
| IFL (cm) | Male | 2.407 | 156 | <0.05 |
| Female | 5.529 | 156 | <0.001 |
| RFL (cm) | Male | -1.327 | 156 | >0.05 |
| Female | 0.216 | 156 | >0.05 |
IFL: Index finger length; RFL: Ring finger length; df: Degree of freedom; p: Paired samples t-test; p<0.05 statistical significance
Binary logistic regression analysis for estimation of sex from index and ring finger lengths in the analysed group from the train sample (n=314).
| Model | Coefficients (cm) | B | SE (B) | Wald | p | Power | RR (95% CI) |
|---|
| 1 | LIFL | 1.408 | 0.212 | 44.023 | <0.001 | 0.999 | 4.086 (2.696-6.193) |
| Constant | -9.426 | 1.447 | 42.419 | <0.001 | <0.0001 |
| 2 | LRFL | 1.398 | 0.203 | 47.424 | <0.001 | 0.999 | 4.046 (2.718-6.023) |
| Constant | -9.532 | 1.407 | 45.922 | <0.001 | <0.001 |
| 3 | RIFL | 1.387 | 0.215 | 41.528 | <0.001 | 0.999 | 4.001 (2.625-6.101) |
| Constant | -9.366 | 1.480 | 40.065 | <0.001 | <0.001 |
| 4 | RRFL | 1.382 | 0.204 | 45.961 | <0.001 | 0.999 | 3.983 (2.671-5.938) |
| Constant | -9.418 | 1.413 | 44.445 | <0.001 | <0.001 |
| 5 | LIFL | 0.418 | 0.526 | 0.630 | 0.427 | 0.468 | 1.519 (0.541-4.261) |
| LRFL | 1.022 | 0.510 | 4.015 | 0.045 | 2.779 (1.023-7.553) |
| Constant | -9.773 | 1.464 | 44.574 | <0.001 | <0.001 |
| 6 | RIFL | 0.164 | 0.527 | 0.097 | 0.755 | 0.537 | 1.179 (0.419-3.314) |
| RRFL | 1.240 | 0.498 | 6.184 | 0.013 | 3.454 (1.300-9.176) |
| Constant | -9.561 | 1.498 | 40.747 | <0.001 | <0.001 |
LIFL: Left index finger length; LRFL: Left ring finger length; RIFL: Right index finger length; RRFL: Right ring finger length; SE: Standard error; p: BLR model coefficients significance value, Power (1-β): Observed power; RR: The estimated relative risk shown by the exp (B) and the 95% confidence interval; CI: Confidence interval
Binary logistic regression models goodness of fit and information criteria statistics.
| BLR Sex Estimation Models | Cut-off value (cm) | Goodness of fit | Information criteria |
|---|
| χ2 | df | p | -2LL | AIC | BIC |
|---|
| -9.426+1.408 x LIFL | 6.695 | 58.067 | 8 | <0.001 | 358.692 | 360.705 | 364.441 |
| -9.532+1.398 x LRFL | 6.818 | 56.050 | 8 | <0.001 | 355.201 | 357.214 | 360.950 |
| -9.366+1.387 x RIFL | 6.753 | 60.488 | 8 | <0.001 | 364.338 | 366.351 | 370.087 |
| -9.418+1.382 x RRFL | 6.815 | 60.711 | 8 | <0.001 | 357.974 | 359.987 | 363.723 |
| -9.773+0.418 x LIFL+1.022 x LRFL | NA | 69.264 | 8 | <0.001 | 354.567 | 358.606 | 366.066 |
| -9.561+0.164 x RIFL+1.240 x RRFL | NA | 66.019 | 8 | <0.001 | 357.877 | 361.916 | 369.376 |
BLR: Binary logistic regression; LIFL: Left index finger length; LRFL: Left ring finger length; RIFL: Right index finger length; RRFL: Right ring finger length; NA: Not a single value; p: Hosmer and Lemeshow test; LL: Log likelihood; AIC: Akaike information criteria; BIC: Bayesian information criteria
When the Mc-Nemar test results used to determine the similarity between the sex distribution of the individuals in the test group and the distributions estimated by the model, the distributions were similar. This finding was supported by Kappa agreement statistics and the distributions were found to be moderately compatible with each other. Accuracy percentage for models ranged between 70.0% and 75.0% in the test group for both sexes [Table/Fig-10].
Accuracy in estimation of sex from IFL and RFL based on sectioning point (0.5) in binary logistic regression (BLR) analysis.
| BLR Sex Estimation Models | Test Group (Males=40; Females=40) |
|---|
| Male Accuracy | Female Accuracy | Mean Accuracy | p | κ |
|---|
| (1): LIFL (cm) | (30/40) 75.00% | (29/40) 72.50% | (59/80) 73.75% | 1.000 | 0.475 |
| (2): LRFL (cm) | (30/40) 75.00% | (29/40) 72.50% | (59/80) 73.75% | 1.000 | 0.475 |
| (3): RIFL (cm) | (30/40) 75.00% | (30/40) 75.00% | (60/80) 75.00% | 1.000 | 0.500 |
| (4): RRFL (cm) | (28/40) 70.00% | (28/40) 70.00% | (56/80) 70.00% | 1.000 | 0.400 |
| (5): LIFL and LRFL (cm) | (28/40) 70.00% | (29/40) 72.50% | (57/80) 71.25% | 1.000 | 0.425 |
| (6): RIFL and RRFL (cm) | (28/40) 70.00% | (28/40) 70.00% | (56/80) 70.00% | 1.000 | 0.400 |
BLR: Binary logistic regression; LIFL: Left index finger length; LRFL: Left ring finger length; RIFL: Right index finger length; RRFL: Right ring finger length; p: McNemar test significance value; κ: Kappa agreement statistic value.
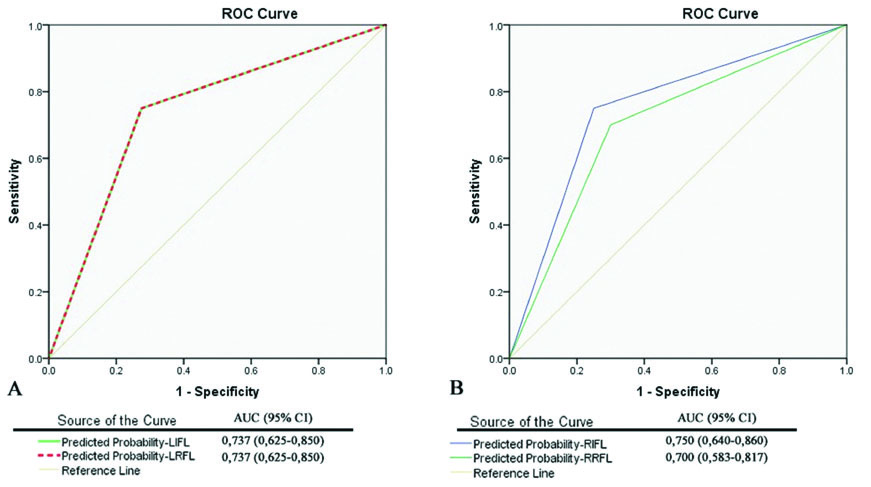
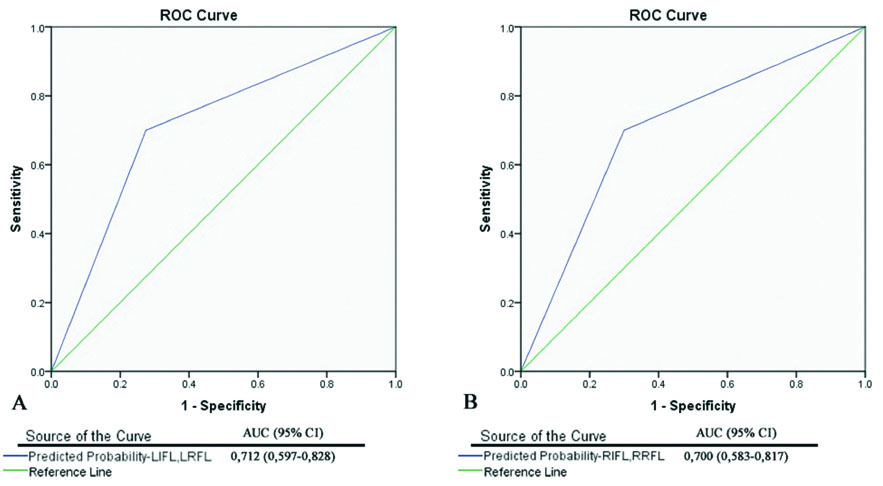
Considering the ROC analysis, it is observed that the variable that most successfully classifies sex is RIFL (AUC=0.75). LIFL (73.7%), LRFL (73.7%) and RRFL (70.0%) showed lower potential for discriminating sex than RIFL (75.0%) [Table/Fig-11]. When the IFL and RFL evaluated together, had similar values of discriminating sex in the right (70.0%) and left (71.2%) hands [Table/Fig-12].
ROC analysis indicating the predictive probability from LIFL, LRFL (a) and RIFL, RRFL (b) for estimation of sex.
ROC analysis indicating the predictive probability from combined IFL and RFL of Left (a) and Right (b) sides for estimation of sex.
Discussion
The finger ratio, especially the index finger to ring finger ratio of the hands is fixed before birth, and there is no important change at puberty. This ratio shows the steroids in uteri. A high IFL/RFL ratio may relate with low prenatal testosterone and high oestrogen, and a low IFL/RFL ratio may point out high prenatal testosterone and low oestrogen [13]. Various studies have indicated that the IFL, RFL and IFL/RFL ratios are correlated to sexual dimorphism [1-5,13-15]. At the side of sexual dimorphism, IFL/RFL ratio have showed significiant ethnic [1,5,36] and population variations [Table/Fig-13].
IFL/RFL ratio in different populations.
| RR | LR |
|---|
| Population | Male | Female | Male | Female |
|---|
| Mean±SD | Mean±SD | Mean±SD | Mean±SD |
|---|
| Current study | 0.99±0.04 | 0.99±0.05 | 0.98±0.03 | 0.98±0.05 |
| Sen J et al., [1] | 0.97±0.03 | 0.97±0.03 | 0.96±0.03 | 0.96±0.03 |
| Ibrahim MA et al., [2] | 1.01±0.01 | 1.05±0.01 | 1.04±0.01 | 1.05±0.01 |
| Khan MA et al., [3] | 0.97±0.03 | 0.98±0.02 | 0.97±0.03 | 0.98±0.02 |
| Setiya M et al., [4] | 0.97±0.03 | 1.01±0.03 | 0.97±0.03 | 1.01±0.03 |
| Dey S et al., [5] | 0.96±0.02 | 1.01±0.02 | 0.96±0.02 | 1.01±0.02 |
| Ebeye OA [14] | 0.98±0.04 | 0.98±0.05 | 0.94±0.08 | 1.02±0.10 |
| Aboul-Hagag KE et al., [15] | 0.96±0.01 | 0.98±0.01 | 0.96±0.01 | 0.98±0.01 |
| Kanchan T et al., [37] | 0.95±0.02 | 0.98±0.02 | 0.95±0.02 | 0.99±0.02 |
RR: Right index and ring finger ratio; LR: Left index and ring finger ratio; SD: Standard deviation
Sex differences as a morphological indication have been reported that male fingers were significantly longer than female fingers [1,5,15,37,38]. In the present study, similar to these previous studies, IFL and RFL were significantly longer in males than females for both hands. In females, IFL and RFL were tend to be almost of equal length. RFL was found to be longer as compared to the IFL between both hands of males and females, supporting to the studies by Sen J et al., Ibrahim MA et al., and Aboul-Hagag KE et al., [1,2,15]. However, several studies reported bilateral variations in IFL and RFL among individuals referencing to some ethnic populations [18,37]. In the current study, statistically significant bilateral variations were observed in RIFL and LIFL for both sexes in Turkish adults. However, significant side differences were not found between right and left hands for RRFL and LRFL among both sexes. Bilateral asymmetry in the RFL could affect derivative values in the current study. So, the findings obtained from one side, can not be applicable to the other side in both sexes. The IFL/RFL ratio is not considerably connected with the age and stature for both sexes, and is considered to be a sexually dimorphic marker. In addition to this it is free of body dimensions [1,39]. Previous studies on finger ratios have shown that the males have a lower IFL/RFL ratio than females [2-4,15,40]. Unlike these studies, in the present study, the mean values of IFL/RFL ratio were similar in right and left sides among both sexes. The sex differences in IFL/RFL ratio were not observed to be statistically significant on right and left hands which can be based on population variations, number of sample, different age range of individuals. Our finding agrees with earlier reports as by Sen J et al., and Dey S et al., [1,5].
Various studies have used sectioning point analysis to estimate the sex and this value was developed from mean male and female values. In the current study, a more strong BLR analysis was used to determine the sex and the sectioning point in logistic regression analysis are taken as 0.50. Since there was no significant sex differences in IFL/RFL ratio, this rate was not taken into account in BLR models. Recent studies on determining the sex have utilised ROC analysis to estimate the accuracy of anthropometric variables in sexing based on AUC [1,2]. Our findings based on AUC curve showed that predictive probability decreases when IFL and RFL are evaluated together when compared to IFL and RFL evaluated individually. This finding in the current study was opposite to that reported from an Indigenous population of Eastern India [1]. When the validity of derived models were evaluated on test group, correct prediction percentage for models ranged between 70.0% and 75.00% for both sexes. The most successful predictor for classifying sex is RIFL (AUC=75.0%). LIFL (73.7%), LRFL (73.7%) and RIFL (75.0%) appear to be better predictors of sex than RRFL (70.0%) for determination of sex in Turkish adults.
Limitation
The sex estimation models developed in the current study were ground on adult individuals and not applicable for children, adolescents or elderly individuals. Further researches taking bigger sample sizes and in various societies are essential to confirm the probability of utilising index and ring finger lengths and ratios in the identification of sex for medico-legal investigations. These findings can not be practicable for decomposed and swollen dead bodies that influence hand size.
Conclusion
When extremities or other body parts are not available for forensic investigation, estimation of sex from the IFL and RFL measurements is a complementary approach. The current research has suggested the implementation of IFL and RFL models to predict sex for Turkish adults. It is recommended that index and ring finger lengths are useful and practical predictors of sex and could be utilised to predict sex of the individuals when more dependable approach for sex estimation are not existing during forensic investigations.
RIFL: Right index finger length; LIFL: Left index finger length; RRFL: Right ring finger length; LRFL: Left ring finger length; RR: Right index and ring finger ratio; LR: Left index and ring finger ratio; SD: Standard deviation; df: Degree of freedom
RIFL: Right index finger length; LIFL: Left index finger length; RRFL: Right ring finger length; LRFL: Left ring finger length; df: Degree of freedom, p<0.05 statistical significance
IFL: Index finger length; RFL: Ring finger length; SD: Standard deviation; *: Left and right finger measurements correlation coefficient (p<0.001)
IFL: Index finger length; RFL: Ring finger length; df: Degree of freedom; p: Paired samples t-test; p<0.05 statistical significance
LIFL: Left index finger length; LRFL: Left ring finger length; RIFL: Right index finger length; RRFL: Right ring finger length; SE: Standard error; p: BLR model coefficients significance value, Power (1-β): Observed power; RR: The estimated relative risk shown by the exp (B) and the 95% confidence interval; CI: Confidence interval
BLR: Binary logistic regression; LIFL: Left index finger length; LRFL: Left ring finger length; RIFL: Right index finger length; RRFL: Right ring finger length; NA: Not a single value; p: Hosmer and Lemeshow test; LL: Log likelihood; AIC: Akaike information criteria; BIC: Bayesian information criteria
BLR: Binary logistic regression; LIFL: Left index finger length; LRFL: Left ring finger length; RIFL: Right index finger length; RRFL: Right ring finger length; p: McNemar test significance value; κ: Kappa agreement statistic value.
RR: Right index and ring finger ratio; LR: Left index and ring finger ratio; SD: Standard deviation