Sigma (σ) is the mathematical symbol for Standard Deviation (SD). Six sigma is an evolution in quality management that is being widely implemented in business and industry in the 21st century. Six sigma is a process quality measurement and improvement program developed by Motorola, in the early 1980s to reduce the cost of products, eliminate defects and decrease variability in processing. These steps are universal and could be applied in healthcare. It consists of five steps: Define, Measure, Analyse, Improve and Control (DMAIC) [1]. Six sigma provides a more quantitative frame work for evaluating process performance with evidence for process improvement and describes how many sigma fit within the tolerance limits [2]. Quality is assessed on the σ scale with a criterion of 3 σ as the minimum allowable sigma for routine performance and a sigma of six being the goal for world-class quality [3]. Each sigma metric corresponds to a certain value of defects per million opportunities (DPMOs) on a sigma scale, 6 σ corresponds to 0.002 DPMO and 3 σ error rate 2700 and 1 σ, 317400. This strategy can be used in reducing data entry errors and to better define the variation of a pneumatic tube system in the pre-analytical phase or to reduce post-analytical errors [4]. The present study was undertaken to evaluate the quality in a new clinical biochemistry laboratory and to take corrective measures to improve the analytical performance on sigma scale.
Materials and Methods
The present retrospective study was conducted at the Clinical Biochemistry Laboratory of a Government Hospital: the Department of Biochemistry, Niloufer Hospital for women and children, Hyderabad, Telangana, India. IQC and EQAS data of six months (February 2018 to July 2018) were analysed retrospectively for the 16 most common parameters, namely, Albumin, Alkaline Phosphatase (ALP), Alanine Transaminase (ALT), Amylase, Aspartate Transaminase (AST), bilirubin-direct, bilirubin-total, calcium, High-Density Lipoprotein (HDL-C), total cholesterol, creatinine, glucose, total protein, urea, uric acid and Phosphorus. Authors ran both levels of controls i.e., L1 normal range and L2 abnormal range controls on Beckman Coulter AU5800 fully auto analyser, using Bio-Rad controls. The laboratory QC policy was to run these controls and verify the Levy Jennings chart to pass the QC for the day and to take corrective actions if any and then only commence to process the patient samples and reporting of results to the concerned wards in the hospital. The sigma metrics for the various analytes was calculated by the following equation:
∑(σ)=(TEa-bias)/CV {TEa—total allowable error%; CV—coefficient of variation%}Total allowable error: TEa is a model that combines both imprecision and bias (trueness) of a method to calculate the impact on a test result. Analytical Quality Requirements are defined by Clinical Laboratory Improvement Amendments (CLIA) of 1988 Proficiency Testing Criteria in terms of TEa for acceptable performance for each analyte. TEa values of various parameters were taken from the CLIA guidelines [5]. As CLIA does not provide TEa source for direct bilirubin, authors used Biological Variation (BV) as TEa source (the Ricos biological variability database, desirable target values, in contrast to the minimal or optimal target values from the Westgard website [6,7].
Bias: The difference between the average value and the true value is the bias, which is expressed numerically and so is inversely related to the trueness. Bias was computed from the External Quality Assurance records (a monthly EQAS program run by Bio-Rad) of the peer group data, using the following formula: Bias (%)=(mean of all laboratories using same instrument and method-our mean)/mean of all laboratories using same instrument and method)×100.
Coefficient of variance (CV): The degree of precision is usually expressed on the basis of statistical measures of imprecision (CV%). CV was determined from the calculated laboratory mean and calculated SD procured from the IQC data over the last six months: CV(%)=(SD/Laboratory mean)×100.
Statistical Analysis
The statistical analysis was done using Windows 7, MS Excel. The CV data were obtained from the auto analyser software for each month as an average of daily CV values (as %) for two levels of controls separate and again averaged for the six months by Excel sheet for L1 and L2 levels. Bias data (as %) were taken from the QC Net Bio-Rad online website. The six-month bias was then averaged by the Excel sheet. Sigma values were calculated by Excel sheet by applying the formula; the difference of TEa and bias divided by the CV, for both the levels. The six sigma scale chart was prepared from the Excel sheet.
Results
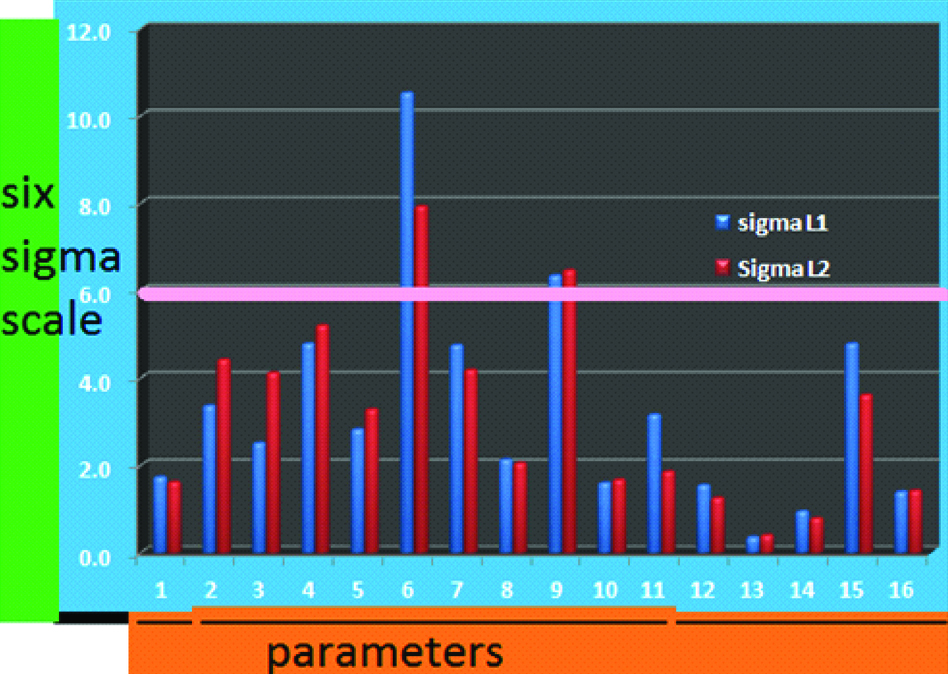
Authors have calculated monthly CV% (imprecision) and averaged it for each of 16 parameters for both levels; L1 and L2 [Table/Fig-1,2] and the percentage of bias from the peer group data obtained from Bio-Rad EQAS online reports (inaccuracy) are shown in [Table/Fig-3]. The TEa data from CLIA guidelines for all parameters except for direct bilirubin, which we took the values from the BV and calculated sigma metrics for the six months period for both levels of controls, are shown in [Table/Fig-4]. Authors got similar sigma values for both the levels. A total of nine parameters viz., Albumin, AST, Total Cholesterol, Creatinine, Glucose, total Protein, Urea, Phosphorus and Calcium are of sigma metrics is ≤3.0 and four parameters viz., ALT, ALP, total bilirubin and uric acid have σ ≤5. Whereas Amylase had a σ of ≥5 and only 2 out of 16 tests, direct bilirubin and HDL-C achieved six sigma values [Table/Fig-4,5].
Coefficient of variation (CV) % for level 1 controls for IQC for six months (February to July 2018).
| Parameter | February-18 | March-18 | April-18 | May-18 | June-18 | July-18 | Average |
|---|
| Albumin | 6.2 | 7.15 | 2.75 | 8.65 | 3.38 | 2.85 | 5.163 |
| ALP | 3.73 | 8.04 | 14.9 | 9.02 | 5.86 | 4.84 | 7.731 |
| ALT | 6.33 | 6.88 | 3.22 | 11.89 | 5.87 | 7.35 | 6.923 |
| Amylase | 6.52 | 4.33 | 5.34 | 7.65 | 5.38 | 4.27 | 5.581 |
| AST | 7.37 | 4.57 | 4.71 | 9.07 | 4.95 | 4.04 | 5.785 |
| Bilirubin-Direct | 4.19 | 5.09 | 3.27 | 7.14 | 3.08 | 1.79 | 4.093 |
| Bilirubin-Total | 5.08 | 4.2 | 1.92 | 5.26 | 2.65 | 3.22 | 3.721 |
| Calcium | 3.62 | 6.33 | 1.44 | 5.46 | 4.41 | 1.69 | 3.825 |
| HDL-C | 5.55 | 3.37 | 2.55 | 6.35 | 3.44 | 4.78 | 4.34 |
| Total Cholesterol | 6.02 | 3.46 | 2.01 | 8.65 | 4.15 | 2.11 | 4.4 |
| Creatinine | 4 | 4.24 | 3.22 | 6.94 | 3.42 | 2.35 | 4.028 |
| Glucose | 4.88 | 5.47 | 2.97 | 7.13 | 1.96 | 3.07 | 4.246 |
| Total Protein | 8.24 | 9.89 | 19.05 | 15.36 | 8 | 11.43 | 11.995 |
| Urea | 4.24 | 4.79 | 13.04 | 6.25 | 4.12 | 2.84 | 5.88 |
| Uric Acid | 2.35 | 3.22 | 1.97 | 5.94 | 3.72 | 1.59 | 3.131 |
| Phosphorus | 5.88 | 3.42 | 2.68 | 8.46 | 5.99 | 1.71 | 4.69 |
Coefficient of variation (CV) % for level 2 controls for IQC for six months (February to July 2018).
| Parameter | February-18 | March-18 | April-18 | May-18 | June-18 | July-18 | Average |
|---|
| Albumin | 6.13 | 6.83 | 2.92 | 11.87 | 3.05 | 2.26 | 5.51 |
| ALP | 2.34 | 7.02 | 5.24 | 10.98 | 5.08 | 4.62 | 5.88 |
| ALT | 2.24 | 3.99 | 3.07 | 10.57 | 2.47 | 2.91 | 4.208 |
| Amylase | 5.42 | 3.23 | 4.6 | 9.4 | 4.53 | 3.63 | 5.135 |
| AST | 5.01 | 3.87 | 4.3 | 9.36 | 5.23 | 2.08 | 4.975 |
| Bilirubin-Direct | 5.25 | 7.23 | 5.04 | 7.69 | 4.41 | 2.98 | 5.433 |
| Bilirubin-Total | 2.81 | 3.83 | 3.11 | 7.68 | 3.87 | 4.05 | 4.225 |
| Calcium | 3.62 | 5.31 | 1.58 | 8.16 | 3.87 | 1.37 | 3.985 |
| HDL-C | 3.59 | 3.62 | 3.14 | 7.31 | 3.39 | 4.51 | 4.26 |
| Total Cholesterol | 3.82 | 3.47 | 2.63 | 10.41 | 3.55 | 1.41 | 4.215 |
| Creatinine | 3.13 | 3.12 | 3.51 | 8.46 | 3.35 | 19.58 | 6.858 |
| Glucose | 6.29 | 3.95 | 2.26 | 9.51 | 1.89 | 7.54 | 5.24 |
| Total Protein | 9.39 | 5.77 | 15.1 | 13.77 | 7.94 | 11.5 | 10.578 |
| Urea | 4.19 | 4.35 | 18.01 | 8.28 | 4.3 | 3.04 | 7.028 |
| Uric Acid | 6.82 | 2.24 | 2.07 | 8.6 | 3.81 | 1.37 | 4.151 |
| Phosphorus | 3.65 | 3.77 | 2.7 | 10.54 | 5.5 | 1.41 | 4.595 |
Bias % for the 16 parameters; (Bio-Rad) EQAS cycles 16 to 17.
| Parameter | February-18 | March-18 | April-18 | May-18 | June-18 | July-18 | Average Bias% |
|---|
| Albumin | -1.35 | 0.562 | 0.649 | -0.167 | -0.01 | 3.77 | 1.1 |
| ALP | 6.1 | 6.15 | 0.555 | -0.878 | 1.88 | 8.6 | 4.0 |
| ALT | 5.61 | 3.71 | 2.33 | 0.19 | 2.32 | 1.95 | 2.7 |
| Amylase | -6.03 | -0.52 | 3.98 | 6.28 | 0.66 | 2.4 | 3.3 |
| AST | -1.23 | 3.2 | 8.04 | -1.46 | -5.8 | -2.47 | 3.7 |
| Bilirubin-Direct | 3.95 | 0.163 | 1.4 | 0.269 | 2.78 | 0.07 | 1.4 |
| Bilirubin-Total | 0.162 | 1.27 | 4.84 | -1.59 | -2.62 | 3.49 | 2.3 |
| Calcium | -2.01 | 1.77 | -2.68 | -2.88 | 1.8 | -5.92 | 2.8 |
| HDL-C | 1.95 | 3.07 | -5.58 | 1.04 | 0.88 | 2.33 | 2.5 |
| Total Cholesterol | -0.107 | 2.52 | -4.8 | -2.02 | -4 | -4.37 | 3.0 |
| Creatinine | 3.82 | 3.67 | -2.1 | -2.29 | -0.9 | -0.898 | 2.3 |
| Glucose | -1.83 | 4.01 | 4.69 | 2.33 | 2.35 | 5.47 | 3.4 |
| Total Protein | -6.49 | -6.67 | -2.42 | -7.02 | -12 | 0.094 | 5.8 |
| Urea | 7.97 | 0.646 | -1.77 | 3.83 | 1.48 | -5.04 | 3.5 |
| Uric Acid | 0.857 | 0.8 | -1.81 | 2.13 | -3.72 | -2.81 | 2.0 |
| Phosphorus | 2.64 | 0.527 | -2.42 | 5.16 | 4.46 | 5.69 | 3.5 |
Sigma values for the 16 parameters (BV*) for the six months period.
| Parameters | TEa% | BIAS% | CV% L1 | CV% L2 | Sigma L1 | Sigma L2 |
|---|
| 1 | Albumin | 10 | 1.1 | 5.163 | 5.51 | 1.7 | 1.6 |
| 2 | ALP | 30 | 4.0 | 7.731 | 5.88 | 3.4 | 4.4 |
| 3 | ALT | 20 | 2.7 | 6.923 | 4.208 | 2.5 | 4.1 |
| 4 | Amylase | 30 | 3.3 | 5.581 | 5.135 | 4.8 | 5.2 |
| 5 | AST | 20 | 3.7 | 5.785 | 4.975 | 2.8 | 3.3 |
| 6 | Bilirubin-Direct | 44.5 | 1.4 | 4.093 | 5.433 | 10.5 | 7.9 |
| 7 | Bilirubin-Total | 20 | 2.3 | 3.721 | 4.225 | 4.7 | 4.2 |
| 8 | Calcium | 11 | 2.8 | 3.825 | 3.985 | 2.1 | 2.0 |
| 9 | HDL-C | 30 | 2.5 | 4.34 | 4.26 | 6.3 | 6.5 |
| 10 | Total Cholesterol | 10 | 3.0 | 4.4 | 4.215 | 1.6 | 1.7 |
| 11 | Creatinine | 15 | 2.3 | 4.028 | 6.858 | 3.2 | 1.9 |
| 12 | Glucose | 10 | 3.4 | 4.246 | 5.24 | 1.5 | 1.3 |
| 13 | Total Protein | 10 | 5.8 | 11.995 | 10.578 | 0.4 | 0.4 |
| 14 | Urea | 9 | 3.5 | 5.88 | 7.0283 | 0.9 | 0.8 |
| 15 | Uric Acid | 17 | 2.0 | 3.131 | 4.1516 | 4.8 | 3.6 |
| 16 | Phosphorus | 10 | 3.5 | 4.69 | 4.595 | 1.4 | 1.4 |
Six sigma scale for the 16 parameters (in the same order) for both levels.
Discussion
Sigma metrics were computed using the data coming from the measurement of QC materials to be used as quality indicators that represent the balance between quality requirements (TEa) and test variation (bias and CV). Thus, six sigma focuses on gathering data for analysis, which is used for Quality Assurance (QA). Laboratory errors thus can be reduced by maintaining ±6 SD between the mean value and the range [8].
In the present study, authors have selected a six months period as a six-month CV is considered representative of true test variation because many different laboratory technicians will perform QC measurements, and significant events, such as calibration or manufacturer maintenances will occur in that time frame. Unfortunately, there are currently no guidelines published regarding the sigma metric calculation [8]. Out of 16 parameters which are the most frequently ordered tests in the present hospital, authors realised that only two analytes, direct bilirubin and HDL-C were of six sigma status, performing excellently at both levels of controls. This implied that the methodology was appropriate for the range of results, which were reporting [9]. Amylase was the next to six sigma with 4.8 σ (L1) and 5.2 σ (L2) values; the test that suited for the purpose where no additional QC strategy was required. ALT (L2), ALP, total bilirubin and uric acid were of ≤5 σ for two levels of controls. These tests were average performers but were suited for purpose. Creatinine (L1), uric acid (L2), ALP (L1), AST (L2) were poor performing tests with 3-4 σ, which may need two levels of QC twice a day. The rest of the analytes at two levels viz. albumin, calcium, total cholesterol, glucose, total protein, urea and Phosphorus with AST and ALT (L1), creatinine (L2) were problematic tests that need immediate QC frequency of three levels three times a day as well as testing patient specimens in duplicate [8].
The present authors compared new laboratory sigma metrics with several Indian clinical laboratory sigma metrics scenario as shown in [Table/Fig-6] and found the present sigma metrics were discouraging [10-15].
Comparison of various Indian studies on six sigma performance [10-15].
| Researcher | Study Period (Month) | No. of Parameter | Instrumentation | CV Source | BIAS Source | TEa Source | Sigma L1 and L2 |
|---|
| >6 | 3-6 | <3 |
|---|
| Singh B et al., [10] | 6 | 15 | Olympus | Randox | RIQAS | CLIA | 4 | 6 | 5 |
| Nanda SK et al., [11] | 6 | 13 | Cobas Integra | Bio-Rad | CMC | CLIA | 5 | 3 | 4 |
| Chaudhary NG et al., [12] | 4 | 10 | ILAB-650 | Bio-Rad | Bio-Rad | CLIA | - | 7 | 3 |
| Chauhan KPC et al., [13] | 12 | 12 | Cobas Integra 400 Plus | Randox | Bio-Rad | CLIA | 6 | 6 | 2 |
| Kumar BV et al., [14] | 12 | 16 | VITROS 4600 | Bio-Rad | Bio-Rad | CLIA | 4 | 7 | 5 |
| 4 | 8 | 4 |
| Lakshman M et al., [15] | 12 | 23 | - | - | - | RICOS | 11 | 10 | 2 |
| 11 | 12 | - |
| The present study | 6 | 16 | Beckman AU5800 | Bio-Rad | Bio-Rad | CLIA and BV | 2 | 5 | 9 |
| 2 | 4 | 8 |
The variables that affect such a comparison include, the heterogeneous nature of data collection, the differences in methodologies, different IQC materials, different proficiency testing bodies giving bias and the time interval upon which Sigma metrics is calculated, study period with cumulative bias and different environmental conditions in addition to the different analytical or clinical benchmarks that are chosen for evaluation of TEa [16]. It also would be preferable to assess bias against a reference method or material.
These are all the factors to be considered before interpreting the sigma metrics of a particular laboratory. As new laboratory became automated a year ago and stringent QC practises were started only recently, the sigma metrics we achieved were regarded as a guideline for QC policies to be adopted towards future perfection. In a recent study by Westgard S and Chararuks N, 100% of laboratories and instruments can achieve CLIA and Rilibak performance specifications, indicating that these TEa goals may be too lenient. These quality requirements may function more like a rubber stamp than a performance standard. Using either the 2014 “Ricos goal” or the 2017 revised “Ricos goal” still provides a high rate of success for laboratories to achieve acceptable performance on the Sigma-metric scale [17].
As per NABL guidelines, frequency and number of QC samples to be run as per the sample load is as follows: <25 per day-one level QC once a day; 25-75 per day-two level QCs once a day; >75 per day-two level QCs at least twice a day [18]. Simple guidelines for choosing the Westgard rules and levels of QC as proposed by Westgard and another guideline as published by Cooper G et al., suggests grouping of tests as per sigma performance and QC strategy [Table/Fig-7] [9].
QC strategies recommended for our laboratory sigma values as per Westgard and Cooper.
| Parameters | σ L1 | σ L2 | Westgard rules | Cooper guidelines |
|---|
| 1 | Albumin | 1.7 | 1.6 | <3.5 σ: maximum affordable levels of QC per day with a 13s/2 22s/R 4s/4 1 s rule | <3 σ (problems) – maximum QC, 3 levels, 3/day.Preferably testing specimens in duplicate |
| 2 | ALP | 3.4 | 4.4 | 4 σ: 3 or 4 levels of QC per day with a 13s/2 22s/R 4s/4 1 s rule | 3 σ-4 σ (poor performers)–combination of rules with two levels of QC twice per day |
| 3 | ALT | 2.5 | 4.1 | 3.5 σ: 6 of QC per day with a 13s/2 22s/R 4s/4 1 s rule | do |
| 4 | Amylase | 4.8 | 5.2 | 5 σ: 2 or 3 levels of QC per day with a 12.5s or 13s rule | 4 σ-6 σ (suited for purpose)–two levels of QC per day and the 12.5s rule. |
| 5 | AST | 2.8 | 3.3 | <3.5 σ: maximum affordable levels of QC per day with a 13s/2 22s/R 4s/4 1 s rule | <3 σ (problems)–maximum QC, 3 levels, 3/day.Preferably testing specimens in duplicate |
| 6 | Bilirubin-Direct | 10.5 | 7.9 | ≥6 σ: 2 levels of QC per day with a 13.5s greater rule | >6 σ (excellent tests)–one QC per day (alternating levels between days) and a 13s rule. |
| 7 | Bilirubin-Total | 4.7 | 4.2 | 4 σ: 3 or 4 levels of QC per day with a 13s/2 22s/R 4s/4 1 s rule | |
| 8 | Calcium | 2.1 | 2.0 | <3.5 σ: maximum affordable levels of QC per day with a 13s/2 22s/R 4s/4 1 s rule | <3 σ (problems) – maximum QC, 3 levels, 3/day.Preferably testing specimens in duplicate |
| 9 | HDL-C | 6.3 | 6.5 | ≥6 σ: 2 levels of QC per day with a 13.5s greater rule | >6 σ (excellent tests)–one QC per day (alternating levels between days) and a 13s rule. |
| 10 | Total Cholesterol | 1.6 | 1.7 | <3.5 σ: maximum affordable levels of QC per day with a 13s/2 22s/R 4s/4 1 s rule | <3 σ (problems)–maximum QC, 3 levels, 3/day.Preferably testing specimens in duplicate |
| 11 | Creatinine | 3.2 | 1.9 | do | do |
| 12 | Glucose | 1.5 | 1.3 | do | do |
| 13 | Total Protein | 0.4 | 0.4 | do | do |
| 14 | Urea | 0.9 | 0.8 | do | do |
| 15 | Uric Acid | 4.8 | 3.6 | 4 σ: 3 or 4 levels of QC per day with a 13s/2 22s/R 4s/4 1 s rule | |
| 16 | Phosphorus | 1.4 | 1.4 | <3.5 σ: maximum affordable levels of QC per day with a 13s/2 22s/R 4s/4 1 s rule | do |
In a nutshell, for lower sigma values, more QC samples and more powerful QC rules are recommended. In general, for large sigma value processes (≥6 σ) simple QC rules with low false rejection rates are adequate. For intermediate sigma value processes (3.5-6 σ) quality goals are met with more elaborate QC strategies. For low sigma values (<3.5 σ) reducing analytical bias and imprecision is a key to improving the quality [9,19,20].
Limitation
The present study could have been better if the authors had computed the six sigma for a complete cycle, i.e., 12-months period as this could improve the present new laboratory CV and bias averages and thus a possible better outcome could have been achieved in sigma metrics.
Conclusion
Six sigma is a management methodology for application in clinical laboratories to quantify the quality of laboratory test performance. In a new laboratory set-up like the present, which caters to paediatric sample testing round the clock, authors have focussed on delivering minimal erroneous results for which sigma metrics are a powerful QC tool. As six sigma application in QC procedures for a clinical laboratory is still under evolutionary phase, most of the data and guidelines come from western countries. Understanding and implementing the six sigma applications to the pre-analytical, analytical and post-analytical phases of testing process, as well as comparing the instrumentation within the laboratory and peer groups is a forward step towards achieving patient safety and quality goals.