Diabetes mellitus is a metabolic disorder characterised by fasting or post-prandial hyperglycaemia caused by altered glucose metabolism due to deficiency in insulin and/or abnormalities in insulin action [1]. It affects various organs in the body. Structural changes have been noted in all the corneal layers including the epithelium and its junctional complexes, stroma as well as the endothelium in diabetics [2] leading to altered corneal physiology. Corneal thickness and biomechanical properties have been studied in diabetics. Most studies have shown increased Central Corneal Thickness (CCT) in diabetics [3-11] in comparison to normal subjects. However, a few studies have not shown any difference [12,13]. Changes in corneal biomechanical properties like corneal hysteresis and corneal resistance factor have also been noted in diabetics [14-19]. Relationship of CCT with various parameters like the duration of diabetes [3,12,20], severity of the retinopathy [8,10,12,21], and renal status [11] have been studied. CCT is now a well established routine test done in patients with glaucoma as changes in CCT can affect the Intraocular Pressure (IOP) measurements by Goldmann Applanation Tonometry (GAT), the gold standard for IOP measurements, with IOP being overestimated in thicker corneas and underestimated in thinner corneas [22].
Materials and Methods
This cross-sectional observational study was conducted at the Departments of Ophthalmology and Low Cost Effective Care Unit (LCECU), Christian Medical College, Vellore between November 2015 and July 2016. The study population consisted of patients who are screened in the community for diabetes. Most of these patients belonged to the urban slums from a low socio-economic background. Those diagnosed with diabetes in the community were called to the Low Cost Effective Care Unit for further evaluation and management of diabetes as per management protocol. These patients are evaluated by the physician at LCECU. Routine management of diabetes is based on fasting blood sugar and Post-Prandial Blood Sugar (PPBS) estimations done at monthly intervals and changes in anti-diabetic medications if required as advised by the treating physician. The type 2 diabetic patients who were sent to the laboratory by the physician for routine PPBS estimation were screened by the ophthalmologist for eligibility to enroll into the study. Changes in CCT was studied at 1 month as this was the routine follow-up schedule for monitoring blood sugars in these patients. Though estimation of HbA1c which reflects glycaemic control over 2-3 months would have been ideal, given the costs involved, HbA1c level estimation was possible only in few patients who could afford it. Hence changes in CCT with changes in PPBS rather than changes in HbA1c was studied. Patients satisfying the inclusion and exclusion criteria as given below were enrolled into the study after an informed consent.
Inclusion Criteria
Patients with type 2 diabetes mellitus more than 18 years of age. Patients with PPBS ≥200 mg/dL based on guidelines for hyperglycaemia by the American Diabetic Association (ADA) [24], were defined as hyperglycaemic for analysis in this study.
At 1 month follow-up, patients with PPBS < 200 mg/dL based on guidelines for euglycaemia by the ADA [24], as well as a minimum reduction of ≥50 mg/dL were defined as euglycaemic for analysis in this study. This was based on the assumption that smaller changes in blood sugar levels were unlikely to affect CCT and could dilute the value of detected change in CCT with larger blood sugar differences.
Exclusion Criteria
(1) Serum creatinine >1.2 mg/dL and/or urine microalbumin >30 mg/dL
(2) Inability to perform optical biometry
(3) History of previous ocular surgery
(4) Use of contact lenses
(5) Any corneal pathology, glaucoma or uveitis
(6) Patients on routine topical eye medications
(7) History of laser photocoagulation within one month
The study was conducted after approval by the Institutional Review Board for ethical and scientific issues, Christian Medical College, Vellore, India (IRB Min No: 9688 [OBSERVE] dated 20.10.2015).
Patients fulfilling the inclusion criteria underwent CCT measurement within half an hour of the PPBS measurement. CCT was measured using Nidek AL Scan optical biometer, (Nidek Co., Ltd., Gamagori, Japan) by the optometrist posted in the investigation room. Only the right eye was included in the study. If the right eye did not fulfil the inclusion criteria as mentioned above, the left eye was included.
Sample Size Calculation
Sample size was calculated based on the study by Altay Y et al., on 52 diabetic patients [10]. Before treatment, in the hyperglycaemic state, the CCT was 552.30±29.26 μm and the HbA1c 9.36±1.79%. After glycaemic control, the CCT was 542.36±27.20 μm and the HbA1c 6.45±0.70%. The difference between the two CCT values was statistically significant (p=0.0001). Based on this, a sample size of 90 was calculated to be required to detect a change of 10 μm, with a power of 80% and a significance level of 1%.
Statistical Analysis
The quantitative variables CCT and PPBS were reported as mean±standard deviation. Paired t-test was used to compare mean changes in CCT between hyperglycaemic and euglycaemic PPBS levels and Pearson correlation coefficient was used to assess the relationship between CCT and PPBS levels. p<0.05 was considered significant. Analysis was done using Statistical Package for Social Services (SPSS) software version 21.0 (Armonk, NY: IBM Corp).
Results
A total of 226 Ty2DM patients who had hyperglycaemic PPBS levels were enrolled between November 2015 to July 2016. Of these, 89 patients achieved euglycaemic PPBS levels at one month as defined in the methodology and were included for analysis. Of the remaining 137 patients, 24 were lost to follow-up. Rest did not achieve euglycaemic PPBS levels at one month but achieved the same subsequently after changes and titration of anti-diabetic medications by the treating physician. Of the 89 patients finally 2 included, 23 were males and 66 were females. The mean age was 52.39 years (range 26-75 years) and the mean duration of diabetes was 7.4 years (1-30 years).
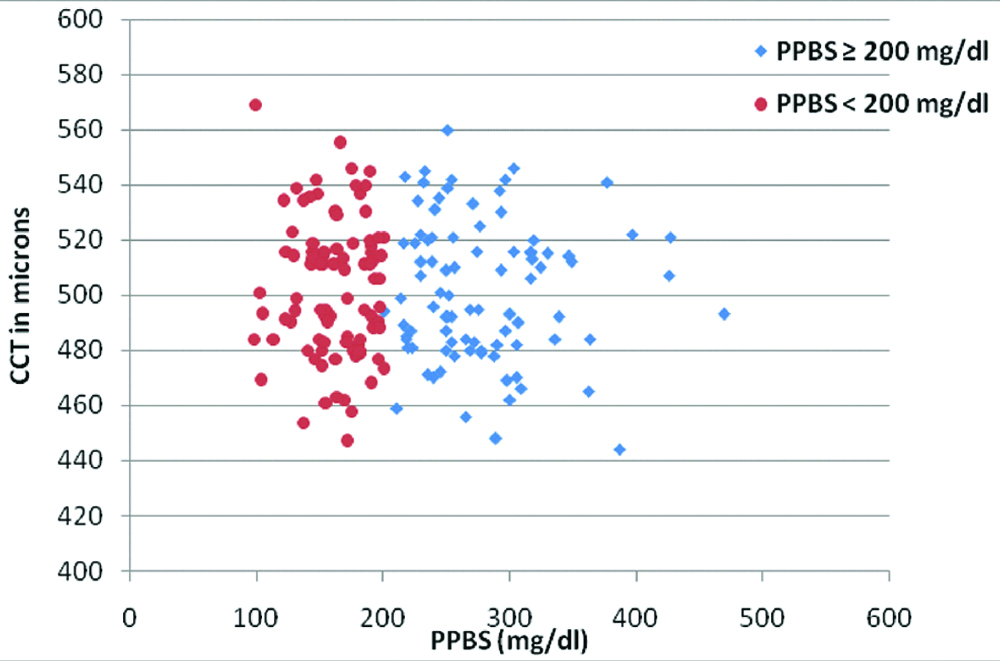
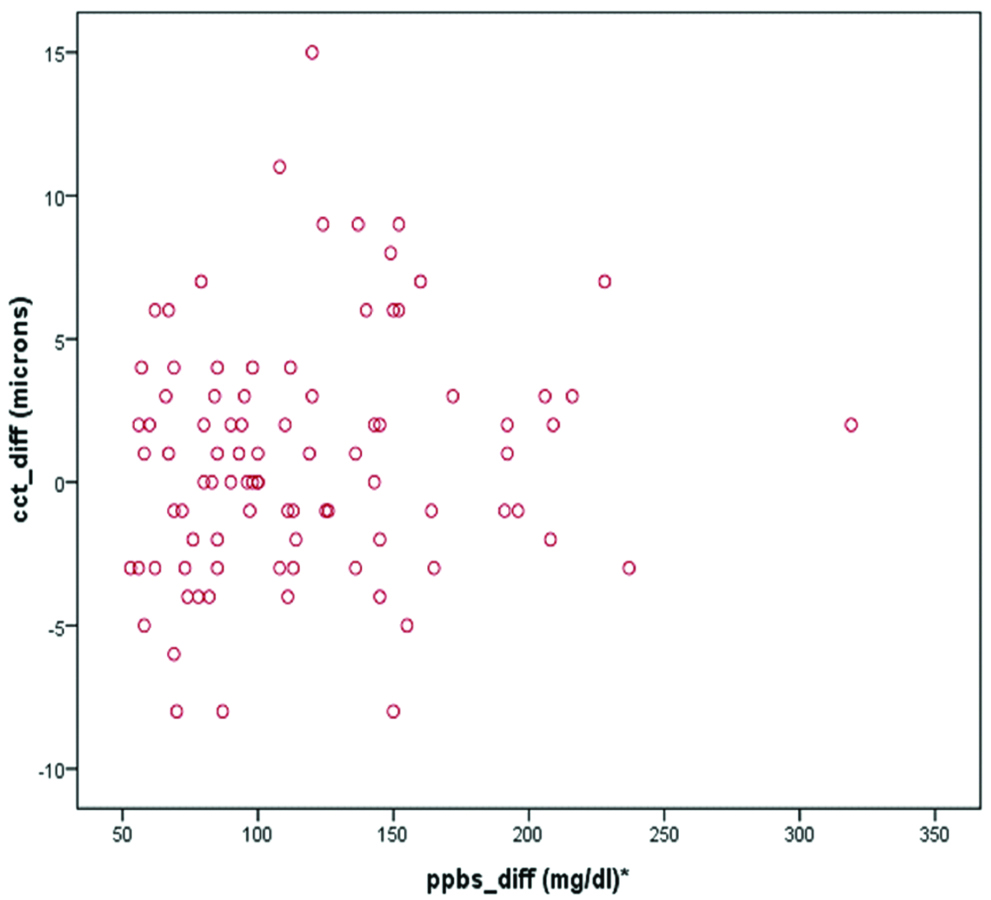
The mean hyperglycaemic PPBS was 278±53.45 mg/dL and euglycaemic PPBS was 161±26.69 mg/dL. The mean CCT in hyperglycaemia was 501.38±25.28 μm (range: 444 to 560 μm) and 502.20±25.05 μm (range: 447 to 569 μm) in euglycaemia, achieved at one month [Table/Fig-1]. There was no statistically significant difference in CCT (p=0.167). There was poor correlation [Table/Fig-2] between changes in PPBS levels and CCT (Pearson’s r=0.148).
Scatter plot showing the distribution of CCT measurements during hyperglycaemia (PPBS ≥200 mg/dL) and euglycaemia (PPBS <200 mg/dL).
Change in CCT versus change in glycaemic levels.
*Difference in PPBS levels between hyperglycaemia and euglycaemia
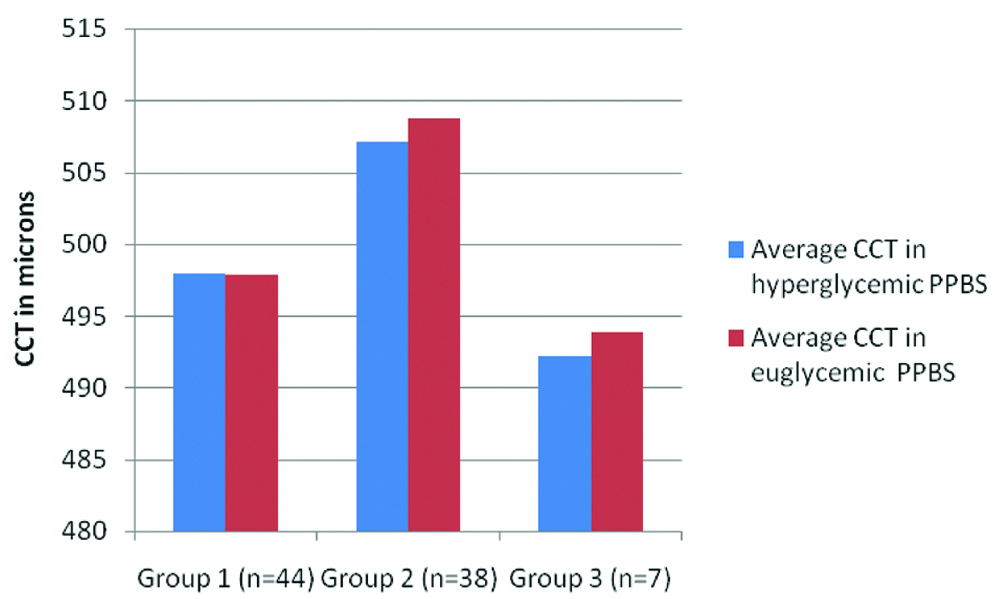
Changes in CCT according to the magnitude of reduction in blood sugars was looked into [Table/Fig-3]. For this, patients were divided into three subgroups. Group 1 included patients who had a 50-100 mg/dL reduction in PPBS, Group 2 were those with 101-200 mg/dL reduction and Group 3 comprised of patients with 201-320 mg/dL drop in PPBS. Even the ones with larger reductions did not show any obvious change in CCT. The numbers were too small to permit sub-group statistical analysis.
CCT during hyperglycaemic and euglycaemic PPBS levels in three groups.
Group 1: Patients with 50-100 mg/dL drop in PPBS; Group 2: Patients with 101-200 mg/dL drop in PPBS; Group 3: Patients with 201-320 mg/dL drop in PPBS
Discussion
With changing life styles and increased life expectancy in our population, the number of people affected by diabetes mellitus and glaucoma is bound to rise. According to Wild S et al., the prevalence of diabetes is expected to double globally from 171 million in the year 2000 to 366 million in the year 2030 [25]. Among the 40 to 80 year old population, glaucoma globally is estimated to affect 76.0 million people in 2020 and 111.8 million people in 2040 as compared to 64.3 million in 2013 [26]. Given the above figures, it is inevitable that coexisting glaucoma and diabetes will be increasingly encountered by ophthalmologists. IOP, the only known modifiable risk factor in glaucoma is routinely measured both for diagnosis and management. Changes in CCT can affect IOP measurements by GAT, the gold standard and the most commonly used instrument for estimation of IOP, with overestimation in thicker corneas and underestimation in thinner corneas [22]. CCT is also an independent risk factor, where eyes with thinner corneas are at a higher risk of glaucomatous damage [27,28]. Though other changes in corneal biomechanical properties like corneal hysteresis and corneal resistance factor have been noted in diabetics [14-19], and could affect IOP measurements independent of CCT, the latter is the most commonly measured parameter in routine ophthalmological clinical practice to estimate accuracy of GAT. Many studies have reported increased CCT [3-11] in diabetics. Though studies have looked for changes in CCT related to absolute glucose values [11,29] or HbA1c levels [7,9,11,12,29-31], there are very few studies that have documented changes in CCT with varying glycaemic levels in the same individual [10,23]. The present study was done to address the question of whether CCT changed with improved control of blood sugars, and if so, how this would affect IOP measurement. Hence the CCT was documented in diabetic patients during their routine follow-up for blood sugar measurements to look for any changes in CCT with improved glycaemic levels.
Patients with renal disease were excluded, as studies [11] have reported association between CCT and chronic kidney disease. Additionally, fluid accumulation in these patients may lead to altered corneal hydration. An attempt to analyse the data according to the presence or severity of retinopathy was not done as it has been widely reported that CCT does not vary according to severity of retinopathy [8,10,12,21].
In the present study, no association was found between the amount of reduction in blood sugars and variation in CCT [Table/Fig-2]. There was no difference in the mean CCT in diabetics with PPBS over 200 mg/dL (501.38±25.28 μm) versus those with PPBS less than 200 mg/dL (502.20±25.05 μm).
There are few studies which have looked into changes in CCT in hyperglycaemic and euglycaemic state in the same individuals. Huntjens B et al., studied the effect of short term fluctuation (12 hour) of blood sugar levels on refractive error, ocular aberrations as well as other anterior biometric parameters measured every 2 hours between 08:00 hours and 20:00 hours [23]. They found that short term fluctuations of sugars of up to 6 mM/L (108 mg/dL) on a time scale of few hours caused no changes in CCT in both well controlled and poorly controlled patients. CCT variation of around 5 μm was seen in both diabetics and controls, though CCT was thicker in diabetics compared to controls. The present study results are similar, though the CCT measurements in this study were not done over a single day but a month later, deliberately chosen so that a stable new glycaemic state could be assumed, with corresponding stabilisation of osmotic effects. CCT variation ≤5 μm between euglycaemic state as compared to hyperglycaemic state was seen in most patients. This variation is likely due to inter-test variability similar to the test-retest repeatability of CCT within 10 μm reported by Huang J et al., by optical biometry [32] and unlikely to be related to the magnitude of the reduction in blood sugars (avg 116.91±50.30 mg/dL; range 53-319 mg/dL). It is possible that no changes in CCT were seen in the present study due to the very short follow-up.
Studies have looked into varying levels of HbA1c and CCT [7,9,11,12,29-31], with a few studies finding no changes in CCT [7,12,30,31] and a few others finding thicker corneas with increased HbA1c levels [9,11,29]. In these studies, the absolute CCT values in the study patients were compared with the absolute HbA1c levels, but variation of CCT with changes in HbA1c levels in the same individual was not looked at. Only the study by Altay Y et al., sought to assess CCT in the same individuals at varying HbA1c levels and found CCT to be significantly reduced after glycaemic control had been achieved over an average of 6 months, as defined by the HbA1c levels [10]. In this study, the actual blood sugar levels at the time of measurement of CCT were not captured. More studies conducted over longer follow-up may show similar changes in CCT with stabilisation of glycaemic status as reflected by HbA1c levels.
Many studies have shown increased CCT in diabetics [3-11] as compared to normals, with CCT measurements of more than 540 μm in diabetics in most of these studies. In the present study, the corneal thickness both in hyperglycaemic and euglycaemic states was lower compared to the CCT documented in diabetics in other studies. The low CCT in this study could be explained by the variation in instrumentation used to measure CCT. Non-contact optical biometer was used whereas most other studies have used ultrasound pachymetry or specular microscope to measure CCT. CCT values measured by optical biometers have been documented to be lower than conventional ultrasound pachymetry devices by 20-30 μm depending on the devices used [33]. However optical biometry was chosen in the present study since the measurements are operator independent compared to ultrasound pachymetry which needs corneal contact and indentation which could lead to wide intra or inter-observer variation. In other studies [34, 35] in similar population, CCT measurements in normal individuals using ultrasound pachymetry is around 530 μm. Accounting for variation in instrumentation technique, the CCT measured among diabetics in the present study can be considered to be similar to normal individuals. There are other published data which support the premise that corneal thickness is not different in diabetics [12,13]. CCT measurement using optical biometry in a control group of normal non-diabetics would be ideal for comparison. However this was not within the scope of this study, whose sole aim was to look for variability in CCT in the same individuals with changing blood sugars.
Limitation
The limitations include: 1) The data from this study cannot be used to make assumptions related to duration of diabetes, status of retinopathy, level of HbA1c or the medications that the patients were on. A larger sample size to permit sub-group analysis would be needed; 2) Duration of follow-up was short; 3) CCT was measured within half an hour of the documented time of blood sugar measurements. This is probably the best practical approach, though the ideal would have been to have a simultaneous or much shorter time limit; 4) Significant numbers did not undergo HbA1c estimation and hence the data is not presented.
A much larger study population with controls, along with HbA1c measurements over longer follow-up would be ideal.
Conclusion
In summary, this study showed that in type 2 diabetics, variation in blood sugar levels did not result in significant changes in CCT. Hence in Type 2 diabetics with co-existing glaucoma, a single measurement of CCT is adequate to estimate CCT corrected GAT IOP values during routine follow-up. Re-measurement of CCT and re-calculation of CCT corrected GAT IOP is not required during varying blood sugar levels.