Accurate assessment of fluid status of a patient is an important goal in the operation theatre for the anaesthetist. This is required to achieve haemodynamic stability and adequate tissue perfusion to reduce the risk of postoperative complications [1]. Fluid overload is associated with higher rates of morbidity and mortality [2]. Inadequate fluid replacement can lead to prerenal failure.
Currently, dynamic indicators of fluid responsiveness such as SVV, Pulse Pressure Variation (PPV) or PVI are preferred over static indices such as central venous pressure and pulmonary capillary wedge pressure [3,4]. The FloTrac/Vigileo system (Edwards Lifesciences, Irvine, California, USA) can be used to measure arterial pressure-based on Cardiac Output (CO), Stroke Volume (SV) and SVV. SVV is a measure of change in stroke volume that occurs with change in intrathoracic pressure during respiration. With controlled mechanical ventilation, the stroke volume increases with inspiration and decreases during expiration. The percentage change is measured and displayed as SVV. It is calculated by taking the difference between the maximum stroke volume and the minimum stroke volume divided by the mean stroke volume. This requires an arterial line and hence becomes invasive. The more recent device Masimo Radical-7 monitor (Masimo Corp., Irvine, California, USA) calculates and displays PVI obtained from plethysmographic waveform. It is an automated measure of the dynamic change in the plethysmogram that occurs during a respiratory cycle and is similar to SVV. Masimo pulse oximeters are claimed to be accurate even at low perfusion states [5,6].
Fluid requirement in patients undergoing major bowel surgery has been a matter of debate and no consensus has been reached as to whether one should adopt liberal or restrictive strategy. Each has its proponents and the average anesthetist is still confused as to whether third space loss must be calculated at all or if calculated, how much should it be during these surgeries. A method that is objective and accurate would help eliminate guesswork involved in fluid therapy currently in these situations.
The primary objective of the study was to observe for concurrence between the pair of measurements of SVV and PVI. The secondary objective was to see whether the invasive SVV measurements can be replaced with PVI, a non-invasive measurement as a monitor of fluid requirement during major open bowel surgery.
Materials and Methods
This prospective observational study was conducted after obtaining approval from the Institutional Ethics Committee (Kasturba Hospital, Manipal. IEC: 463/2012). Duration of the study was of six months (April to October 2017). Procedures followed were in accordance with ethical standards of the responsible committee on human experimentation and with the Helsinki Declaration of 1975 that was revised in 2000. A written informed consent was obtained from all individual participants included in the study. Fifteen patients undergoing elective major bowel surgery such as gastrectomy, Whipple’s procedure and hemicolectomy were enrolled. Patients aged between 30-70 years, of either gender, belonging to ASA I and II physical status requiring invasive arterial pressure monitoring in view of the extensive surgery were enrolled. Patients undergoing laparoscopic surgery were excluded. Laparotomy followed by simple colostomy or jejunostomy were also excluded from the study.
Bowel preparation was done as per surgeon’s instructions on the day prior to surgery. All patients were seen by the anaesthesia postgraduate a day prior to surgery and they underwent routine preoperative assessment. All patients received Tab Alprazolam 0.25 mg and Tab Pantoprazole 40 mg, the night prior and on the morning of surgery. They were kept fasting as per standard ‘nil per oral’ guidelines.
In the operating room, a patent peripheral intravenous access (18 G or larger) was secured. Pre-induction monitoring included pulse oximetry, non-invasive blood pressure and electrocardiogram (Lead II and V5). Postinduction monitoring includes capnography, anaesthetic agent analyser {to maintain a Minimum Alveolar Concentration (MAC) of 1-1.3}, invasive arterial blood pressure (radial arterial line), urinary catheter and nasopharyngeal temperature.
All patients received general anaesthesia and epidural analgesia. After preoxygenation, anaesthesia was induced with 2-2.5 mg/kg of propofol and 2 μg/kg of fentanyl followed by neuromuscular blockade with vecuronium 0.1 mg/kg. After laryngoscopy and endotracheal intubation, anaesthesia was maintained using isoflurane in a mixture of nitrous oxide and oxygen. All patients were ventilated with a tidal volume of 8 mL/kg and at a rate required to maintain normocarbia. Analgesia and titration of anaesthetic were done by the anaesthetist in charge of the patient.
After induction of anaesthesia, a radial arterial line (20G) was secured for continuous monitoring of arterial blood pressure. The FloTrac sensor was attached to the arterial line and connected to the Vigileo monitor (Edwards Lifesciences, Irvine, California, USA - Version 3.02). Patient data such as age, sex, height and weight were entered, the system computed stroke volume from the patient’s arterial pressure signal and displayed cardiac output and SVV continuously.
A pulse oximeter probe (LNCS; Masimo Corp.) was placed on the index finger of one hand and connected to a Masimo Radical-7 monitor with PVI software (V.7.0.3.3). PVI calculation was accomplished by measuring changes in perfusion index over a time interval sufficient to include one or more complete respiratory cycles according to the inbuilt algorithm. The lower the number, the less was the variability in the PVI over a respiratory cycle.
The baseline readings of SVV and PVI were noted. Thereafter, patients were monitored continuously with FloTrac® (Edward Life Sciences) and a Masimo Rainbow® SET Pulse Co-Oximetry (Masimo Corporation, Irvine, CA) in addition to standard monitoring. The readings of SVV, PVI and the corresponding PI were noted every 10 minutes throughout the surgery.
All patients underwent surgery in supine position. The baseline fluid therapy was given at a rate of 2 mL/kg/h for maintenance. At the beginning of surgery irrespective of variation of SVV and PVI, 200 mL of colloid (6% hydroxyethyl starch) was given over a period of 10 min. Subsequently, additional fluid therapy was guided by SVV as shown by FloTrac®. If the stroke volume variation showed 13% or more, and it remained consistent over five minutes, an additional bolus of 200 mL of colloid was given over the next 10 minutes. The SVV was then observed for another ten minutes. Clinical assessment of changes in haemodynamic status were also considered. If the SVV reduced to less than 13%, no more bolus of fluid was given. The process was repeated until the SVV with the fluid therapy was within 13%. Colloids were given up to a maximum of 20 mL/kg as required, beyond which, fluid boluses were given using Ringer lactate.
Since SVV measured by FloTrac was invasive and well-established, these measurements were followed for any decision on fluid therapy. The PVI at each of these time points was observed to see whether there was any correlation between the measurements but no decision was based on them.
Maximum allowable blood loss was calculated as follows [7]:

Where Average haemoglobin (g%)={(Preoperative Hb+Target Hb)/2}
Allowable blood loss was replaced with colloids (hydroxyethyl starch) up to 20 mL/kg including the fluid boluses given during the procedure. Any blood loss exceeding the allowable blood loss was replaced with blood products as indicated. Use of vasopressors was left to the discretion of the attending anaesthesiologist. If a vasopressor was required, small doses of mephentermine were given intermittently. Vasopressors such as noradrenaline were not used in any of the patients. Fluid management was done as described above. Efforts to avoid intraoperative hypothermia included use of body warmer, fluid warmer and heat and moisture exchanger in all patients.
Statistical Analysis
Statistical analysis was performed using the SPSS 15.0 software. Values of continuous data are presented as mean (SD) or median (interquartile range) depending on skewness of the data; categorical variables are displayed as frequency distributions (n). The correlation between SVV and PVI measurements were compared by correlation coefficients. The average and difference between SVV and PVI with limits of agreement (±2SD) were plotted using Bland-Altman method. Interclass correlation coefficients with respect to individual patient data were expressed using R software.
Results
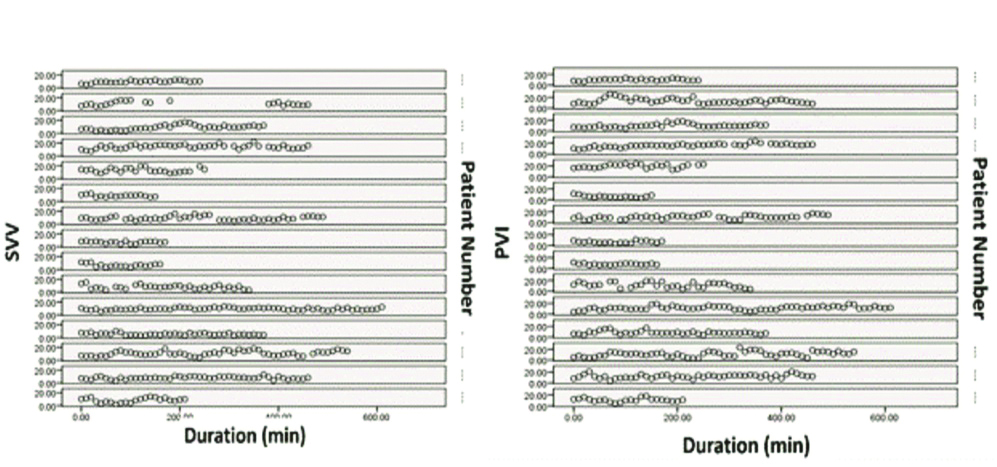
The demographic data are shown in [Table/Fig-1]. The surgical procedures and their duration are given in [Table/Fig-2]. A total of 516 pairs of measurements were obtained from 15 patients. Comparison of percentage variation in SVV and PVI with respect to time in all the patients are shown in [Table/Fig-3] which shows that the pattern of variation of both SVV and PVI was similar in all patients almost at every time point.
Demographic data of patients.
| Parameter | (n=15) |
|---|
| Age (years)-Mean (SD) | 54 (10) |
| Weight (kg)-Mean (SD) | 56 (8) |
| Height (cm)-Mean (SD) | 159 (8) |
| Gender (M/F)-(n) | 11/4 |
| American Society of Anesthesiologists Physical Status ASA PS I/II-(n) | 4/11 |
Duration of surgery and surgical procedures.
| Parameter | |
|---|
| Duration of surgery in min.-Mean (SD) | 352 (149) |
| Surgical procedures (n=15) | |
| Whipple’s procedure/Triple bypass | 6/1 |
| Abdomino-Perineal Resection (APR)/Low Anterior Resection (LAR) | 2/1 |
| Hemicolectomy | 2 |
| Gastrectomy | 2 |
| Sigmoid colectomy | 1 |
Comparison of percentage variation in SVV and PVI with respect to time.
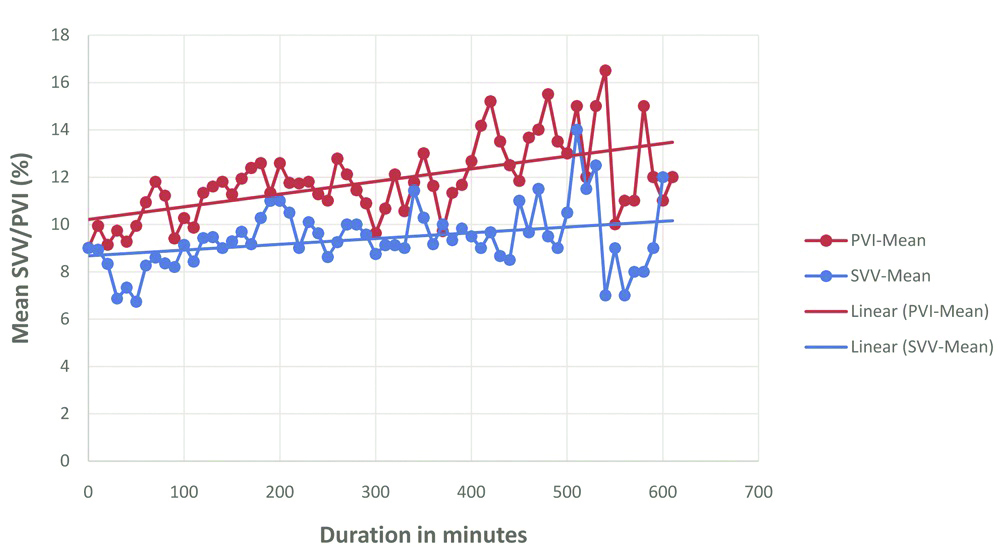
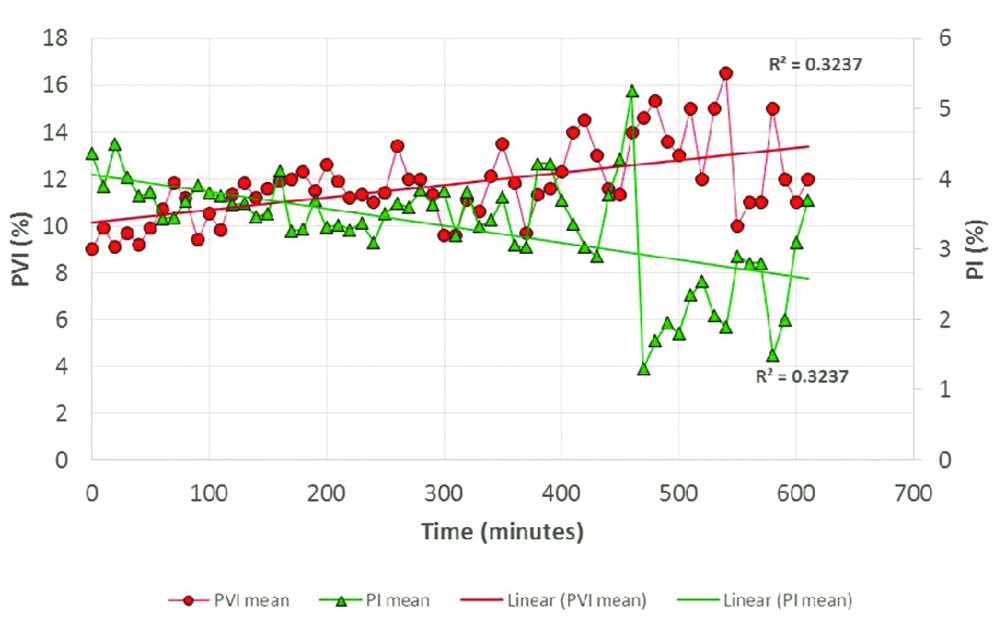
[Table/Fig-4] shows the mean SVV and PVI measured at different time points of measurement (0 min, 10 min, 20 min and so on) against time. PVI reading tend to show a higher value, approximately 2-3% higher than SVV till approximately 360 min of surgery after which the two values were divergent [Table/Fig-4].
Comparison of mean variation as measured by SVV and PVI with respect to time.
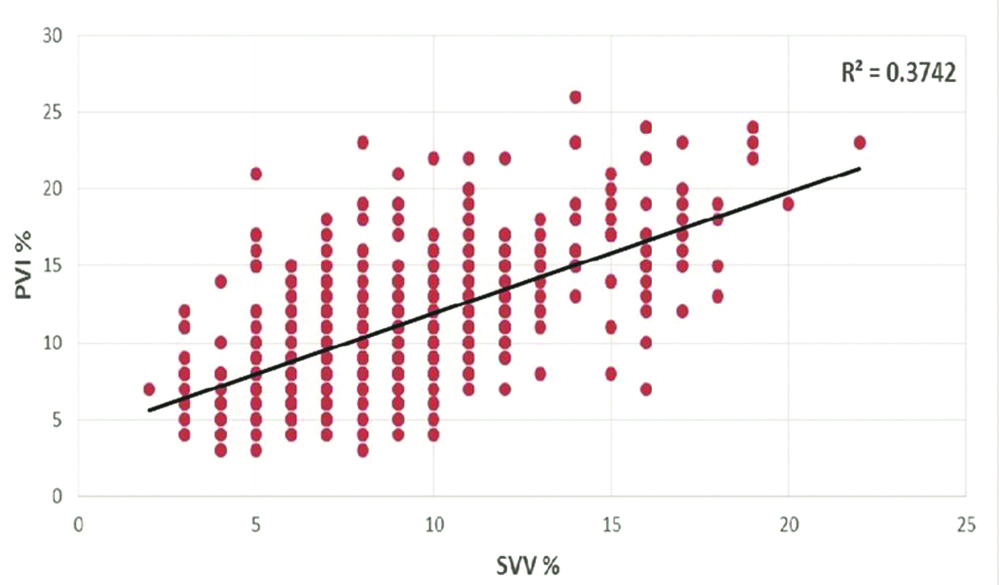
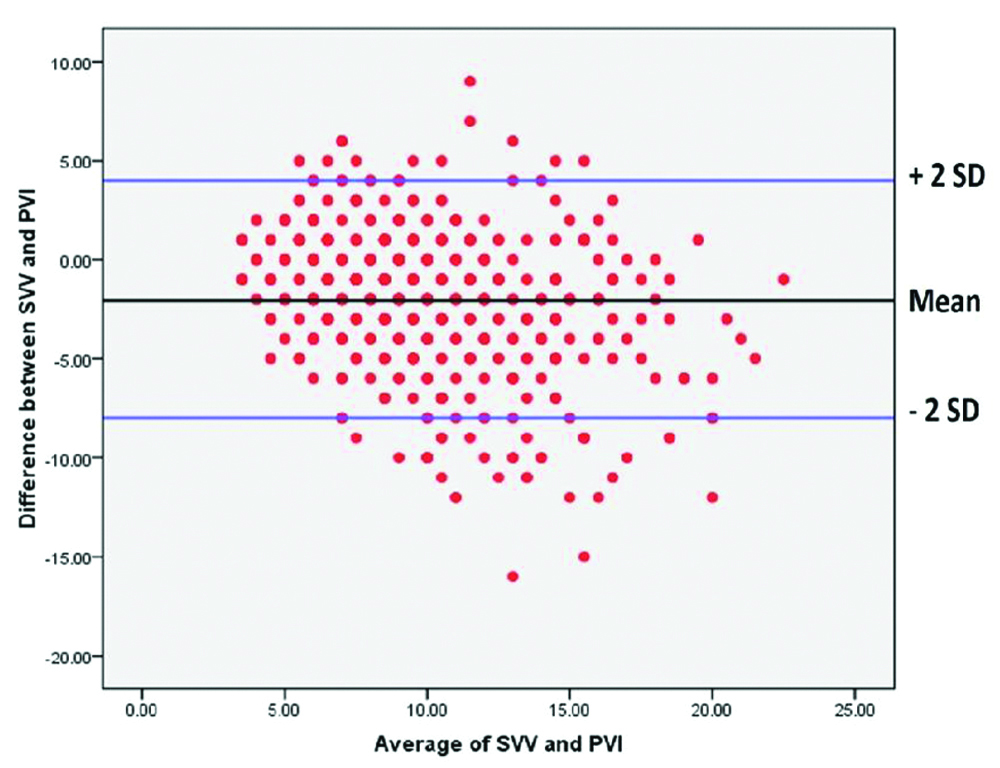
When individual readings of PVI and SVV were plotted against each other, there was very weak positive correlation (r=0.3742) [Table/Fig-5]. When all the individual values of SVV and PVI were plotted using Bland-Altman plot [Table/Fig-6], the scatter was found to be wide, reiterating lack of agreement between the two indices of measurement. The distribution of the difference between the two indices of measurement was non-parametric and hence, the median and interquartile range are reported. The median (interquartile range) difference between SVV and PVI was -2% (-4 to -1%) and the range was very wide (-18% to 9%).
Correlation between SVV and PVI.
Comparison of all SVV and PVI measurements using Bland-Altman plot at every time point.
The interclass correlation is said to be poor if <0.4, fair, if 0.4-0.6, good if 0.6-0.7 and excellent if >0.7. The correlation between SVV and PVI by the two methods was good/excellent at 29 of the 52 time points whereas it was poor/fair at 23 time points.
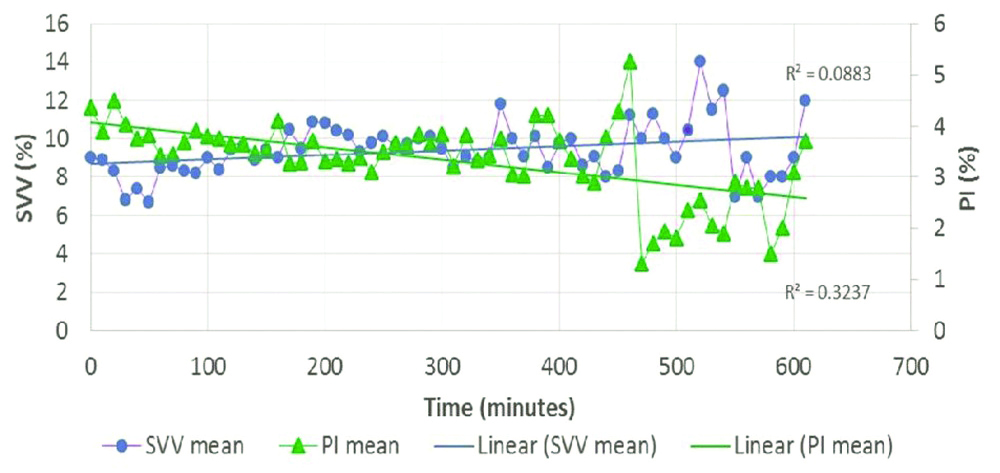
[Table/Fig-7] shows mean PVI and PI at different time points. The PI was >0.5 in 95% of all individual readings (490 of 516 readings). The PI was 0.4 at 16 time points, 0.3 and 0.2 at 4 time points each and 0.1 at only 2 time points. The graph illustrates that the PVI increases when the PI decreases. [Table/Fig-8] shows mean SVV and PI at different time points. SVV increased with decrease in PI but to a much lesser extent as compared to PVI.
Comparison of mean PVI (%) and mean PI (%) with respect to time.
Comparison of mean SVV (%) and mean PI (%) with respect to time.
Discussion
Assessment of the adequacy of the intravascular volume is of prime importance to avoid hypovolemia and tissue hypoperfusion [1]. Most of the dynamic variables assessing fluid responsiveness are invasive, technically challenging or require additional catheters. Several studies demonstrated the value of FloTrac-derived SVV in predicting fluid responsiveness in various clinical settings [8-10]. Many studies have shown that such an approach is associated with better intraoperative haemodynamic stability, decrease in serum lactate at the end of surgery, reduced length of hospital stay, ICU admission and costs, faster return of bowel movement and fewer complications [11-13].
PVI is a relatively new dynamic indicator of fluid responsiveness. The readings are automatic and continuous and thus, similar to other dynamic indices but is non-invasive [14-16]. A few studies have shown that PVI helped clinicians to improve fluid management during surgery and in ICU in contrast to standard care [17-19]. Cannesson M et al., confirmed that PVI can predict the cardiocirculatory response to volume loading in a haemodynamically stable setting of preoperative cardiac surgery [17].
Most studies in literature have measured stroke volume index before and after fluid bolus and classified people into responders and non-responders [15,16,20]. Based on their studies, the threshold values for SVV and PVI have been derived and reported. Also, most of them have administered boluses of fluid and measured responses. There is no study regarding their use as a continuous monitor of fluid requirement. Our study differs from other studies in that the displayed value was monitored continuously and fluid boluses were given if the displayed value exceeded the threshold value. The displayed values by both equipment (SVV and PVI) from beginning to end of surgery at different time points were compared for concurrence. The change in the displayed values after fluid bolus was noted.
In our study, only major open abdominal surgeries such as Whipple’s procedure, abdominoperineal resection, hemicolectomy etc., were included because large fluid shifts are expected in these procedures. Replacing an invasive method of measurement of fluid requirement with a non-invasive method is very attractive. We studied 516 pairs of simultaneous measurement of SVV and PVI. The average duration of surgery was around six hours. Both SVV and PVI were measured every 10 minutes from beginning to end of surgery in all patients. Measurement and recording of haemodynamic data such as blood pressure and heart rate every five minutes is commonly accepted. Any response to that in terms of fluid therapy would require at least another five minutes and hence we chose ten minutes as the recording interval of these indices. Fluid therapy was based on the clinical judgement as well as SVV and not the PVI as the SVV is considered an established monitor.
The readings of PVI were seen to be higher than SVV at every time point but the relationship was erratic. Many factors have been found to influence PVI measurements, important being the vascular reactivity (as indicated by PI) which affects the pulsatile absorption component [21]. Broch O et al., demonstrated that PVI was affected by many factors related to PI, and the accuracy with which PVI predicted fluid responsiveness was reduced at lower PI values [22]. The Masimo pulse oximeter can display PI through a large range, from 0.02 to 20%. With a PI more than 0.5, the readings of PVI are said to be accurate. In our study, though the PI values were within the normal range, as PI decreased, PVI increased [Table/Fig-7].
As PVI is a measure of the dynamic changes in PI, patients should be studied under steady clinical conditions to avoid changes in vascular tone. Thus pain, body temperature, spontaneous breathing activity, site of measurement, signal obtained, and vasoconstriction due to any cause, limit the clinical relevance of the presented results [23-25]. All our patients received epidural analgesia. Fall in body temperature occurs in spite of the use of perioperative active warming systems. Hypothermia is common in prolonged open abdominal procedures in spite of active attempts to keep them warm. The changes in vascular tone are common under anaesthesia especially during prolonged major surgery such as Whipple’s procedure, anterior perineal resection, hemicolectomy etc. Biais M et al., state that norepinephrine, by increasing the peripheral vascular tone, may reduce the pulsatile component of plethysmographic wave and therefore the accuracy of PVI [25]. None of our patients required noradrenaline perioperatively.
Studies have demonstrated that ear and forehead (cephalic sites), which are less sensitive to increased vasomotor tone, could be more suitable in critically ill and/or high-risk surgical patients. For the same reason, different studies have demonstrated a high variability of the best threshold ranging from 8 to 20% for interpretation of PVI as an indicator of fluid requirement [26-28]. The finger probe was used in the present study.
The site of measurement was the hand which is usually tucked under the sheets during major surgical procedure. Nociception, hypovolaemia and hypothermia also would have contributed to changes in vascular tone. However, these patients who undergo major open abdominal surgery will probably benefit most if a reliable non-invasive method of fluid requirement is made available. The Masimo pulse oximeter is designed to work well even in low perfusion states but our study did not demonstrate its reliability, when used in this group of patients as a monitoring tool for fluid requirement.
ROC analysis in the different studies showed largely a good prediction of fluid responsiveness, and SVV threshold values ranged from 10% to 13% [29]. A meta-analysis which included 22 studies and 807 patients reported a pooled sensitivity for predicting fluid responsiveness of 88% with a specificity of 89%. The median threshold of the PPV was 12% (interquartile range 10-13%) [30].
The results of the present study shows that both arterial pressure-based SVV by the FloTrac/Vigileo system or non-invasively assessed PVI using Masimo plethysmographic waveform analysis have the potential to serve as valid indicators to predict fluid responsiveness in patients undergoing major abdominal surgery. The current study showed poor correlation between SVV and PVI measurements, thus ruling out the possibility of PVI replacing SVV. If accuracy of PVI could be improved, it can be a very useful perioperative monitor and provide a more objective and yet, non-invasive method of managing fluid therapy.
The strength of our study was that the two modalities of measurement were used simultaneously in each patient and at many points of time. They were also used for monitoring during surgeries with major fluid shifts where they would be of maximum relevance and benefit.
Limitation
Limitations of the study included inability to avoid mild hypothermia despite active warming measures. The Masimo pulse oximeter available to us was Radical 7 model and the finger probe was used.
Future studies can evaluate whether the next model Masimo Radical 8 performs better in this situation. Also, a pulse oximeter probe that can be placed more proximally such as on the forehead may be evaluated for better concurrence with SVV.
Conclusion
PVI overestimates and is frequently unreliable as an indicator of fluid responsiveness compared to SVV. Therefore, it cannot be substituted for SVV in patients undergoing major open abdominal surgery.