H-reflex (Hoffmann reflex) is equivalent to stretch reflex, elicited by electrical stimulus which stimulates Group Ia afferent from the primary endings of muscle spindle, forming the afferent pathway for H-reflex. The Ia afferent form monosynaptic excitatory connection with motor neurons which forms the efferent pathway. The central amplification of motor response plays a vital role in H-relfex recording due to reflex activation of motor neurons [1].
H-reflex is a valuable electrophysiology test used clinically for assessing spinal reflex integrity along the entire length of afferent and efferent pathways. Prolongation of H-reflex latency and amplitude asymmetry are the earlier sign of radiculopathy [2,3]. It can detect not only radiculopathies but also proximal segment nerve lesion like Guillain-Barré syndrome that might be missed during routine peripheral nerve conduction studies [4].
However, studies have shown that physiological factors like age, height, temperature and BMI influence the recording of lower limb H-reflex latency and amplitude [5-7]. There are hardly studies done to determine the effect of arm length and BMI on upper limb H-reflex [8-12]. Hence, the present study was done to determine the impact of arm length and BMI on H-reflex among healthy females. Our hypothesis was: Increase in arm length, increases the H-reflex latency and decreases H-reflex amplitude. Increase in BMI prolongs the H-reflex latency and decreases H-reflex amplitude.
Materials and Methods
The present cross-sectional study was conducted at the electrophysiology laboratory from February 2013 to February 2014 in Department of Physiology, at Pondicherry Institute of Medical Sciences, Puducherry, India after obtaining institutional ethical clearance (IEC:RC/13/02). Based on previous article [13], the sample size was calculated:
n=Z21-α/2σ2/∈2μ2
Mean=0.74; SD=0.17
Relative precision (%)=7
Confidence level (%)=95
Hence, required sample size=41. But we rounded sample size to 50.
The study participant included 50 female volunteers between age group of 20 to 30 years in their early follicular phase of menstrual cycle (to avoid the influence of hormones). Participants with the history of neurological abnormalities, limb deformities, hypertension, diabetes mellitus, thyroid dysfunction and oral contraceptive pills intake were excluded from the study.
The participants who volunteered for the study were asked to report to electrophysiology laboratory during their early follicular phase. Informed consent was obtained after explaining the procedure to the participants.
BMI was calculated for the participants as per formula: Weight (Kilograms)/Height (meter2) (Quetelet Index) [14,15]. Based on the revised consensus guidelines for India, the participants were categorized as underweight (<18.5 kg/m2), normal or lean BMI (18.5-22.9 kg/m2), overweight (23.0-24.9 kg/m2) and obese (≥25 kg/m2) [16,17].
Arm length was measured using inch tape in the dominant hand of the participant from the centre of the seventh cervical spinous process to the tip of the ulnar styloid process while the arm was abducted approximately 20° [18].
Procedure
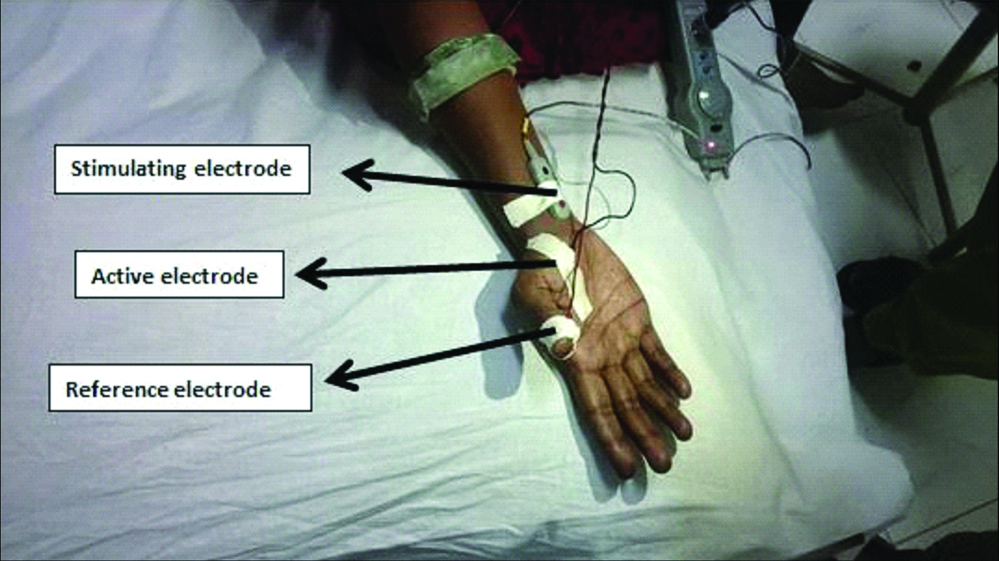
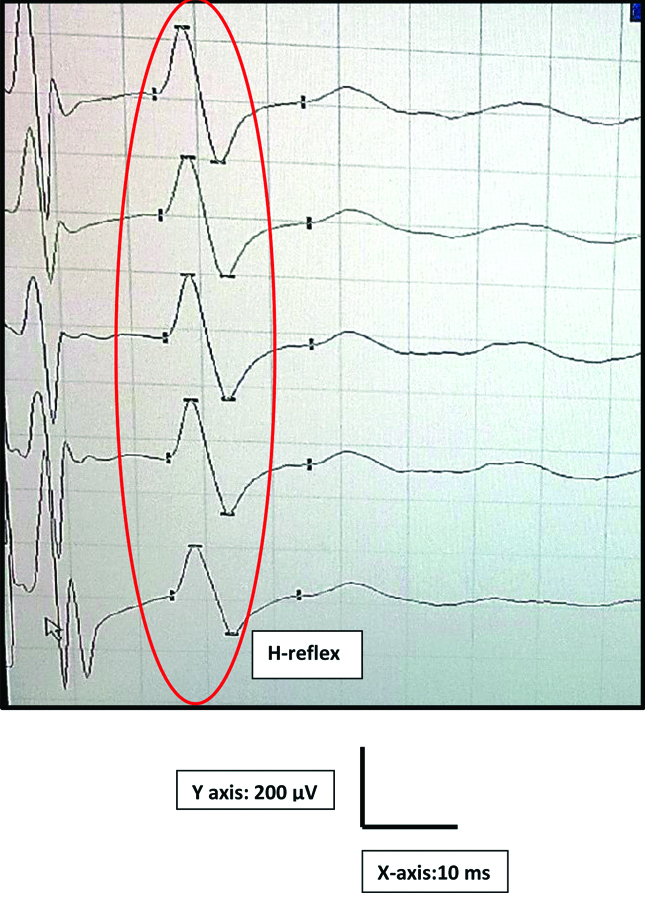
During early follicular phase, the participants were tested in the electrophysiology lab at 22±3°C. With participant in supine posture, the palm was cleaned with spirit to reduce the impedance. In the extended position of the participant dominant hand, the active electrode was placed on APB muscle belly. The reference electrode and the ground electrode were fixed on the thumb and below the elbow respectively [Table/Fig-1]. The participant was asked to abduct the thumb while stimulating the median nerve near the wrist with the intensity of two to five milliampere (mA) for a duration of one ms. The H-reflex was recorded using a digitalized nerve conduction/EMG/EP machine [19,20] (Aleron, Recorders Medicare systems, Chandigarh, India) as shown in [Table/Fig-2].
Electrode placement for H-reflex recording.
A typical APB H-reflex recording in RMS machine.
Statistical Analysis
The arm length, BMI, latency and amplitude of APB H-reflex were tabulated and analysed using SPSS version 20.0. The correlation between arm length with H-reflex latency and amplitude was done by Pearson correlation (r). The median (Inter-quartile range-IQR) value of BMI was determined by Kruskal Wallis test. The correlation between H-reflex latency and amplitude with BMI was determined by Spearman’s correlation.
Results
The mean±SD, median and interquartile range for the arm length was calculated as shown in [Table/Fig-3]. The mean±SD, median and interquartile range for the APB H-reflex latency and amplitude based on BMI was calculated as shown in [Table/Fig-4,5] respectively. The correlation between APB H-reflex latency and amplitude with arm length is given in [Table/Fig-6,7 and 8]. The correlation between APB H-reflex latency and amplitude with BMI is shown in [Table/Fig-9].
Representing mean, standard deviation, median and interquartile range of arm length.
| Parameter | Mean | SD | Median | Interquartile range |
|---|
| 25th Percentile | 75th percentile |
|---|
| Arm length (Centimeters, cm) | 69.28 | 3.30 | 70 | 68 | 71.25 |
Representing mean, median and interquartile range of APB H-reflex latency based on BMI.
| Body Mass Index (BMI) category (Kg/m2) | Mean | SD | Median | Interquartile range |
|---|
| 25th Percentile | 75th percentile |
|---|
| Underweight (<18.50) | 26.3 | 2.3 | 26.10 | 24 | - |
| Normal (18.50-22.9) | 26 | 1.90 | 25.80 | 24 | 27 |
| Overweight (23-24.9) | 25.78 | 1.89 | 25.95 | 25 | 27.75 |
| Obese (≥25) | 25.80 | 1.15 | 25.35 | 24.75 | 27 |
Representing mean, median and interquartile range of APB H-reflex amplitude based on BMI.
| Body Mass Index (BMI) category (Kg/m2) | Mean | SD | Median | Interquartile range |
|---|
| 25th Percentile | 75th percentile |
|---|
| Underweight (<18.50) | 880 | 230.65 | 960 | 620 | - |
| Normal (18.50-22.9) | 929.3 | 360.09 | 920 | 741.50 | 1047.50 |
| Overweight (23-24.9) | 1038.9 | 432.65 | 975 | 706.75 | 1268.75 |
| Obese (≥25) | 958 | 500.43 | 500 | 647.75 | 1164.75 |
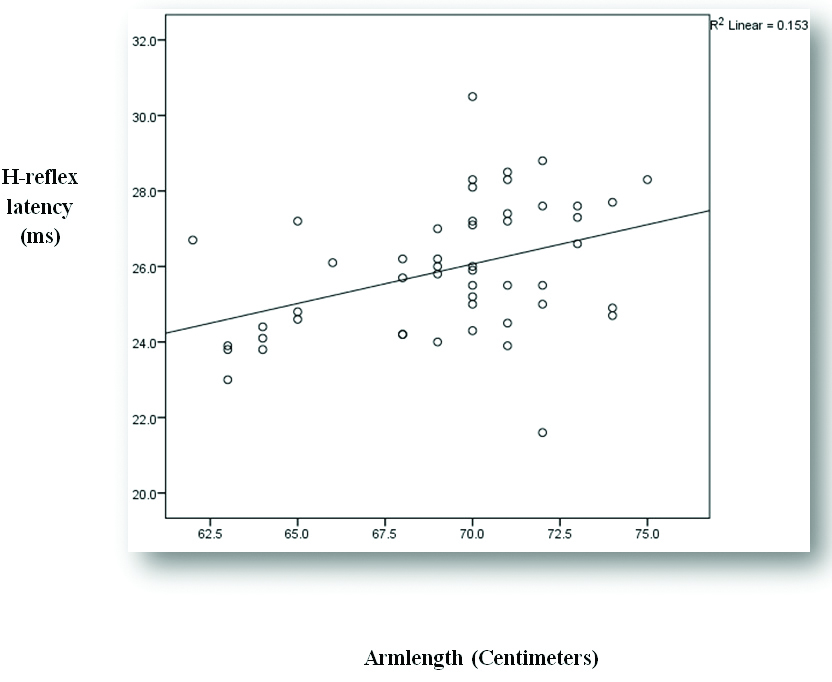
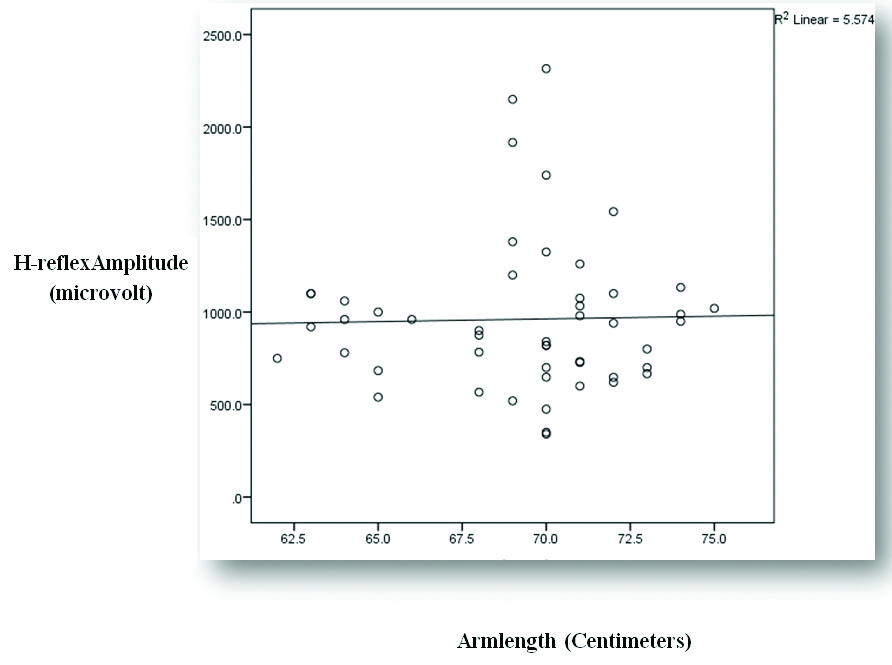
Representing correlation of arm length and abductor pollicis brevis H-reflex latency and amplitude.
| Parameter | Statistical analysis | Abductor Pollicis Brevis H-reflex |
|---|
| Latency | Amplitude |
|---|
| Arm length (Centimeters, cm) | ‘r’ value | 0.391 | 0.024 |
| p-value | 0.005 | 0.871 |
| Significance | Significant | Not significant |
‘r’-Karl Pearson correlation Co-efficient
Representing correlation between arm length and APB H-reflex latency.
Representing correlation between arm length and APB H-reflex amplitude.
Representing correlation of abductor pollicis brevis H-reflex latency and amplitude with BMI.
| Parameter | Statistical analysis | Abductor PollicisBrevis H-reflex |
|---|
| Latency | Amplitude |
|---|
| Body mass index (kg/m2) | ‘r’ value | -0.03 | -0.007 |
| ‘p’ value | 0.79 | 0.96 |
| Significance | Not significant | Not significant |
‘r’-Spearman’s correlation Co-efficient
Discussion
The protocol followed in this study produced reliable H-reflex from APB. The H-reflex showed characteristics similar to those of a classic soleus H-reflex [21].
APB H-reflex latency and amplitude increases with increase in arm length. As BMI increases, APB H-reflex latency and amplitude decreases. Hence, our hypothesis was declined. The impact of arm length on H-reflex latency and amplitude found in our study are consistent with finding of several other studies [8,9,12]. H-reflex usually measures the synaptic transmission from Ia afferent to alpha motor efferent fibers. Hence, the pathway for H-reflex increases as the arm length increases which increases the time taken for excitation of motor neuron.
Study done by Ghavanini MR et al., showed the leg length strongly correlated with H-reflex latency. Similarly, study done by Frank JE et al., found that leg length had positive correlation with H-reflex latency [22,23].
As BMI increases, latency decreases in the present study. However, the correlation is not significant. Adipose tissue in epineurium affects the nerve conduction velocity. Hence, as BMI increases latency increases [24]. Study done by Buschbacher RM et al., concluded that BMI was not correlated with nerve conduction velocity among different BMI group [25,26].
H-reflex has a long anatomical pathway which is influenced by various physiological and technical factors. Among these factors limb length has a significant influence on its latency. Due to the pathway of H-reflex loop, the correlation between either leg length and lower limb H-reflex latency or arm length and upper limb H-reflex latency are expectable [27,28]. Study done to determine the effect of height on leg length showed that the conduction velocity in the leg is inversely proportional to the height of an individual. Height had a greater influence on NCS of the legs but not for the arms, since wide range of arm length was not studied [5,7,29,30].
From this study, it was observed that APB H-reflex latency and amplitude was altered by both arm length and BMI. However, only the impact of arm length on APB H-reflex latency was statistically significant. Hence, clinically while interpreting APB H-reflex among females these two biological factors must be taken into consideration for precise diagnosis.
Limitation
The sample size was too small to show strong correlation of arm length and BMI with APB H-reflex latency and amplitude. Follicular Stimulating Hormone (FSH) and Luteinizing hormone (LH) hormone assay could have been done to show no hormonal effects during the APB H-reflex recording.
Conclusion
With increasing arm length APB H-reflex latency increases, amplitude also increases but not significantly. As BMI increases, APB H-reflex latency decreases and amplitude increases. These correlations were not significant. Hence, arm length and BMI should be taken into account while interpreting APB H-reflex among females.
‘r’-Karl Pearson correlation Co-efficient
‘r’-Spearman’s correlation Co-efficient