Intensive care units (ICUs) are designated areas in a hospital facility for the management of critically ill patients. Due to the severe nature of illnesses, patients in the ICU are at an increased risk of nosocomial infections [1]. These rates are usually greater than non-ICU wards due to the use of invasive medical devices and patients presenting with a range of severe comorbidities [2,3]. Studies have also shown that the rates of nosocomial infections in developing countries pose a greater threat than those of industrialised countries [4,5]. Ventilator-associated pneumonia (VAP) is defined as “pneumonia that occurs 48-72 hours or thereafter following endotracheal intubation, characterised by the presence of a new or progressive infiltrate, signs of systemic infection (fever, altered white blood cell count), changes in sputum characteristics, and detection of a causative agent” [6]. VAP contributes to approximately half of all cases of hospital-acquired pneumonia and it is estimated to occur in 9%-27% of all mechanically ventilated patients, with the highest risk being early in the course of hospitalisation [1,6-8]. High rates of nosocomial infections can be implicated in poor Indoor Air Quality (IAQ) which may result in detrimental effects on both patients and healthcare workers.
Mechanically ventilated patients may present a higher risk due to the generation of aerosols which may contribute to the spread of nosocomial infections. HME filter devices are commonly used in the ventilator circuit to humidify and warm the air and filter particles. These properties of the upper respiratory tract are lost during the process of mechanical ventilation. Thus the present study aimed to assess the utility of an HME filter at the outlet of a ventilator while correlating TVC in the ICU environment.
Materials and Methods
A descriptive cross-sectional study was started in September 2017 and was performed in two phases lasting six-months each. The study was done to evaluate a medical ICU in a Tertiary Care Hospital with approval from the Ethical Committee of Bharati Vidyapeeth Deemed University Medical College, Pune, Maharashtra, India (Letter no. BVDUMC/IEC/8A). In addition, approval was also granted from the Hospital’s Medical Director and the Head of Department of the ICU. The air from the ICU was sampled with both active and passive sampling methods simultaneously. Samples were collected twice daily consistently at low traffic hours (0700 hours and 1900 hours). In addition, the number of personnel present was restricted to the skeletal staff in order to limit variability in samples. A total of 120 microbiological air samples were surveyed utilising the active and passive sampling techniques for both ventilators and the ICU environment.
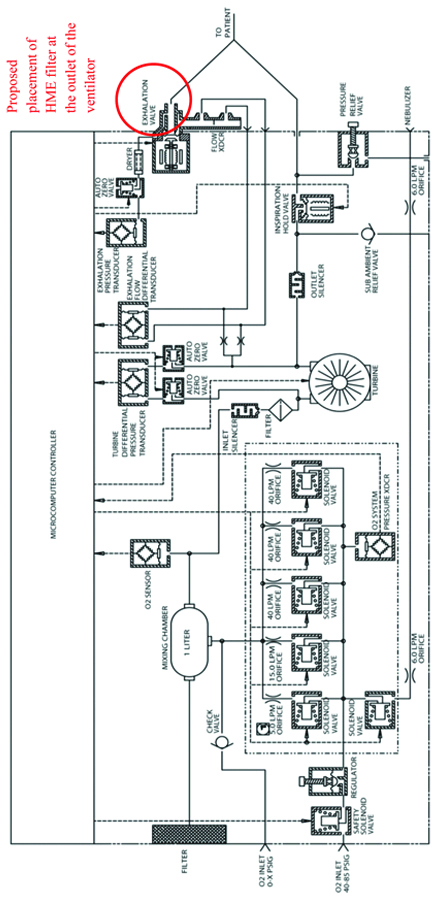
The study was conducted in two phases. In Phase I, an active and passive sampling of the ICU environment and the ventilators were conducted without the use of a filter. This consisted of taking 30 active samples (15 samples were collected from the ICU environment and 15 samples were collected from the ventilator) and 30 passive samples (15 samples were taken from the ICU environment and 15 samples were taken from the ventilators). Phase II was subsequently conducted after placing filters in the outlet of the ventilators while sampling methods and locations remained the same. The filters used in Phase II of the study were the “Thermoshield bacterial and viral breathing system filter+HME” manufactured by Flexicare. These filters were placed in the outlet port of the ventilator of each new admission who required mechanical ventilation in the ICU. The ventilators being used in the ICU are the Fusion T-Bird series of ventilators, manufactured by VELA Care [9]. As shown in [Table/Fig-1], the exhaust port does not indicate the presence of an outlet filter.
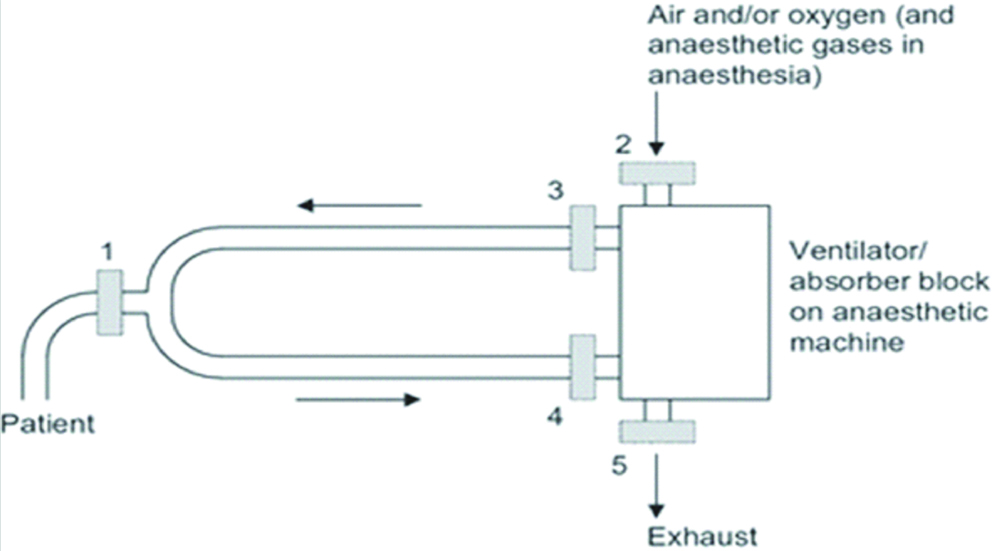
A schematic outlining the Pneumatic system of the VELA ventilators [9].
Passive monitoring was performed by the Sedimentation method to determine the Index of Microbial Air Contamination (IMA). This index corresponds to the number of CFU counted on a Petridish containing Tryptic Soy Agar (TSA) agar with a diameter of 9 cm. The plates were placed according to the 1/1/1 scheme: 1 metre above the floor, about 1 metre away from the walls or any major obstacles for one hour [10]. Settle plates were exposed to the air for a given time in order to collect biological particles which “sediment” out. Results were calculated using Omeliansky’s formula:
N=5a*104 (bt)−1where N is microbial Colony Forming Units (CFU)/m3 of indoor air, “a” is a number of colonies per Petri dish, “b” is dish surface in cm2, “t” is exposure time in minutes. The results will be expressed in CFU/plate/time (CFU/dm2/hour) [11].
In active monitoring, Surface Air Sampling (SAS) was carried out by the HiMedia Hi Airflow Model LA881 air sampler using TSA plates. The microbiological air sampler differs from passive sampling by physically drawing a known volume of air through or over a particle collection device, which can be a liquid or a solid culture media or a nitrocellulose membrane. The quantity of microorganisms present was measured in CFU/m3 of air. This system is applicable when the concentration of microorganisms is not very high, such as in an operating theatre and other controlled environments in the hospital. The sampling was conducted at a flow rate of 180 Litres/minute and for a total period of one hour. Five separate air draws of 100 Litres each, for a total volume of 500 Litres, at 12-minute intervals between draws. When sampling the ICU environment, the air sampler was kept at a distance of 1 metre away from the ground [12] and the sampling locations remained constant during both phases. When SAS samples were collected from the ventilator, the air sampler was kept at a height of 150 cm with the sieve impactor of the air sampler facing the outlet of the ventilator. This position was kept consistent during both phases of the study. The inlet of the air sampler was cleaned with 70% spirit before the start of sampling. SAS samples were used to calculate the TVC by using the formula;
B=1000N/RTwhere N is the number of colonies counted on the sample plate, “T” is the duration of the test in minutes, “R” is the air sampling rate in Litres/minute. The results will be expressed as CFU/m3 [13]. Passive and active culture plates were placed in an incubator inversely at 30-35°C for 48 hours. The colonies were counted using the APD Colony Counter Mobile Application [14] and the CFU/m3 were calculated. The colonies were segregated based on colony phenotype and were inoculated onto sterile nutrient agar plates after being gram stained. A new set of slides were made from the culture samples of the nutrient agar plates and are matched with the original gram stained slides to confirm bacterial morphology. The samples were then subsequently processed by the VITEK® 2 microbial ID/AST testing system in order to determine species identification.
Statistical Analysis
Statistical analysis was done using SPSS version 20.0. A two-sample t-test assuming equal variance was performed to compare Phase I vs. Phase II for active and passive samples respectively. This data was used to analyse the bacterial contamination in the air with and without the presence of an outlet filter [15]. From the results of the t-test, a p-value <0.001 was regarded as significant in the statistical analysis [13,16].
Results
During a one year period, 120 air samples were collected in the ICU. Detailed findings of quantitative microbial air contamination are shown in [Table/Fig-2,3]. These findings are divided into the two phases of the study, with the active and passive samples collected from the ventilator of the patient as well as from the ICU environment in Phase I. The two locations and methods of sampling were consistent in Phase II of the study once installing the Thermoshield HME filters at the outlet of the ventilators.
Total Viable Count TVC (CFU/dm2/hr) determined by Passive sampling (IMA).
| N* | Total Viable Count TVC (CFU/dm2/hr) |
|---|
| Mean (SD) | Min | Max |
|---|
| Passive Ventilator-Phase I | 107.7 | 1547.41 (331.614) | 1077.58 | 2097.70 |
| Passive Ventilator-Phase II | 53.00 | 761.49 (270.908) | 229.89 | 1192.53 |
| Passive ICU Environment-Phase I | 106.50 | 1530.18 (556.853) | 689.66 | 2500.00 |
| Passive ICU Environment-Phase II | 16.43 | 236.11 (104.680) | 86.21 | 431.03 |
*Number of colonies counted on the sample plate
Total Viable Count TVC (CFU/m3) determined by Active sampling (SAS).
| N* | Total Viable Count TVC (CFU/m3) |
|---|
| Mean (SD) | Min | Max |
|---|
| Active Ventilator-Phase I | 530.90 | 88.48 (15.438) | 62.00 | 114.66 |
| Active Ventilator-Phase II | 291.13 | 51.71 (13.479) | 25.00 | 68.67 |
| Active ICU Environment-Phase I | 400.13 | 66.69 (9.048) | 50.67 | 82.50 |
| Active ICU Environment-Phase II | 161.47 | 26.91 (5.348) | 16.83 | 34.50 |
*Number of colonies counted on the sample plate
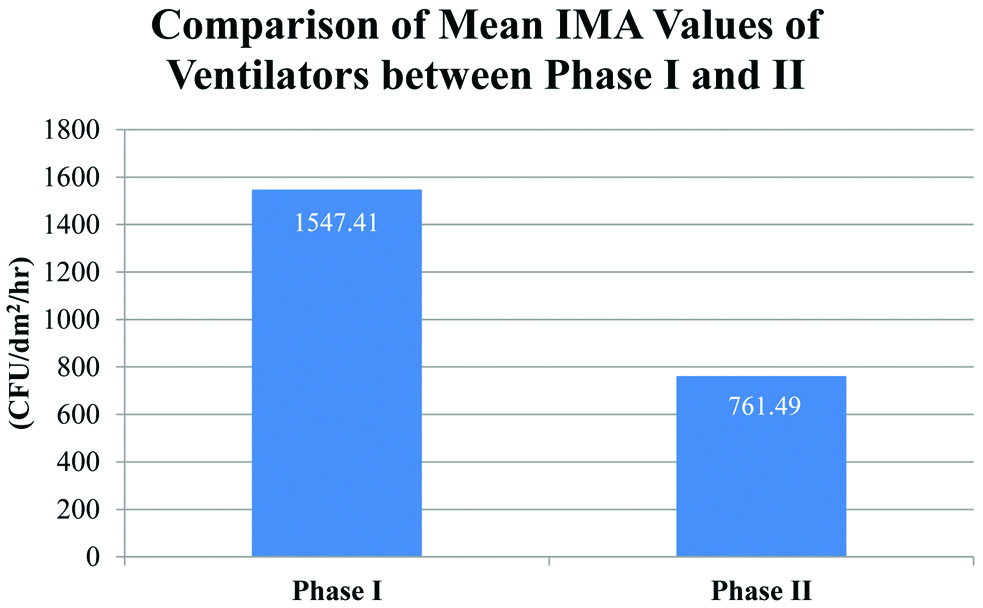
There was a statistically significant decrease in the mean values for TVC in both passive and active sampling techniques when comparing Phase II with Phase I [Table/Fig-4,5,6 and 7]. Similarly, a significant decrease of the bacteria containing particles was also seen in the environmental samples. The mean TVC of the ICU environment in this study after the addition of outlet filters of the ICU ventilators was 236.11 CFU/dm2/hour as demonstrated by [Table/Fig-2].
Passive sampling: Two-sample t-test assuming equal variance to compare the ventilator samples of Phase I against Phase II.
| Passive Sampling: t-Test -Two-Sample Assuming Equal Variances |
|---|
| Variances | Without filter | With filter |
|---|
| Mean | 107.7 | 53 |
| Variance | 532.7 | 355.52 |
| Observations | 30 | 30 |
| Pooled Variance | 444.11 | |
| df | 58 | |
| t Stat | 10.05 | |
| P (T<=t) one-tail | 1.27627E-14 | |
| t Critical one-tail | 1.671552762 | |
Active sampling: Two-sample t-test assuming equal variance to compare the ventilator samples of Phase I against Phase II.
| Active Sampling: t-Test-Two-Sample Assuming Equal Variances |
|---|
| Variances | Without filter | With filter |
|---|
| Mean | 530.9 | 291.13 |
| Variance | 8579.06 | 6540.33 |
| Observations | 30 | 30 |
| Pooled Variance | 7559.69 | |
| df | 58 | |
| t Stat | 10.68 | |
| P(T<=t) one-tail | 1.2796E-15 | |
| t Critical one-tail | 1.671552762 | |
Comparison of Mean Index of Microbial Air Contamination Values of Ventilators between the two phases.
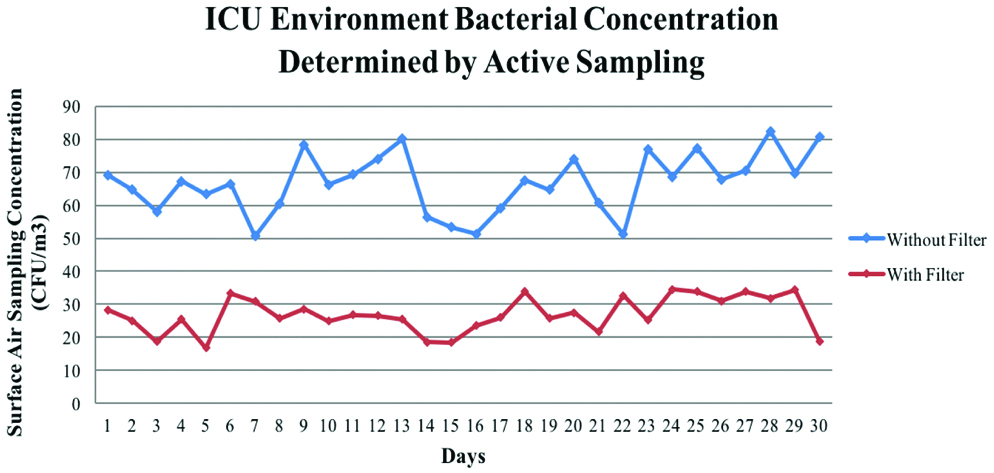
Comparison of Mean Surface Air Sampling Values of Ventilators between the two phases.
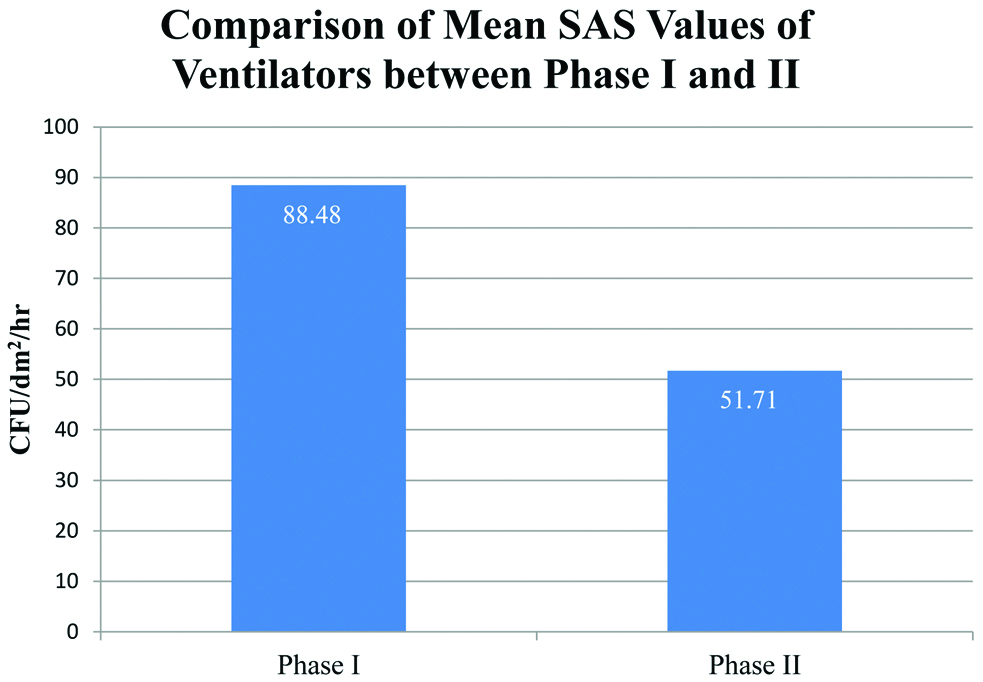
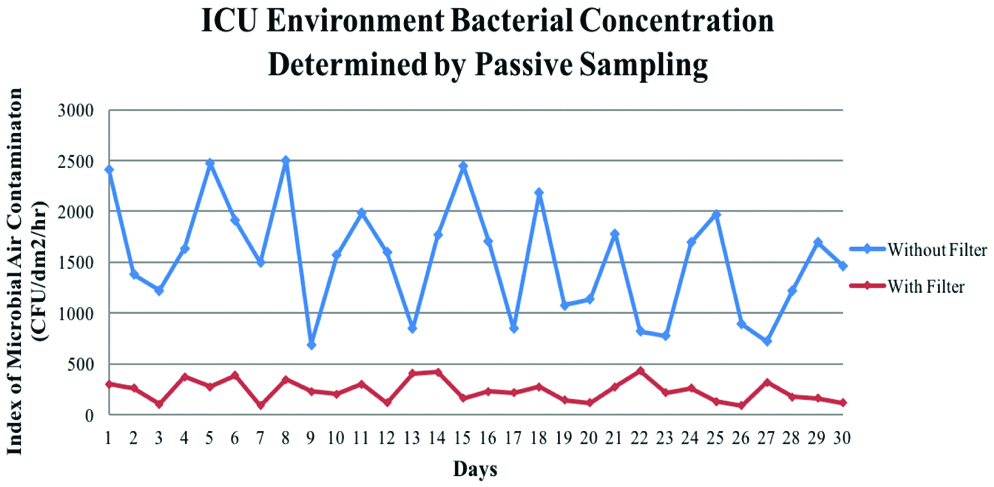
A correlation was found between Phases I and II sets of IMA and SAS values of the ventilator and the ICU environment. Phase II IMA environment samples were found to be significantly lower than phase I samples as shown in [Table/Fig-8,9]. It also shows the pattern of air contamination collected through the course of the study. Hence, the use of an outlet filter can provide substantial diminution of TVC as demonstrated by these results.
IMA values of the ICU Environment Phase I against Phase II (CFU/Day).
SAS values of the ICU Environment Phase I against Phase II (CFU/Day).
Discussion
The possible filter locations are outlined according to a study by Wilkes A et al., in [Table/Fig-10]. Similar studies have concluded that the additional HME filters in locations 4 and 5 indicate the reduction of patient infection rates [17]. This was in addition to the default filter at Position 1 as per hospital policy.
Possible placements of HME filters in the ventilator circuit 1at patient connection port; 2on the air inlet port; 3on the inspiratory port; 4on the expiratory port; 5on the exhaust port
The present study aimed to correlate the use of an HME filter for the outlet of the ventilator at Position 5 [17] and the resulting air quality of the ICU environment by assessing the TVC. The previous studies stated that the small pleated membrane similar to the one found in HME filters are highly effective in reducing liquid-borne contamination and low air resistance in wet conditions [18-20]. The importance of ventilator filters was highlighted in a study by Heuer JF et al., which tested the use of filters to prevent the spread of the H1N1 virus into the breathing circuit and the ambient air. During the course of the study, it was concluded that outlet filters significantly reduced the viral load in the breathing system air and in the ambient air [21].
Similarly, Ari A et al., concluded that the presence of drugs in exhaled aerosols during mechanical ventilation resulted in an increased risk of exposure to ICU personnel. It was reported that the use of filters significantly reduces the amount of aerosol exposure from the outlet of ventilators to ICU personnel [22]. Additionally, the cost of dealing with VAP is not only tremendous for the patients but also results in the development of resistance and degrades the efficacy of treatment [23,24].
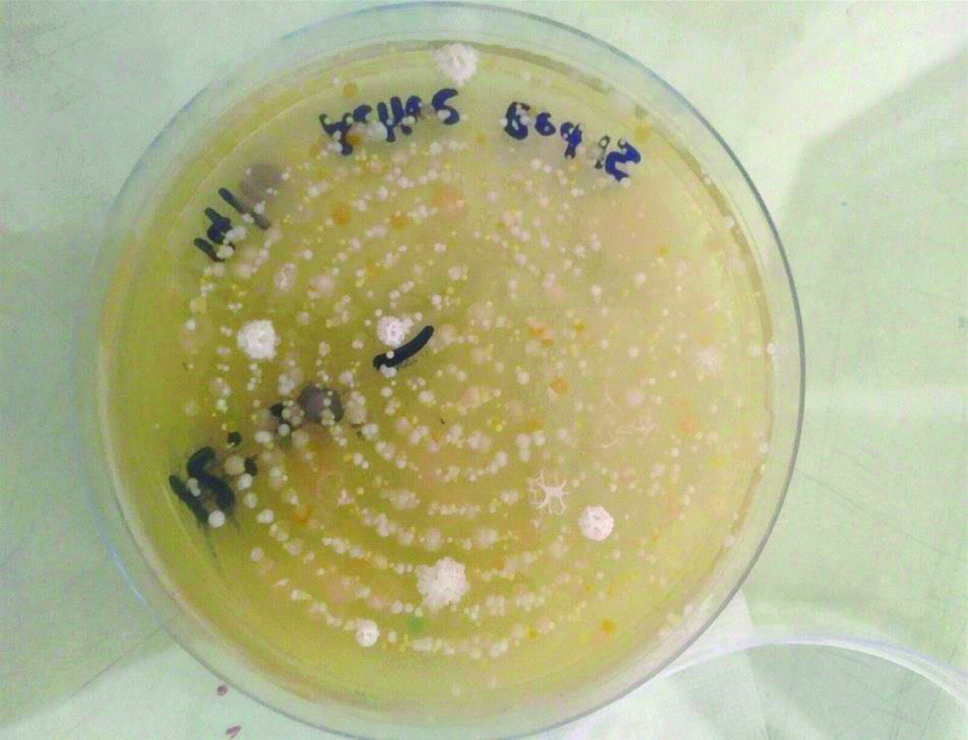
Throughout the course of the study, the indoor contamination was assessed both quantitatively and qualitatively. The latter was carried out by the isolation and identification of 19 different bacterial pathogens, characterised below as per their morphological characteristics. When the samples were identified during the course of the study, isolates such as Pseudomonas stutzeri, Moraxella group, Acinetobacterbaumannii have been implicated in severe nosocomial infections [Table/Fig-11,12,13,14 and 15].
Morphological classification of isolated organisms.
| Gram-positive cocci |
| Staphylococcus haemolyticus |
| Micrococcus luteus |
| Staphylococcus lentus |
| Granulicatella adiacens |
| Staphylococcus gallinarum |
| Staphylococcus hominis spp. |
| Staphylococcus cohnii spp. |
| Gram-negative bacilli |
| Acinetobacter baumannii |
| Pseudomonas stutzeri |
| Serratia plymuthica |
| Sphingomonas pacimobilis |
| Moraxella group |
| Gram-positive bacilli |
| Alicyclobacillus acidoterrestris |
| Alicyclobacillus acidocaldarius |
| Bacillus subtilis |
| Bacillus amyloliquefaciens |
| Bacillus atrophaeus |
| Brevibacillus laterosporus |
| Bacillus pumilus |
Active sampling culture plate of ventilator 12.
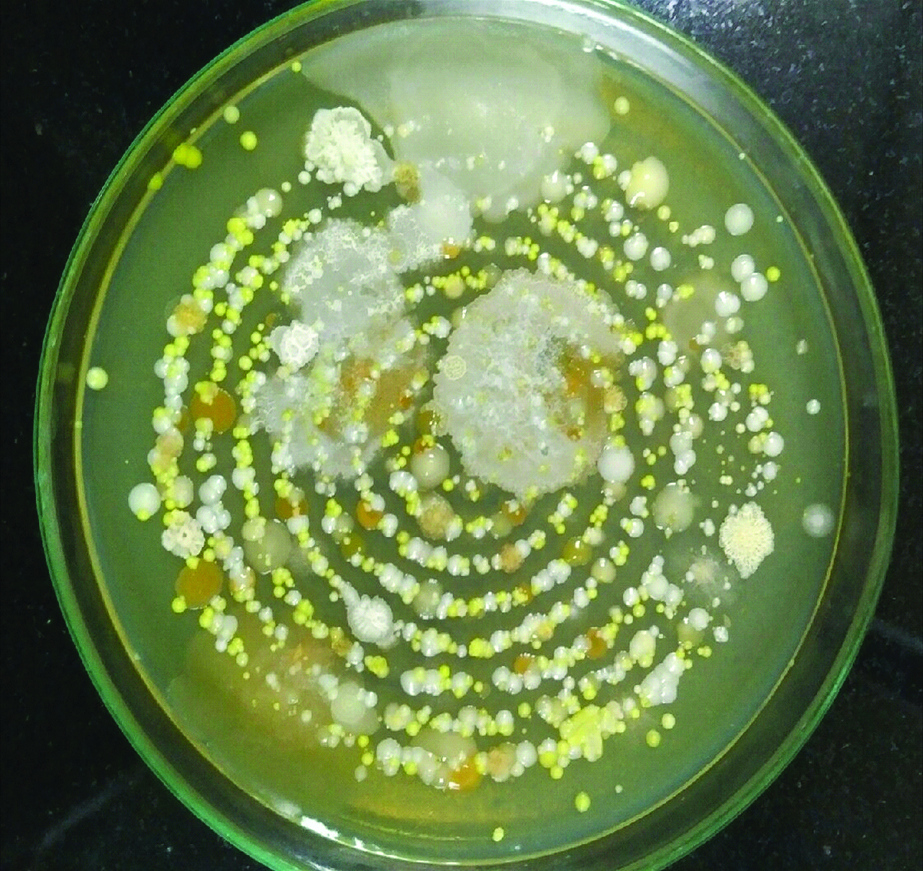
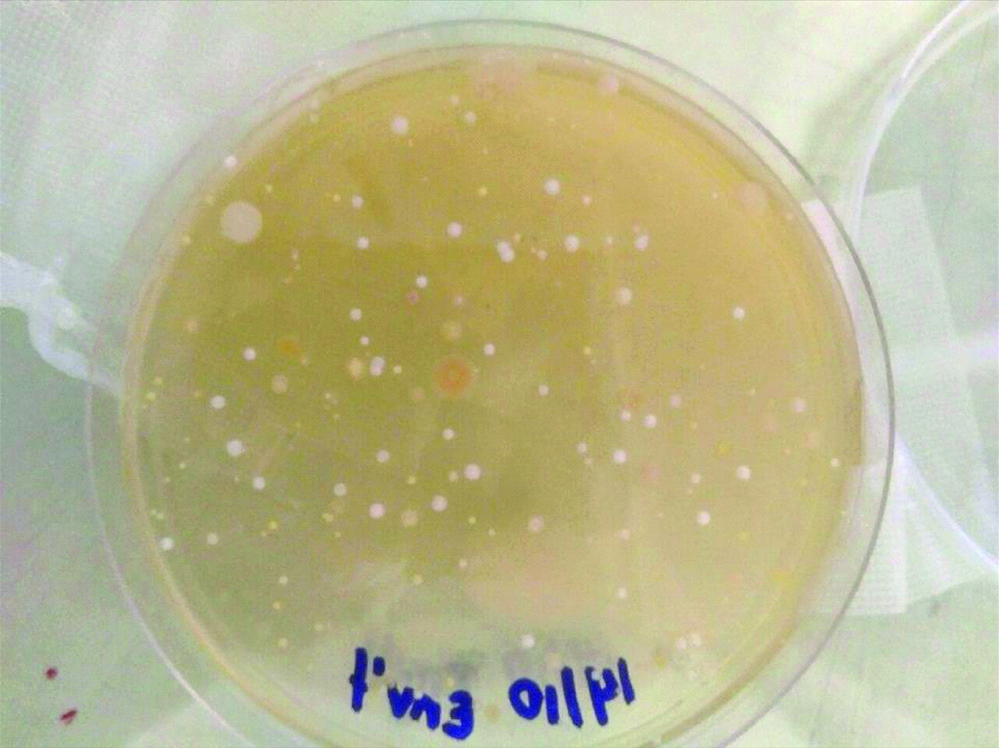
Passive sampling culture plate of environment during phase I.
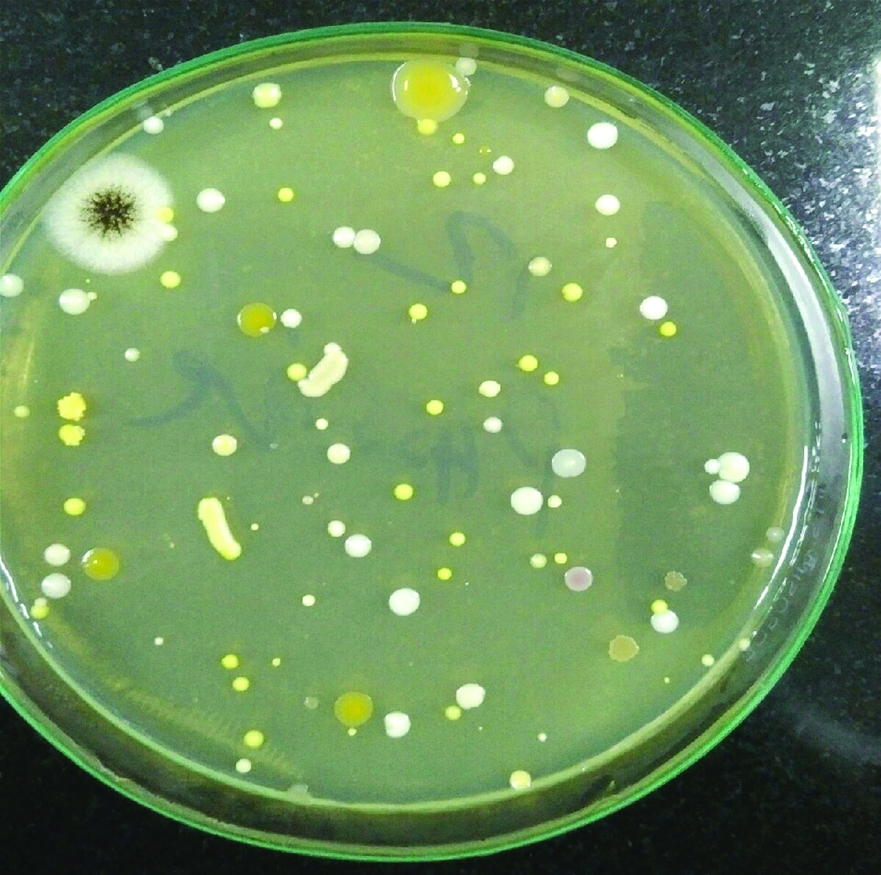
Active sampling culture plate of environment during Phase II.
Passive sampling of the environment during phase II.
Pseudomonas stutzeri has an extremely high mortality rate in immune compromised patients; a similar patient population is found in the ICU. It is responsible for diffuse pneumonia, septic shock, skin and soft tissue infections [25] as well as VAP, which have been isolated as the cause in multiple studies [26].
Additionally, studies have implicated Acinetobacter baumannii for high rates of antibiotic-resistant nosocomial infections which have an extremely high mortality rate. European ICUs have documented 19.1% of all cases of VAP to be caused by Acinetobacter baumannii [27]. A. baumannii has also been known to persist for long periods of time on artificial surfaces such as catheters and bed surfaces [28-30].
Moraxella group has been implicated in the exacerbation of COPD in adults and is a common cause of otitis media in children and infants. It is commonly overlooked in hospital samples due to its similarity to Neisseria spp. which is a common commensal in humans [31].
Staphylococcus hominis, although a very common commensal, has been implicated in multidrug resistance and infection in immunocompromised individuals [32-34]. Staphylococcus cohnii has traditionally been classified as a human commensal and resulted in many complications including high levels of multi-drug resistance as well as infection in catheters and prosthetic devices [35]. Similarly, Staphylococcus haemolyticus infections are found due to the colonisation of prosthetic devices and catheters and are extremely difficult to treat due to multi-drug resistance and biofilm formation [36]. Unusual pathogens such as Staphylococcus gallinarum have been implicated in blood and wound infections in immunocompromised patients [37].
Micrococcus luteus has also been implicated in infections in immunocompromised individuals [38-40]. Other isolates such as Bacillus subtilis, B. pumilus, B. atrophaeus, and Brevibacilus laterosporus are non-pathogenic to humans [41-43].
It is important to note that the IMA value calculated at the end of Phase I was in the unacceptable range (>91 CFU/dm2/hour) for aseptic rooms indicated by the safe limits of the 1/1/1 scheme presented by Fisher G et al., in [Table/Fig-16]. However, unlike the present study which uses TSA agars as the medium for air sampling, Fisher G et al., used blood agar plates. Blood agar is extremely useful in growing fastidious organisms such as Streptococci spp. However, inhibitory to Haemophilus spp. and Neisseria spp. The bioload limits outlined by Fisher G et al., can be used as a rough criterion for the different hospital environments and the varying range of bio-risk [44].
Safe limits for Index of Microbial Air Contamination (CFU/dm2/hr) (44).
| Location | Optimal (CFU/dm2/hr) | Acceptable | Unacceptable (CFU/dm2/hr) |
|---|
| Medical wards | 0-450 | 451-750 | >751 |
| Surgical wards | 0-250 | 251-450 | >451 |
| Pharmacy | 0-100 | 101-180 | >181 |
| Aseptic rooms | 0-50 | 51-90 | >91 |
| Operating theatre (at rest) | 0-4 | 5-8 | >9 |
| Operating theatre (in activity) | 0-60 | 61-90 | >91 |
Safe limits for the SAS values are referenced in [Table/Fig-17] from the World Health Organisation (WHO) report for Environmental Monitoring of Clean Rooms in Vaccine Manufacturing Facilities 2012 [45]. These values were instituted for aseptic rooms and clean rooms for the production of vaccines. A study by Dharan S and Pittet D, concluded that until recently, there are no standardised methods for active air sampling, hence clean room standards could be applied to SAS values to validate and compare TVC values [46].
Safe limits for Surface Air Sampling (CFU/m3) (45).
| Grades | SAS (CFU/m3) |
|---|
| A | <1 |
| B | 10 |
| C | 100 |
| D | 200 |
These values can be used as a crude, albeit relatively accurate reference point for areas in the hospital which have similar aseptic protocols such as the ICU and joint replacement operating rooms.
The mean environmental TVC value found in this study after the addition of outlet filters of the ICU ventilators was 26.91 CFU/m3. This value lies between Grades B and C in the safe limits for SAS.
Although the Phase II TVC counts have decreased significantly as compared to Phase I TVC values, it still lies over the IMA safety standards set by Fisher et al., [44]. Similarly, the Phase II SAS values are above the clean room standards set by the WHO [45].
Hence other sources can be hypothesised to increase the TVC rates in the ICU. One such source can be contributed to the ventilation system of the ICU as concluded in the study by Kumari DN et al. This study detected the spread of MRSA through the ventilation grills [47]. The Ideal ICU should have at least 15 air changes per hour (10 recirculation+5 fresh) as per minimum ASHRAE standards and a positive pressure gradient of at least 15 Pa should be available between the isolation cubicle and the main ICU [48]. Other sources of increased TVC could be implicated in the ICU personnel and the lack of use of single-use masks and sterile scrubs when entering the ICU. As concluded in the study by Bischoff WE et al., the use of surgical gowns and masks decrease the airborne spread of organisms such as Staphylococcus aureus [49]. Other factors such as traffic in the ICU contribute immensely to nosocomial infections. A patient in the ICU has been found to be visited at least by 3 to 5 different people per hour [50] and with these staggering rates for each patient, the amount of traffic into the ICU can carry severe implications to the introduction of air contaminants.
Limitation
The limitation of the study is that viruses and fungal species were not taken into account. This study focused on the bacterial microorganisms that were present in the ICU environment from the outlet valves of ventilator patients. However, it is important to note that key virus and fungal species also play a large role in the nosocomial infection rates, and must be taken into consideration for further studies.
Conclusion
The significant reduction in Total Viable Count (TVC) following the placement of Heat and Moisture Exchanger (HME) outlet filters in the present study may be an implication of favourable patient outcomes. However, certain associations are yet to be investigated such as the ICU traffic, patient load and housekeeping protocols which may contribute to improving air quality. This will enable a reduction in the TVC to meet standards set internationally and lower mortality rates in the ICU.
Author contributions
AL and ALV equally contributed as the primary authors in the conception, methodology, formal analysis, investigation and preparation of the initial and final manuscript. AM contributed to the conception, formal analysis and supervision. KKL contributed to the formal analysis, review of the manuscript, provided resources, fund acquisition and project management.
Funding: The present study was funded by the Medical Director of Bharati Hospital and Research Centre, Pune, Maharashtra, India.
*Number of colonies counted on the sample plate
*Number of colonies counted on the sample plate