Introduction
Prevalence of obesity and its complications are reaching to epidemic proportions. For its early detection, various anthropometric indices like Waist Circumference (WC), Waist-To-Height Ratio (WHtR) and Conicity Index (CI) have been utilised.
Aim
To determine the discriminative abilities among anthropometric indices (WC, WHtR, CI) in predicting excess fatness.
Materials and Methods
Eighty seven (87) healthy adolescents of age between 17 to 25 years were enrolled for the study. Using standard protocol all the anthropometric and body composition parameters was recorded. Body Mass Index (BMI) was calculated by; Weight (kg)/Height (m2), WHtR by dividing the WC by the height and CI from mathematical equation CI=WC (m)/0.109√Weight (kg)/Height (m). Body composition parameters were determined using bio-impedance analysis technique.
Mean, Standard Deviation (SD) and correlation coefficient (r) was calculated. Receiver operating characteristic curve analysis was used to determine predictive abilities of the anthropometric indices of obesity.
Results
Body composition parameters have shown very strong correlation (p<0.0001) with all the indices of obesity. WHtR correlated maximally with total body fat (r=0.860) whereas WC with body fat percent (r=0.867). CI has correlated maximally with body fat percent (r=0.503) followed by total body fat (r=0.464). BMI did not correlate with any of them. On comparison of AUC, WHtR and WC has the highest percentage under curve for all the body composition parameters. Most accurate cut-off points of ROC curve revealed that WHtR, WC and CI at the cut-off value of 0.52, 87 cm and 1.3 (m2/3/kg1/2) respectively are better discriminators for all the body composition parameters.
Conclusion
Strong correlation exists between body composition parameters and anthropometric indices of obesity except BMI. WHtR, WC and CI emerged as most sensitive and specific indices to predict body composition, comparable to the values obtained from BIA analysis. However, BMI should be used with caution in assessment of central obesity.
BIA analysis, Central obesity, Conicity index, Waist circumference, Waist to height ratio
Introduction
Incidence of overweight and obesity are increasing worldwide [1]. India is also facing the same problem due to rapid economic growth, industrialization, urbanisation and life style changes [2]. Obesity, once most neglected is now considered as disease in its own due to its associated morbidity and mortality resulting from metabolic, endocrine, cerebro-vascular and cardiovascular complications.
There are plentiful evidences to suggest that visceral fat in central obesity is the most important risk factor for metabolic syndrome and its complications [3,4]. Such individuals are prone for early death due to myocardial infarction, cerebrovascular accidents and insulin resistance [5,6].
To prevent the menace of obesity, current emphasis is on early detection of excess fat. This has led to quest for simple, cost- effective, non-invasive and sophisticated techniques and markers with potential discriminatory ability for visceral fat.
Various anthropometric derived indices have been utilised for this purpose since long and their effectiveness has been ascertained in the past studies [7,8]. Despite of limitations in assessing visceral fat, BMI is still most widely used tool. Other indices like WC, WHtR, BMI and CI [9-11] have emerged out as the proxy markers in assessing and managing health outcomes of central obesity [3]. They gained importance because they are simple in calculation, inexpensive, and can be used over large population [10].
Studies on the western population have analysed the abilities of the anthropometric indices of obesity in prediction of excess body fat [12,13]. Such type of studies in Indian context is lacking.
In this context, present study aimed to determine discriminative abilities of four commonly used obesity indices WC, WHtR, BMI and CI in predicting important body composition parameters viz., total body fat, body fat percent, muscle mass percent and body water percent.
Materials and Methods
A cross-sectional observational study was conducted on eighty-seven (87) healthy medical students of age between 17 to 25 years admitted to 1st professional MBBS during academic session 2016-17. Out of the total one hundred (100) students admitted, eighty seven (87) students fulfilling the inclusion criteria were retained in the study. After obtaining ethical clearance (No: EC/SAIMS/Dec16) and informed written consent from the participants, the data were collected by the investigator of the project.
Standard protocol was adopted throughout the study for recording of anthropometric and body composition parameters [14]. Weight was measured in standing position in light clothing without shoes to the nearest 0.1 kg on a calibrated weighing scale. Wall mounted stadiometer was used to measure height in erect posture to the nearest 0.1 cm. WC was measured horizontally by non elastic measuring tape at the midpoint between the lowest costal ridge and the upper border of the iliac crest to the nearest 0.5 cm.
Anthropometric indices of obesity were derived by applying mathematical formulas. BMI was calculated by the formula, Weight (kg)/Height (m2). WHtR was calculated by dividing the WC by the height.
To calculate CI the following mathematical equation was used [7].
CI=WC (m)/0.109√Weight (kg)/Height (m).
Body composition parameters like total body fat, body fat percent, muscle mass percent and body water percent were determined using BIA (Bio-Impedance Analysis) technique (Tanita-MC 180 MA-Japan). BIA test protocol was explained to the participants prior to recording [14].
Since BIA measurements are affected by various individual and environmental factors such as body position, hydration status, skin temperature, recent physical activity, drugs etc. Therefore to keep the standardisation of measurement conditions, subjects with dehydration, acute and chronic illness, and menstruating females were excluded from the study [15].
Statistical Analysis
Normality of the data was assessed by the Kolmogorov-Smirnov test. Mean, standard deviation and Pearson’s correlation coefficient (r) were calculated for the test variables. Receiver Operating Characteristic (ROC) curve analysis was used to determine Area Under Curves (AUC) to evaluate the predictive abilities of the anthropometric indices of obesity [16]. All the calculations were done on MedCalc V.18.10.2, statistical software. Statistical significance was fixed at p<0.05 for all the tests performed.
Results
The base line characteristics of the study participants are presented in [Table/Fig-1]. Pearson’s correlation coefficient of the measured anthropometric indices of obesity with body composition parameters is shown in [Table/Fig-2].
Characteristics of study population.
| Parameter | Entire Series (n=87) |
|---|
| Mean±Standard Deviation |
|---|
| Age (yrs) | 18.96±1.63 |
| Weight (kg) | 62.67±15.69 |
| Height (cm) | 166.20±9.05 |
| Waist Circumference (cm) | 87.17±13.56 |
| Waist to height ratio | 0.524±0.079 |
| BMI (kg/m2) | 22.53±4.60 |
| Conicity Index (m2/3/kg1/2) | 1.30±0.10 |
| Total body Fat (kg) | 18.49±9.54 |
| Total body Fat percent (%) | 28.32±9.47 |
| Total Body water percent (%) | 48.02±6.34 |
| Muscle Mass percent (%) | 67.48±9.38 |
Correlation of obesity markers with body composition parameters.
| Obesity marker | Correlation coefficient | Total Body Fat | Body Fat Percent | Body Water Percent | Muscle Mass Percent |
|---|
| Waist Circumference | r (95% CI) | 0.867 (0.803 to 0.911) | 0.712 (0.590 to 0.802) | -0.615 (-0.731 to -0.465) | -0.554 (-0.685 to -0.389) |
| p | <0.0001*** | <0.0001*** | <0.0001*** | <0.0001*** |
| Waist to Height Ratio | r (95% CI) | 0.860 (0.793 to 0.906) | 0.833 (0.755 to 0.888) | -0.675 (-0.775 to -0.541) | -0.666 (-0.769 to -0.530) |
| p | <0.0001*** | <0.0001*** | <0.0001*** | <0.0001*** |
| Body Mass Index | r (95% CI) | 0.205 (-0.005 to 0.398) | 0.2021 (-0.008 to 0.395) | -0.097 (-0.301 to 0.115) | -0.267 (-0.452 to -0.060) |
| p | 0.0568* | 0.060* | 0.369* | 0.012* |
| Conicity Index | r (95% CI) | 0.464 (0.281 to 0.615) | 0.5033 (0.327 to 0.645) | -0.380 (-0.547 to -0.185) | -0.459 (-0.611 to -0.275) |
| p | <0.0001*** | <0.0001*** | 0.0001*** | <0.0001*** |
* Insignificant p-value (two tailed), ***Highly significant p-value (two tailed).
r-Pearson’s correlation coefficient, 95% C I-95% confidence interval.
Body composition parameters have shown strong positive correlation (p<0.0001) with all the indices of obesity except total body water and muscle mass percent which showed strong negative correlation. Total body fat has maximally correlated with WC (r=0.867) and waist to height ratio (r=0.860) respectively. Similarly body fat percent depicted maximum correlation with WHtR (r=0.810) followed by WC (r=0.712). Furthermore, muscle mass percent has shown maximum negative correlation with WHtR (r=-0.666) followed by WC (r=-0.554) [Table/Fig-2].
Result showed that CI has correlated maximally with body fat percent (r=0.503) followed by Total body fat (r=0.464) whereas BMI did not correlated with any of the measured body composition parameters (p>0.05). ROC curves for each anthropometric indicators of obesity according to sensitivity and specificity in prediction of body composition parameters are presented in [Table/Fig-3,4].
Comparison of Area Under Curves (AUC) of obesity markers.
| Obesity marker | Total Body Fat | Body Fat Percent | Muscle Mass percent | Body Water Percent |
|---|
| AUC (95% CI) p-value | AUC (95% CI) p-value | AUC (95% CI) p-value | AUC (95% CI) p-value |
|---|
| Waist Circumference | 0.934 (0.859 to 0.976) | 0.827 (0.731 to 0.899) | 0.874 (0.751 to 0.913) | 0.844 (0.751 to 0.913) |
| <0.0001*** | <0.0001*** | <0.0001*** | <0.0001*** |
| Waist to Height Ratio | 0.938 (0.865 to 0.979) | 0.944 (0.873 to 0.982) | 0.882 (0.795 to 0.941) | 0.882 (0.795 to 0.941) |
| <0.0001*** | <0.0001*** | <0.0001*** | <0.0001*** |
| Body Mass Index | 0.527 (0.417 to 0.635) | 0.544 (0.434 to 0.651) | 0.620* (0.509 to 0.722) | 0.531* (0.421 to 0.639) |
| 0.712* | 0.554* | 0.971* | 0.671* |
| Conicity Index | 0.720 (0.615 to 0.811) | 0.747 (0.643 to 0.833) | 0.722 (0.616 to 0.812) | 0.717 (0.612 to 0.801) |
| <0.0001*** | <0.0001*** | <0.0001*** | <0.0001*** |
*Insignificant p-value (two tailed), ***Highly significant p-value (two tailed).
Comparison of ROC Curves of obesity markers.
Youden index; J<0.5 (Less diagnostic effectiveness)
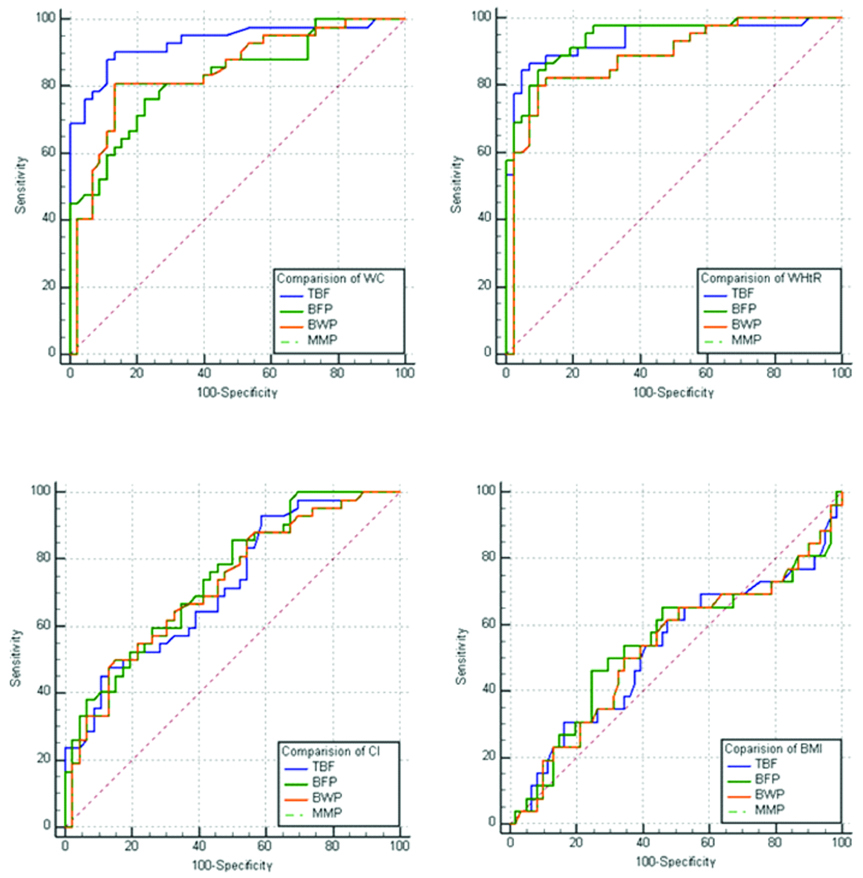
On comparison AUC with 95% confidence interval, WHtR followed by WC has the highest percentage under curve for all the body composition parameters. Among the other adiposity indices AUC of CI is greater than BMI. For discriminating body composition parameters all differences were strongly significant (p<0.0001).
The evaluation of the most accurate cut-off points of ROC curve revealed that CI, WHtR and WC at the cut-off value of 1.3 (m2/3/kg1/2), 0.52 and 87 cm respectively are better discriminators for all the body composition parameters. Their sensitivity, specificity and Youden index are highest and very close to the optimal cut-off limits. However, lowest efficacy in predicting body composition is recorded for BMI [Table/Fig-4,5].
Sensitivity, specificity of obesity markers in prediction of body composition parameters.
| Obesity marker | Optimal Cut-off | | Total Body Fat | Body Fat Percent | Muscle Mass Percent |
|---|
| Waist Circumference | 87 cm | Sensitivity % | 90.48 | 76.19 | 80.95 |
| Specificity % | 86.67 | 77.78 | 86.67 |
| Youden index (J) | 0.771 | 0.539 | 0.676 |
| Waist to Height Ratio | 0.52 | Sensitivity % | 84.44 | 84.44 | 80.00 |
| Specificity % | 95.24 | 90.48 | 90.48 |
| Youden index (J) | 0.796 | 0.749 | 0.704 |
| Body Mass Index | 25 kg/m2 | Sensitivity % | 76.92 | 46.15 | 50.00 |
| Specificity % | 8.20 | 75.41 | 65.57 |
| Youden index (J) | 0.148 | 0.215 | 0.155 |
| Conicity Index | 1.3 | Sensitivity % | 47.62 | 85.71 | 80.95 |
| Specificity % | 86.96 | 50.00 | 55.56 |
| Youden index (J) | 0.345 | 0.357 | 0.367 |
Discussion
In the present study body composition parameters has shown a strong positive correlation (p<0.0001) with all the indices of obesity except total body water and muscle mass percent which showed negative correlation.
Total body fat maximally correlated with WC (r=0.867) followed by WHtR (r=0.860). Similarly, Body Fat Percent (BFP) has maximum correlation with WHtR (r=0.810) followed by WC (r=0.712). However, muscle mass percent and total body water showed maximum negative correlation with WHtR followed by WC in decreasing order [Table/Fig-2]. These findings are similar to the various recent studies in which WHtR found to be better predictor of visceral fat [17,18] this might be due to incorporation of height which in turn influences the distribution of body fat [19].
CI which is a novel indicator of central obesity has correlated maximally with body fat percent (r=0.503) followed by total body fat (r=0.464). These findings are similar to the findings of Mueller WH et al., [Table/Fig-2] [20]. However, in another study CI was reported intermediary between WC and WHtR for its association with body composition parameters [21].
Studies of the past have yielded conflicting results regarding BMI in predicting central obesity. In some of the studies BMI was correlated better than WC and WHtR in predicting visceral fat [22,23]. Majority of recent studies agreed that for visceral fatness, BMI is not a better indicator compared to WC, WHtR and CI [24,25]. In the present study, BMI did not correlate (p>0.05) with any of the measured body composition parameters. These findings are in consonance with the findings of past studies [24,25]. Moreover, it was further noted in some studies [26,27] that BMI differs considerably across gender, age, and race, thus it gives inconsistent results and does not necessarily reflect true body fatness [28].
To evaluate and discriminate the diagnostic performance of the anthropometric indicator of obesity, area under the ROC curve (AUC) was calculated, which reveals that WC, WHtR and CI are equally and significantly (p<0.0001) strong in discriminating body composition parameters of obesity [Table/Fig-3,5]. WHtR and CI has the highest percentage under curve for all the body composition parameters followed by WC. BMI has the least discriminating abilities among the adiposity indices. Similar trends were seen in most of the past studies, however in quite a few studies varying results been reported [24,25,29-31]. In some of the studies [29-31] no difference was observed, whereas most of the other studies agreed that WC, WHtR and CI measures central obesity better than BMI [24,25]. The differences may be due to the confounding effect of ethnic and racial variations. Since, Asians could accumulate more total body fat and visceral fat with an increase in body weight as compared to other races [32]. Moreover, BMI has limitations in distinguishing between body fat and muscle mass. Hence, labelled as crude screening tool of fatness [11,28].
Evaluation of the most accurate cut-off points of ROC curve revealed that WHtR and CI at the cut-off value of 0.52, and 1.3 (m2/3/kg1/2) respectively showed highest sensitivity, specificity and Youden index (j). Therefore are better discriminators for body composition parameters. However, Youden index recorded for muscle mass percent does not reach to optimal cut-off level [Table/Fig-4].
For predicting body composition parameters suggested cut-off values in our study for WHtR, WC and CI are 0.52, 87 (cm) and 1.3 (m2/3/kg1/2) respectively. Similar cut-off values were reported in literature pertaining to the Asians population [33]. Conversely, European and American values are higher than the values of the present study [34]. Warranting their use on our population else, they yield false negative results in diagnosis of central obesity.
Limitation
Sample size is small, representing urban healthy adolescents, missing obese population who had different body composition. That group requires further examination. Further studies on larger population base should be done.
Conclusion
Present study emphasises clinical relevance of anthropometric indices of obesity in screening visceral fat and risks of central obesity. WHtR, WC and CI emerged as most sensitive and specific indices to predict body composition, comparable to the values obtained from BIA analysis. Findings of present study indicate that, BMI should be used with caution for assessment of central obesity.
* Insignificant p-value (two tailed), ***Highly significant p-value (two tailed).
r-Pearson’s correlation coefficient, 95% C I-95% confidence interval.
*Insignificant p-value (two tailed), ***Highly significant p-value (two tailed).
[1]. World Health Organization (WHO). Obesity: preventing and managing the global epidemic. Report of a WHO consultation. (1-253)World Health Organ Tech Rep Ser 2000 894:i-xii. [Google Scholar]
[2]. Deepa M, Farooq S, Deepa R, Manjula D, Mohan V, Prevalence and significance of generalized and central body obesity in an urban Asian Indian population in Chennai, India (CURES: 47)Eur J Clin Nutr 2009 63(2):259-67.10.1038/sj.ejcn.160292017928807 [Google Scholar] [CrossRef] [PubMed]
[3]. Bao Y, Lu J, Wang C, Optimal waist circumference cut-offs for abdominal obesity in ChineseAtherosclerosis 2008 201(2):378-84.10.1016/j.atherosclerosis.2008.03.00118417137 [Google Scholar] [CrossRef] [PubMed]
[4]. Geneva: Switzerland, WHO; 2009. [last accessed on November 3, 2018]. World Health Organization (WHO). Global health risks: mortality and burden of disease attributable to selected major risks. Available from: http://www.who.int/healthinfo/global_burden_disease/GlobalHealthRisks_report_full.pdf [Google Scholar]
[5]. Poulter N, Global risk of cardiovascular diseaseHeart 2003 89(suppl 2):112-15.10.1136/heart.89.suppl_2.ii212695425 [Google Scholar] [CrossRef] [PubMed]
[6]. Grundy SM, Cleeman JI, Daniels SR, Donato KA, Eckel RH, Franklin BA, American Heart Association; National Heart, Lung, and Blood Institute. Diagnosis and management of the metabolic syndrome: an American Heart Association/National Heart, Lung, and Blood Institute Scientific StatementCirculation 2005 112(17):2735-52.10.1161/CIRCULATIONAHA.105.16940416157765 [Google Scholar] [CrossRef] [PubMed]
[7]. Valdez R, Seidell JC, Ahn YI, Weiss KM, A new index of abdominal adiposity as an indicator of risk for cardiovascular disease. A cross-population studyInt J Obes Relat Metab Disord 1993 17(2):77-82. [Google Scholar]
[8]. Ho SY, Lam TH, Janus ED, Waist to stature ratio is more strongly associated with cardiovascular risk factors than other simple anthropometric indicesAnn Epidemiol 2003 13(10):683-91.10.1016/S1047-2797(03)00067-X [Google Scholar] [CrossRef]
[9]. Pitanga FJ, Lessa I, Anthropometric indexes of obesity as an instrument of screening for high coronary risk in adults in the city of Salvador-BahiaArq Bras Cardiol 2005 85(1):26-31.10.1590/S0066-782X200500140000616041451 [Google Scholar] [CrossRef] [PubMed]
[10]. Almeida RT, Almeida MM, Araújo TM, Abdominal obesity and cardiovascular risk: performance of anthropometric indexes in womenArq Bras Cardiol 2009 92(5):345-50.:362-67.:375-80.10.1590/S0066-782X200900050000719629289 [Google Scholar] [CrossRef] [PubMed]
[11]. Lee CM, Huxley RR, Wildman RP, Woodward M, Indices of abdominal obesity are better discriminators of cardiovascular risk factors than BMI: a meta-analysisJ Clin Epidemiol 2008 61(7):646-53.10.1016/j.jclinepi.2007.08.01218359190 [Google Scholar] [CrossRef] [PubMed]
[12]. Weili Y, He B, Yao H, Dai J, Cui J, Ge D, Waist-to-height ratio is an accurate and easier index for evaluating obesity in children and adolescentsObesity (Silver Spring) 2007 15(3):748-52.10.1038/oby.2007.60117372326 [Google Scholar] [CrossRef] [PubMed]
[13]. Neovius M, Linné Y, Rossner S, BMI, waist-circumference and waist-hip ratio as diagnostic tests for fatness in adolescentsInt J Obes (Lond) 2005 29(2):163-69.10.1038/sj.ijo.080286715570312 [Google Scholar] [CrossRef] [PubMed]
[14]. Bioelectrical impedance analysis in body composition measurement. Proceedings of a National Institutes of Health Technology Assessment Conference. Bethesda, Maryland, December 12-14, 1994Am J Clin Nutr 1996 64(3 Suppl):387S-532S.10.1093/ajcn/64.3.387S8928699 [Google Scholar] [CrossRef] [PubMed]
[15]. Kushner RF, Gudivaka R, Schoeller DA, Clinical characteristics influencing bioelectrical impedance analysis measurementsAm J C/in Nutr 1996 64(3 Suppl):423S-427S.10.1093/ajcn/64.3.423S8780358 [Google Scholar] [CrossRef] [PubMed]
[16]. DeLong ER, DeLong DM, Clarke-Pearson DL, Comparing the areas under two or more correlated receiver operating characteristic curves: a nonparametric approachBiometrics 1988 44(3):837-45.10.2307/25315953203132 [Google Scholar] [CrossRef] [PubMed]
[17]. Bennasar-Veny M, Lopez-Gonzalez AA, Tauler P, Cespedes ML, Vicente-Herrero T, Yañez A, Body adiposity index and cardiovascular health risk factors in Caucasians: A comparison with the body mass index and othersPLoS One 2013 8(5):e6399910.1371/journal.pone.006399923734182 [Google Scholar] [CrossRef] [PubMed]
[18]. Verma M, Rajput M, Sahoo SS, Kaur N, Ravi R, Correlation between the percentage of body fat and surrogate indices of obesity among adult population in rural block of HaryanaJ Family Med Prim Care 2016 5(1):154-59.10.4103/2249-4863.18464227453862 [Google Scholar] [CrossRef] [PubMed]
[19]. Ashwell M, Gibson S, Waist to height ratio is a simple and effective obesity screening tool for cardiovascular risk factors: Analysis of data from the British National Diet And Nutrition Survey of adults aged 19-64 yearsObes Facts 2009 2(2):97-103.10.1159/00020336320054212 [Google Scholar] [CrossRef] [PubMed]
[20]. Mueller WH, Meininger JC, Liehr P, Chan W, Chandler PS, Conicity: A new index of body fat distribution-what does it tell us?Am J Hum Biol 1996 8(4):489-96.10.1002/(SICI)1520-6300(1996)8:4<489::AID-AJHB9>3.0.CO;2-T [Google Scholar] [CrossRef]
[21]. Chatterjee D, Ghosh JR, Chanda S, Bandyopadhyay AR, Relationship between Anthropometric measurements and body composition among Santal girls aged between 6-18 years of Galudih, Jharkhand, IndiaAnthropologist 2006 8(4):241-43.10.1080/09720073.2006.11890970 [Google Scholar] [CrossRef]
[22]. Camhi SM, Bray GA, Bouchard C, Greenway FL, Johnson WD, Newton RL, The relationship of waist circumference and BMI to visceral, subcutaneous, and total body fat: sex and race differencesObesity 2011 19(2):402-08.10.1038/oby.2010.24820948514 [Google Scholar] [CrossRef] [PubMed]
[23]. Barreira TV, Staiano AE, Harrington DM, Heymsfield SB, Smith SR, Anthropometric correlates of total body fat, abdominal adiposity, and cardiovascular disease risk factors in a biracial sample of men and womenMayo Clin Proc 2012 87(5):452-60.10.1016/j.mayocp.2011.12.01722560524 [Google Scholar] [CrossRef] [PubMed]
[24]. Kuk JL, Janiszewski PM, Ross R, Body mass index and hip and thigh circumferences are negatively associated with visceral adipose tissue after control for waist circumferenceAm J Clin Nutr 2007 85(6):1540-44.10.1093/ajcn/85.6.154017556690 [Google Scholar] [CrossRef] [PubMed]
[25]. Jia WP, Lu JX, Xiang KS, Bao YQ, Lu HJ, Chen L, Prediction of abdominal visceral obesity from body mass index, waist circumference and waist-hip ratio in Chinese adults: Receiver operating characteristic curves analysisBiomed Environ Sci 2003 16(3):206-11. [Google Scholar]
[26]. Jackson AS, Stanforth PR, Gagnon J, Rankinen T, Leon AS, Rao DC, The effect of sex, age and race on estimating percentage body fat from body mass index: The Heritage Family StudyInt J Obes Relat Metab Disord 2002 26(6):789-96.10.1038/sj.ijo.080200612037649 [Google Scholar] [CrossRef] [PubMed]
[27]. De Schutter A, Lavie CJ, Arce K, Menendez SG, Milani RV, Correlation and discrepancies between obesity by body mass index and body fat in patients with coronary heart diseaseJ Cardiopulm Rehabil Prev 2013 33(2):77-83.10.1097/HCR.0b013e31828254fc23399846 [Google Scholar] [CrossRef] [PubMed]
[28]. Nevill AM, Stewart AD, Olds T, Holder R, Relationship between adiposity and body size reveals limitations of BMIAm J Phys Anthropol 2006 129(1):151-56.10.1002/ajpa.2026216270304 [Google Scholar] [CrossRef] [PubMed]
[29]. Matos LN, Giorelli G, Dias CB, Correlation of anthropometric indicators for identifying insulin sensitivity and resistanceSao Paulo Med J 2011 129(1):30-35.10.1590/S1516-3180201100010000621437506 [Google Scholar] [CrossRef] [PubMed]
[30]. Decoda Study GroupNyamdorj R, Qiao Q, Lam TH, Tuomilehto J, Ho SY, BMI compared with central obesity indicators in relation to diabetes and hypertension in AsiansObesity (Silver Spring) 2008 16(7):1622-35.10.1038/oby.2008.7318421260 [Google Scholar] [CrossRef] [PubMed]
[31]. Gu JJ, Rafalson L, Zhao GM, Wu HY, Zhou Y, Jiang QW, Anthropometric measurements for prediction of metabolic risk among Chinese adults in Pudong new area of ShanghaiExp Clin Endocrinol Diabetes 2011 119(7):387-94.10.1055/s-0031-127714121553364 [Google Scholar] [CrossRef] [PubMed]
[32]. Deurenberg P, Deurenberg-Yap M, Guricci S, Asians are different from Caucasians and from each other in their body mass index/body fat per cent relationshipObes Rev 2002 3(3):141-46.10.1046/j.1467-789X.2002.00065.x12164465 [Google Scholar] [CrossRef] [PubMed]
[33]. Qiao Q, Nyamdori R, Is the association of type II diabetes mellitus with waist circumference or waist-to-hip ratio stronger than that with body mass index?Eur Clin Nutr 2010 64(1):30-34.10.1038/ejcn.2009.9319724291 [Google Scholar] [CrossRef] [PubMed]
[34]. Obesity in Asia CollaborationHuxley R, Barzi F, Lee CM, Lear S, Shaw J, Waist circumference thresholds provide an accurate and widely applicable method for the discrimination of diabetesDiabetes Care 2007 30(12):3116-18.10.2337/dc07-145517804678 [Google Scholar] [CrossRef] [PubMed]