Of all the malignancies that can potentially develop in our body, Colorectal Carcinoma (CRC) is one of the entities that have been placed at the apex. Presently it is the 4th most common cancer in men and 3rd most common cancer in females worldwide [1]. Many molecules are produced by the tumour cells as well as the stroma which facilitates the invasion and metastasis of the tumour into deeper tissue and away from the site of its origin. Matrix Metallopeptidase (MMP) is one such molecule that is involved in cancer development and invasion by releasing various bioactive molecules, help in inhibiting apoptosis, degrade Extracellular Matrix (ECM), promote angiogenesis and modulate the immune response against cancer cells [2]. CD10 is a membrane bound zinc dependant metalloprotease, which normally can be expressed in epithelial cells of kidney, breast, lung and others. However, it has been observed that during development of many tumours, there is a deranged expression of CD10 [3]. Expression of CD10 in many tumours has been well established. In breast carcinoma they have been associated with poor prognosis [4]. In CRC its expression and role is still under research. A major chunk of CRC develops from its premalignant precursor, adenomas. This is an important finding and if adenomas are removed in time, we might be able to prevent its development to full blown carcinoma.
Tissue Microarray (TMA) is a method where a number of tissues of different patients can be clubbed together in a single block and studied. By this method, a large number of sections can be evaluated and compared there by, saving time and resources. Arrayers used for TMA are available; however, they are quite expensive. To achieve cheap TMA, many research workers have devised cheap methods using simple instruments like mechanical pencil tips [5-7].
Therefore, this study was taken up with the objective of studying the pattern of expression of CD10 in the stromal cells of colorectal adenomas and CRC and to compare with that in normal colonic mucosa by using a manual TMA. sCD10 expression was correlated with age, tumour grade, depth of invasion and nodal status in CRC.
Materials and Methods
The present study was a prospective and retrospective study conducted in the Department of Pathology, Kalinga Institute of Medical Sciences, Bhubaneswar, Odisha, India. The study was approved by institutional ethics committee (Ref.No.: KIMS/KIIT/IEC/033/2014). A total of 74 cases of colonic neoplasms encountered over a period of two years (August 2014 to July 2016) were included in the study. Out of these, 59 cases were adenocarcinomas and 12 were biopsy proven adenomas. Three tissues were lost during TMA processing. So a total of 71 cases including adenomas and adenocarcinomas were studied in a manually made TMA and were statistically analysed. In addition, five tissues from proximal colonic margin with the normal morphology were included in the TMA to study the pattern of sCD10 expression in neoplastic tissue in comparison to the normal areas.
Archival tissue blocks present in the department as well as resection specimens of the patients admitted in the hospital during the study period were included. Cases excluded were Core biopsies, Cell blocks, and Metastatic adenocarcinoma.
The parameters studied were as follows: Histological type, histological grade, depth of invasion (T), nodal metastasis (N), age, immunohistochemical expression of sCD10. Correlation between age, histological type, grade, nodal metastasis and sCD10 expression was done.
Histologic Examination
Specimens were routinely processed, fixed overnight in 10% buffered formalin. Four to five micrometer thick paraffin embedded tumour sections were stained with Haematoxylin and Eosin staining. Histologic examination of tumour type and grade were performed routinely according to the criteria outlined in the WHO classification of tumours [8].
Construction of Tissue Microarray
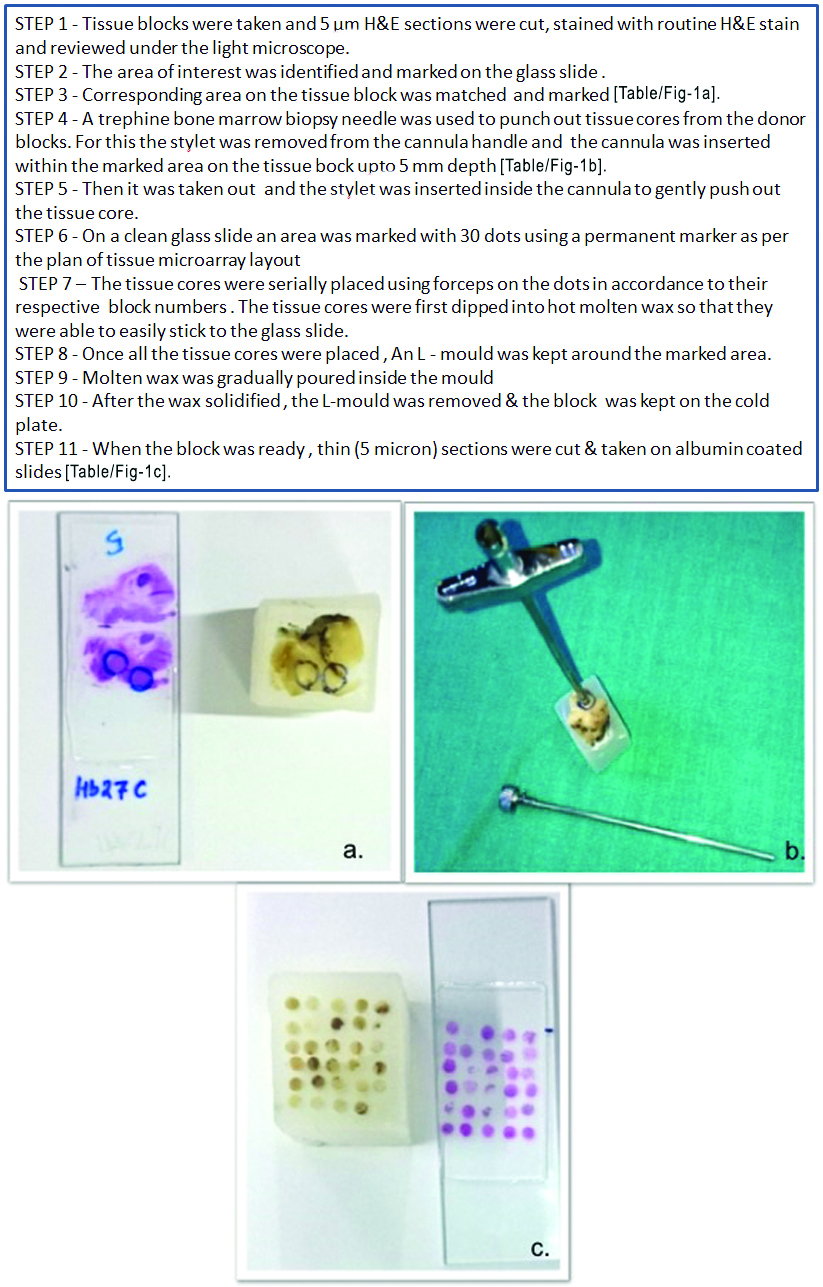
Three TMA blocks were manually constructed by a cost effective and easy method improvised in our laboratory [Table/Fig-1]. Two containing 30 tissue cores and another with 19 cores comprising of 74 cases and 5 normal colonic tissues.
Steps of Tissue microarray.
(a) The area of interest marked on the glass slide and corresponding area on the tissue block also matched and marked; (b) Tissue core punched out from donor block using bone marrow biopsy needle; (c) TMA block and stained slide respectively.
Immunohistochemical Analysis
Immunohistochemical evaluation of CD10 was done on formalin fixed paraffin embedded tissue sections (4-5 micrometer thick) on poly-L lysine coated slides by using polymer two-step indirect methods. The antibodies and chemicals were obtained from Biogenex, USA. Mouse monoclonal antibody to CD10 surface antigen (clone-56 C6; catalog no. AM 451-5M) was used for immunohistochemical evaluation of CD10. An unconjugated primary antibody is added followed by secondary antibody conjugated with enzyme Horse Radish Peroxidase (HRP) labeled to a polymer (dextran chain). The chromogen DAB (3, 3’ diamino benzene) is oxidised in presence of hydrogen peroxide releasing nascent oxygen which imparts brown colour to the tissue.
Quality Control
External positive and negative control slides were used with each batch of staining. Positive control slides were prepared from fibroadenoma known to be positive for CD10. Negative control slides were prepared from the same tumour block under study. The primary antibody step was omitted and slides were incubated with PBS instead. The assessment of immunohistochemical staining was carried out by three independent pathologists.
A semi quantitative system based on percentage of stromal cells showing cytoplasmic positivity was used [9]. It was scored as given in [Table/Fig-2]. For the purpose of statistical analysis, tumours having a final staining score of >/=1 were considered to be positive.
Scoring of percentage positivity of cells for sCD10.
| % of Cells positive for CD10 | Score |
|---|
| 0-5 | 0 |
| 5-30 | 1 |
| 30-60 | 2 |
| >60 | 3 |
Statistical Analysis
Statistical analysis was done to find out the significance of sCD10 expression in adenoma and carcinoma and association between sCD10 expression and various histopathological parameters. The relationship between qualitative parameters was determined using the Chi-square test. Statistical significance was defined as p<0.05.
Results
A total of 74 cases were taken including colorectal adenomas and adenocarcinomas but three tissues were lost in processing. Finally 71 cases including both adenomas (12 cases) and adenocarcinomas (59 cases) were studied. In addition five tissues from proximal margin with the normal morphology were included in the TMA to study the pattern of sCD10 expression in neoplastic tissue in comparison to the normal areas.
The age range of patients was from 19-74 years with a mean age of 46.5 years. Age group 50-59 years had the highest number of cases with 33.80% [Table/Fig-3].
Age distribution of all the cases (n=71).
| Age Group (In Years) | Number (N) | Percentage (%) |
|---|
| <20 | 1 | 1.40 |
| 20-29 | 10 | 14.08 |
| 30-39 | 7 | 9.86 |
| 40-49 | 16 | 22.53 |
| 50-59 | 24 | 33.80 |
| 60-69 | 7 | 9.86 |
| >/=70 | 6 | 8.45 |
| TOTAL | 71 | 100 |
For statistical analysis and CD10 correlation the patients were divided into 2 groups : <50 years age and >/=50 years. There was a male predominance with a M:F ratio of 1.62:1. Maximum number of cases was from rectum (43.66%). Adenomas constituted 16.90% of the study group. Different histological types of adenomas were villous adenoma (6.94%), tubular adenoma (5.56%) and tubulovillous with a total of 44.07%. Maximum number of cases according to tumour depth belonged to the T3 category. Out of the 12 cases of adenoma, low grade adenomas did not show sCD10 positivity whereas in cases of high grade adenoma 50% were positive for sCD10 [Table/Fig-4] and 50% were negative for sCD10. Out of the 59 cases of CRC, 49.15% (29/59 cases) were positive for stromal expression of CD10 and 50.85% (30/59 cases) were negative for sCD10.
sCD10 positivity in adenoma and adenocarcinoma.
| Variables | Total Number of Cases | SCD10 Positive | Scd10 Negative | χ2 | p-value |
|---|
| n | n | % | n | % |
|---|
| Low grade adenoma | 4 | 0 | 0.00 | 4 | 100.00 | 3.6831 | 0.15857 |
| High grade adenoma | 8 | 4 | 50.00 | 4 | 50.00 |
| Carcinoma | 59 | 29 | 49.15 | 30 | 50.85 |
The p-value is 0.158571. The result is not statistically significant (Chi-square test)
A 42.37% of cases were node positive (N1 and N2). While doing statistical analysis N1 and N2 were grouped together as node positive cases. A total of 44.12% (15/34) nodal negative cases were sCd10 positive where as only 40.00% (10/25) nodal positive cases were sCD10 positive [Table/Fig-5].
Correlation between stromal CD10 positivity and nodal metastasis (n=59).
| LN METS | Total Number of Cases | sCD10 Negative | sCD10 Positive | χ2 | p-value |
|---|
| n | n | % | n | % |
|---|
| Negative | 34 | 19 | 55.88 | 15 | 44.12 | 0.1 | 0.751788 |
| Positive | 25 | 15 | 60.00 | 10 | 40.00 |
(Chi-square test, p-value not statistically significant)
These values were statistically not significant. One possible reason could be because our number of node positive cases was less. sCD10 positivity in this study were found to be more with increase in depth of invasion, i.e., 50.00% (19/38) of T3 and 54.55% (6/11) of T4 cases were positive for sCD10 [Table/Fig-6]. But p-value was not statistically significant.
Correlation between SCD10 positivity and depth of invasion (T) (n=59).
| Depth of Invasion (T) | Total Number of Cases | SCD10 Negative | SCD10 Positive | Total (n) | χ2 | p-value |
|---|
| n | n | % | n | % |
|---|
| T2 | 10 | 6 | 60.00 | 4 | 40.00 | 100 | 0.4741 | 0.788953 |
| T3 | 38 | 19 | 50.00 | 19 | 50.00 | 100 |
| T4 | 11 | 5 | 45.45 | 6 | 54.55 | 100 |
Chi-square test, p-value not statistically significant
Discussion
Colorectal Carcinoma (CRC) is the 4th most common cancer in men and 3rd most common cancer in female worldwide [1]. In the Indian subcontinent also, the same values hold true. CRC is predominantly a disease of late middle-aged and elderly individual with a slight male predilection. Most though not all CRCs arise from adenomas. The conventional adenoma pathway accounts for approximately 70% to 80% of all CRCs. Conventional adenomas are of three types-tubular adenoma, villous adenoma, tubulovillous adenoma [10].
MMPs are family of zinc dependent neutral endopeptidase. They are characterized by their ability to degrade extracellular matrix proteins. In normal circumstances, they maintain tissue homeostasis, participate in normal development, angiogenesis and wound repair by initiating inflammatory, cardiovascular and neurogenic responses [11,12]. However, when their levels are elevated, like in cases of tumour, they cause tissue dissolution and make tumour cells able of invasion and metastasis [13,14].
In the present study, maximum number of cases, both adenoma and CRC, belonged to the age group of 50-59 years. The age ranged from 19 to 74 years with mean age being 46.5 years. For statistical purposes cases, CRC cases were grouped into <50 years and >/=50 years. In <50 years of age group 55.17% of cases showed sCD10 positivity [Table/Fig-7].
Correlation between sCD10 positivity and age (n=59)
| Age (In Years) | Total Number of Cases | sCD10 Negative | sCD10 Positive | χ2 | p-value |
|---|
| n | n | % | n | % |
|---|
| <50 | 29 | 13 | 44.83 | 16 | 55.17 | 0.0201 | 0.887276 |
| >/=50 | 30 | 14 | 46.67 | 16 | 53.33 |
Chi-square test, p-value not statistically significant
This value was slightly higher than sCD10 positivity seen in patients who were in >/=50 years of age group (53.33%). However, the p-value was not significant. Khairy RA et al., studied sCD10 positivity in relation to age [15]. They also divided their cases into less than 50 years and more than 50 years of age group in 30 CRC patients. They found that sCD10 positivity was more in the patients in the age group below 50 years, which was similar to the findings in this study.
Present study included 12 adenoma cases amongst which, five were villous adenomas, four were tubular adenomas and three were tubulovillous adenomas. Out of 12 adenoma cases four were low grade adenoma and eight were high grade adenoma [Table/Fig-4]. In the present study, low grade adenoma were found to be negative for sCD10 but 50% (4/8) cases of high grade adenoma were positive for sCD10 expression [Table/Fig-4] but probably because of the small number of cases the values were not statistically significant. Ogawa H et al., studied sCD10 expression in 169 cases [16]. They found that 21.9% cases of low grade adenoma were positive for sCD10 where as 70.6% cases of high grade adenoma were positive for sCD10. Jang TJ et al., conducted their study in 123 cases [17]. A 14% cases in low grade adenoma and 41% cases in high grade adenoma in their study showed positivity for sCD10. Khairy RA et al., did their study in 50 cases out of which 20 were colorectal adenomas [15]. Out of which they found that 30% cases of low grade adenoma were positive for sCD10 where as 60% cases of high grade adenoma showed sCD10 positivity. Our finding of increase in sCD10 positivity with increase grade of adenoma is similar to that of the findings of above mentioned studies.
CRC and sCD10
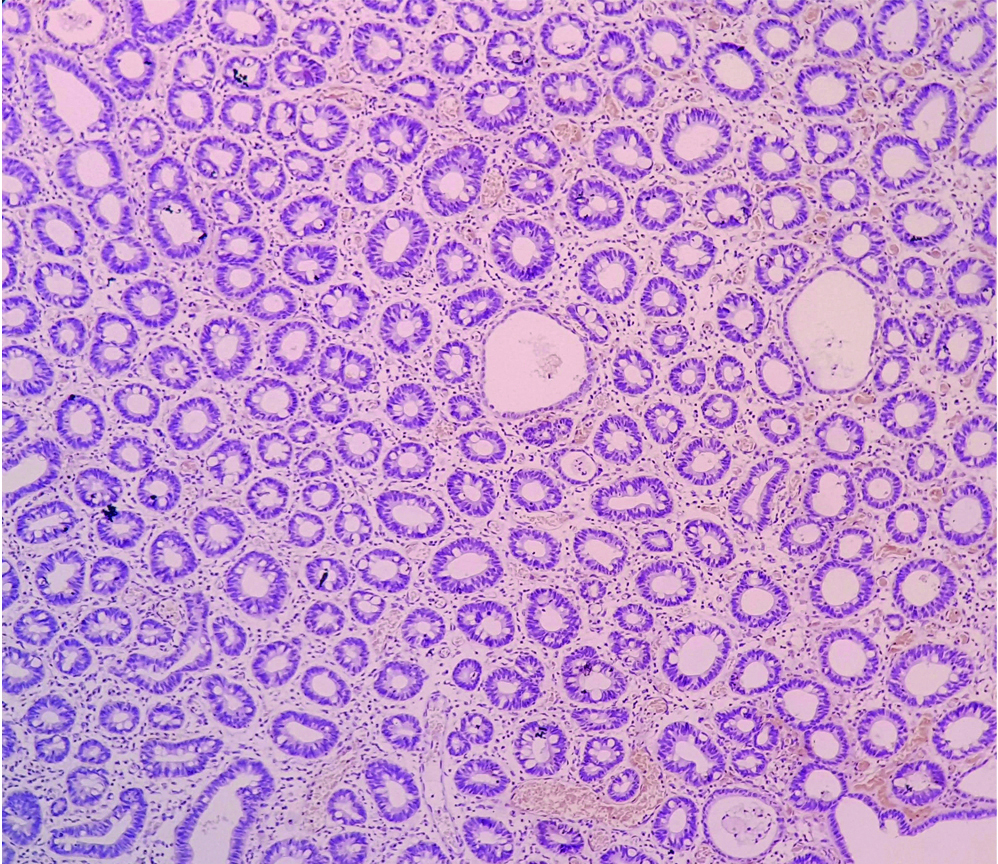
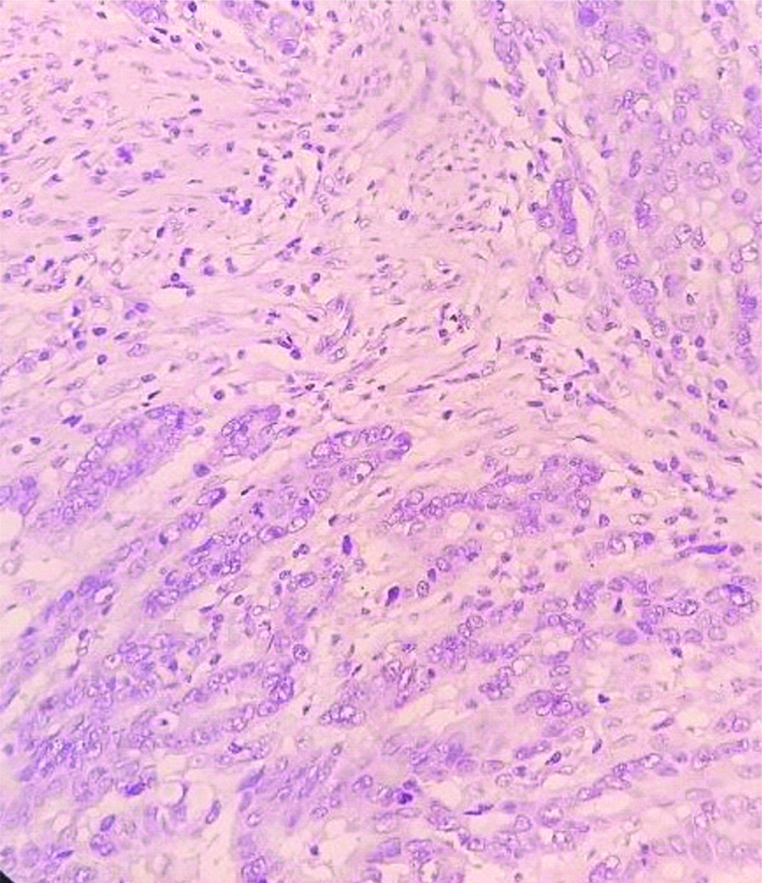
In the present study, 59 cases out of 71 were of CRC. Normal colonic tissue did not show stromal CD10 positivity [Table/Fig-8]. A 49.15% (29/59) CRC cases were positive for sCD10 expression [Table/Fig-9] whereas, 50.85% (30/59) cases showed no expression of sCD10 [Table/Fig-10]. Ogawa H et al., studied sCD10 expression in 169 cases [16]. Out of these, 63 were CRC cases. A 79.4% of their CRC cases were positive for sCD10 where as only 20.6% cases of CRC showed no sCD10 positivity. Jang TJ et al., studied 32 cases of CRC out of the 123 patients that they have included [17]. An 88% of their cases showed positivity for sCD10 expression. Khairy RA et al., studied sCD10 expression in 30 cases of CRC [15]. A 57% of their cases were positive for sCD10 where as 43% cases showed no sCD10 positivity.
Normal colonic mucosa, negative sCD10 (IHC, 10X).
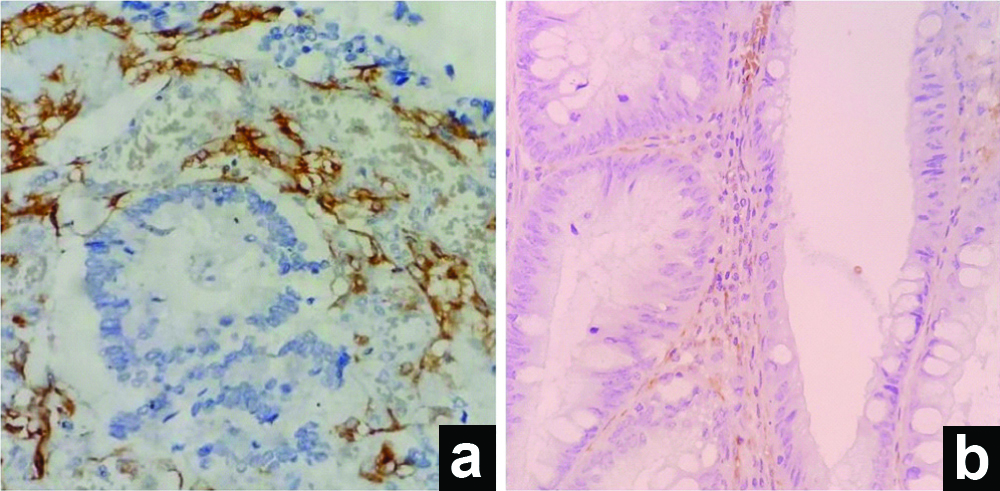
(a) Adenocarcinoma, positive sCD10 (IHC, 40X); (b) Adenoma, positive sCD10 (IHC, 100X).
sCD10 negative staining in carcinoma (IHC, 40X).
sCD10 and Grade of Carcinoma
Few of the previous studies have showed correlation between sCD10 expression and tumour grade in the cases of adenocarcinoma. In the present study, out of the 59 cases of CRC, 25 cases were of Grade 1, 26 cases were of Grade 2 and 8 cases were of Grade 3 [Table/Fig-11]. In Grade 1, 56.00% (14/25) of cases showed sCD10 positivity. In Grade 2, 42.31% (11/26) cases were positive for sCD10 and in Grade 3, 50% (4/8) cases were positive for sCD10 [Table/Fig-11].
Correlation between sCD10 and tumour grade in carcinomas (n=59).
| Tumour Grade | Total Number of Cases | SCD10 Negative | SCD10 Positive | χ2 | p-value |
|---|
| n | n | % | n | % |
|---|
| Grade 1 | 25 | 11 | 44.00 | 14 | 56.00 | 0.9587 | 0.619182 |
| Grade 2 | 26 | 15 | 57.69 | 11 | 42.31 |
| Grade 3 | 8 | 4 | 50.00 | 4 | 50.00 |
The values were not statistically significant. Khanh DT et al., found in their study that 36.0% of Grade1, 35.4% of Grade 2 and 41.7% of Grade 3 tumours were positive for sCD10 [9]. Their findings are similar to this study’s findings. Khairy RA et al., Jang TJ et al., and Bernescu I et al., showed in their study that sCD10 expression increases with increase in Grade of carcinoma, though most of them did not find statistical significance [15,17,18]. Similar to previous studies, this study did not find any correlation between sCD10 expression and tumour grade.
sCD10 and Depth of Invasion of the Tumour
One of the roles of MMPs is degradation of extracellular matrix which facilitates in invasion of the tumour. Many studies have shown the same, i.e., there is increase expression of sCD10 in tumours showing greater depth of invasion. In the present study, 16.95% CRC cases were T2. 64.41% cases of CRC were T3 and 18.68% CRC cases were T4 [Table/Fig-6]. A 40.00% (4/10) of T2 cases were sCD10 positive. sCD10 positivity in this study were found to be more with increase in depth of invasion, i.e., 50.00% (19/38) of T3 and 54.55% (6/11) of T4 cases were positive for sCD10 [Table/Fig-6]. However, p-value was not statistically significant. Khanh DT et al., and Khairy RA et al., in their study also found out increase expression of sCD10 with increase depth of tumour expression [9,15]. Our findings were similar to the finding of Khanh DT et al., and Khairy RA et al., and it showed that sCD10 expression increases with depth of invasion proving that the stromal expression of CD10 directly correlates with increase ability of the tumour to invade.
sCD10 and Nodal Status
CD10 expression in many of the other tumours has been associated with nodal positivity, distant metastasis and poor prognosis. In CRC, few of the authors like Khairy RA et al., and Jang TJ et al., have also supported a similar finding with increase in sCD10 expression in node positive cases [15,17]. In this study, out of 59 CRC cases, 34 cases showed no LN metastasis where as 25 cases showed nodal metastasis [Table/Fig-5]. A 44.12% (15/34) nodal negative case were sCd10 positive where as only 40.00% (10/25) nodal positive cases were sCD10 positive [Table/Fig-5]. These values were statistically not significant. One possible reason could be because our number of node positive cases was less. Bernescu I et al., who did their study in 2016, also found no correlation between LN positivity and sCD10 expression [18].
TMA are composite paraffin blocks which are constructed by punching out cylindrical tissue core “biopsies” from different paraffin donor blocks and then re-embedding these into a single recipient (microarray) block at defined array coordinates [5]. Both fully automated as well as manual tissue microarrayers are available in the market for TMA construction but they all are quite expensive. To combat the high cost of these machines, various research is on going for a cheaper alternative. Shebl AM et al., introduced an inexpensive mechanical pencil tip method [6]. Similarly Choi CH et al., discussed methods for making TMA kits and recipient blocks for manual construction of high-density TMAs at low cost using ordinary cannula piercing needles, hypodermic needles, bone marrow biopsy needles, metallic ink cartridges of ballpoint pens, and disposable skin biopsy punches to construct self-made manual TMA kits [7]. These were methods in which tissue cores were extracted from donor blocks and assembled into a recipient method. Manual construction of TMAs without using recipient blocks has also been described [7]. The method followed in the current study was the one without using recipient blocks. It is a manual method which is simple and cost effective can be used even in small laboratories. This method can be used for simultaneously assessing large number of specimens which can be stained with less amount of antibodies in much less time as compared to the regular methods.
Limitation
No statistically significant correlation was found between the stromal CD10 expression and age [Table/Fig-7], grade of tumour [Table/Fig-11] or lymph node metastasis in colorectal carcinoma in the present study which may be because of the small sample size and lesser number of high grade tumours and node positive cases.
Conclusion
Stromal CD10 expression can be used as a potential biomarker in colorectal carcinogenesis along the adenoma carcinoma sequence, however further similar studies with a bigger sample size should be carried out. Increased stromal CD10 expression with increased depth of tumour invasion suggests involvement of CD10 in invasive potential in CRC.
The p-value is 0.158571. The result is not statistically significant (Chi-square test)
(Chi-square test, p-value not statistically significant)
Chi-square test, p-value not statistically significant
Chi-square test, p-value not statistically significant