Around 50 million people in India are affected by osteoporosis or osteopenia and 15-20% of urban population aged over 50 years are showing evidence of at least one vertebral fracture [1]. Differential diagnosis for a collapsed vertebra includes trauma, osteoporosis, infections, primary bone tumours, metastasis and multiple myeloma. Conventional MRI has good sensitivity but lacks specificity in differentiating acute benign from pathological collapse [2]. This is because acute benign compression fracture shows hypointense marrow on T1WI because of oedema or haemorrhage. Even post contrast T1WI MRI is also not very helpful because there is disruption of blood bone barrier in acute benign collapse leading to post contrast enhancement. Adding Diffusion Weighted Imaging (DWI) sequence to routine conventional MRI sequences is helpful because DWI depends on cellularity of tissue [3].
The axial skeleton has good vascularity and hence metastatic fractures are common. Detection of these types of fractures and differentiation from myeloma, benign or infective causes is required for management. MRI with DWI will give us this information [8]. In addition to characterization of lesion, DWI has been also used as tumour-screening technique for whole-body, in a manner similar to Positron Emission Tomography (PET) [9].
Monitoring the ADC values of the lesion showing diffusion-restriction can help in assessing the response to therapy provided to patients. Increase in ADC values signifies positive response, whereas low ADC signifies residual or tumour recurrence. The above statement does not hold good for spinal pathologies. Normal vertebra shows low ADC values due to increased marrow fat which is responsible for water movement restriction. In diseased vertebra there will be increased ADC values compared to normal vertebra. ADC values increases immediately after the treatment in responders which is followed by normal or low ADC values. Increased ADC value after treatment is due death of the tumoural/infective cells leading to increased interstitial oedema. This is followed by fatty marrow replacement in these areas and hence there is decrease in ADC values [10].
In this prospective study, we evaluated the hypothesis that DWI with ADC values play a role in distinguishing benign from pathological vertebral collapse and metastasis from multiple myeloma. We aimed to quantify and evaluate the role of DWI MRI and ADC values in various vertebral pathologies and to establish sensitivity and specificity in distinguishing benign from malignant lesions by using optimal cut-off ADC values.
Materials and Methods
This was a prospective study conducted from June 2015 to May 2017 in Kasturba Medical College-Mangalore, Karnataka, India, with prior ethical committee approval. The study includes 45 adult patients (15 women, 30 men) in the age groups of 18 to 80 years who were referred to the Department of Radiodiagnosis with a previous radiograph demonstrating vertebral collapse. Patients who were referred within four weeks of onset of clinical symptoms were selected in the study. Informed consents were obtained from the patients.
The study was carried out on a 1.5T MRI machine (MAGNETOM Avanto; Siemens) using a standardised protocol on a phased-array spinal coil. Cardiac gating/respiratory triggering was not used. All the patients were subjected to conventional MRI sequences in sagittal plane which include T1 turbo spin-echo (TSE), T2 TSE, STIR (sagittal/coronal plane) sequences and Post contrast fat supressed T1 as optional sequence [Table/Fig-1].
MRI parameters for conventional and DWI sequences.
| Parameter | Conventional sequences | DWI sequence |
|---|
| Slice thickness (mm) | 4 mm | 4 mm |
| TR/TE | T2-3500/103; T1-703/11; STIR-3500/78; T1-FS post contrast-530/11. | 3800/82 |
| Matrix size | 384×384 | 92×180 |
| FOV | 330 | 350 |
DWI was carried out using Single Shot Echoplanar Imaging (SS-EPI) in sagittal plane with a minimum of two b-values. The max b-value used was b 600. Images were acquired using Generalised Auto-Calibrating Partially Parallel Acquisitions (GRAPPA) with an acceleration factor of 2. Sensitising diffusion gradients were applied sequentially in the x, y, and z directions. The total scan time for DWI sequence was 3 min 37 sec. ADC maps were generated with the software supplied by manufacturer on a pixel by pixel basis from the DWI. ROI were defined in areas with abnormal signal intensity on max b-value DWI and copied to the ADC map. ROI was also placed on the normal vertebra.
Statistical Analysis
Quantitative analysis was done using SPSS version 17. Diagnostic test sensitivity and specificity was obtained. Receiver Operating Characteristic (ROC) analysis curve was performed. We performed unpaired t-test to evaluate our hypothesis that ADC values have a role to distinguish benign from pathological collapse and metastasis from multiple myeloma. When p-values were <0.05, the results were taken as statistically significant.
Results
The study comprised of 45 adult patients of which 12 cases (26.7%) were benign collapse and 33 cases (73.3%) were pathological collapse. Thoracolumbar vertebrae were involved in majority of our patients (80%) who presented with low back pain and lower limb weakness. We excluded cases of spondylodiscitis and chronic benign collapse.
In benign collapse, eight cases (66.6%) were due to osteoporotic compression fractures and four cases (33.4%) were due to acute traumatic collapse. The mean age for osteoporosis compression fracture was 72 years, ranging from 65 to 78 years. Traumatic group mean age was 36 years, ranging from 18 to 51 years. Patient was subjected to biopsy/surgery because of their atypical conventional imaging features/need for surgical stabilisation.
Pathological collapse which included 10 cases (30.3%) of multiple myeloma and 23 cases (69.7%) of metastatic compression fractures. The mean age in multiple myeloma group was 53 years and in metastasis group was 52 years [Table/Fig-2]. In the myeloma subgroup, six cases were histopathologically proven and remaining four were diagnosed by protein electrophoresis. In metastatic group, 10 cases (43.5%) were known cases of malignancies while the other 13 cases (56.5%) presented directly with pathological vertebral collapse. These patients finally underwent biopsy which proved to be metastasis. Most common metastasis was from carcinoma lung (25.8%), prostate (18.8%), breast (18.8%) and kidneys (14.1%). Rest includes metastasis from malignancies of large bowel, tongue, parotid gland, ovary and hepatocellular carcinoma.
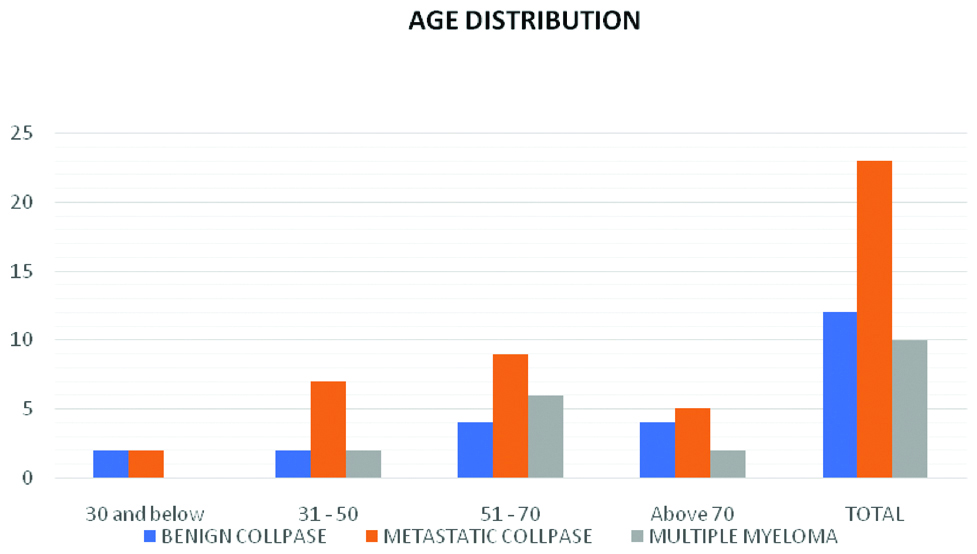
Bar diagram showing age distribution in all three different subgroups.
Benign collapse due to osteoporosis, metastatic collapse and multiple myeloma are seen predominantly in the age groups of 51-70. Benign collapse in the age group 30 and below and 31-50 is due to traumatic aetiology.
Qualitative assessment was done by comparing diffusion images with ADC maps to look for the presence or absence of diffusion restriction in a collapsed vertebra. True diffusion restriction cases showed high signal intensity on DWI and corresponding low signal intensity on ADC maps. Quantitative assessment was done by placing at least two ROI in areas with abnormal signal intensity on max b-value DWI and copied to the ADC map. ROI were also placed in the marrow of normal vertebra to calculate their mean ADC values.
Mean ADC (±SD×10-3 mm2/s) in normal vertebral marrow was 0.285±0.075, ranging from 0.22 to 0.35. Mean ADC (±SD×10-3 mm2/s) in benign collapse was 1.466±0.325. Mean ADC (±SD×10-3 mm2/s) in pathological collapse was 0.959±0.288. By applying ROC curve analysis [Table/Fig-3] and unpaired t-test we found that our hypothesis was correct for benign and pathological collapse (p<0.005) and incorrect for metastasis and multiple myeloma (p>0.005) [Table/Fig-4,5]. The cut-off ADC (×10-3 mm2/s) to distinguish benign from pathological collapse was 1.176 with a sensitivity and specificity of 91.7% and 87.9% respectively [Table/Fig-6].
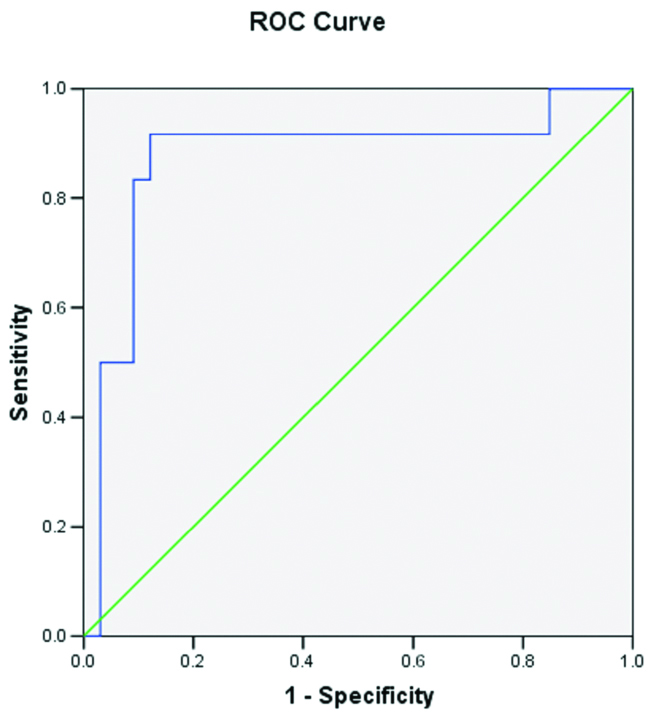 |
| Area Under the Curve |
| Test Result Variable(s): ADC VALUES |
| Area | Std. Error | p-value | Asymptotic 95% Confidence Interval |
| Lower Bound | Upper Bound |
| 0.874 | 0.072 | <0.001 | 0.733 | 1.015 |
Mean ADC with standard deviation in benign and pathological collapse.
| N | Mean | Standard Deviation | 95% Confidence Interval for Mean | t-value | p-value |
|---|
| Lower Bound | Upper Bound |
|---|
| Benign collapse | 12 | 1.466 | 0.325 | 1.260 | 1.672 | 5.053 | <0.001 |
| Pathological collapse | 33 | 0.959 | 0.288 | 0.857 | 1.061 |
| Total | 45 | 1.094 | 0.371 | 0.983 | 1.206 |
Data from the table shows p-value <0.05. So, these results were statistically significant.
Mean ADC with standard deviation in metastatic collapse and multiple myeloma.
| N | Mean | Standard Deviation | 95% Confidence Interval for Mean | t-value | p-value |
|---|
| Lower Bound | Upper Bound |
|---|
| Metastatic collapse | 23 | 0.970 | 0.237 | 0.867 | 1.072 | 0.310 | 0.759 |
| Multiple myeloma | 10 | 0.936 | 0.395 | 0.653 | 1.218 |
| Total | 33 | 0.959 | 0.288 | 0.857 | 1.061 |
Data from the table shows p-value >0.05. So, these results were statistically insignificant.
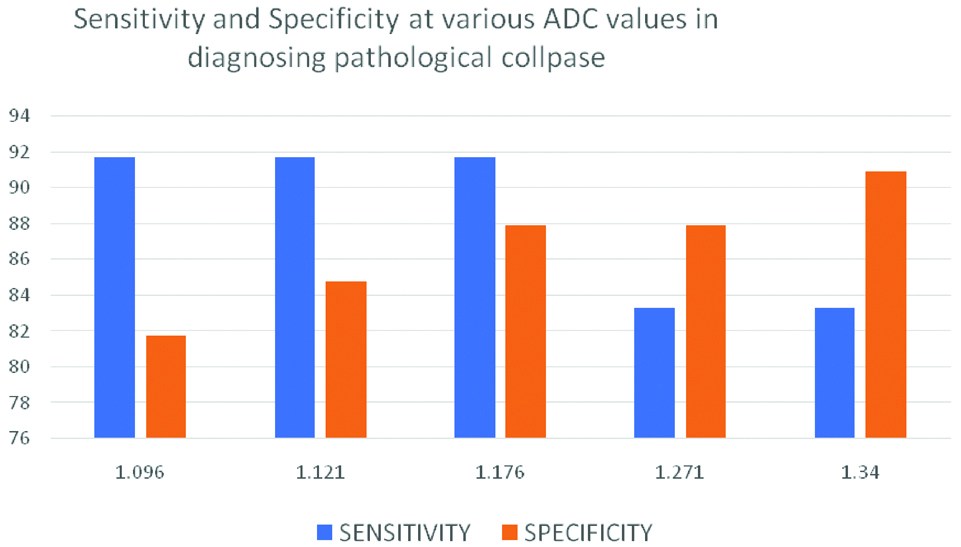
Sensitivity and specificity at various ADC values.
By using an optimal cut-off ADC value of 1.176×10⁻³ mm2/s, to distinguish pathological collapse from acute benign collapse, sensitivity was 91.7% and specificity was 87.9%.
In our study we found that two cases of metastatic collapse from ovarian carcinoma and carcinoma tongue showed ADC values of 1.5×10⁻³ mm2/sec and 1.435×10⁻³ mm2/s respectively. These values were higher than our cut-off. These were taken as false negative cases.
Discussion
Spinal DWI is peculiar because the normal fatty marrow of vertebra shows significant low ADC values and diffusion restrictions. This is unlike in any other part of the body where the background shows low ADC values. Many studies support this observation and is explained by low proton density and hydrophobic fat. So, any pathology (Benign or Malignant) show less diffusion restriction and more ADC values than the normal vertebra [10].
In our study, we used b-values of 0 and 600 in the sagittal plane. Unlike in brain, b-values in spine are different from place to place. DWI with low b-values gives good Signal to Noise Ratio (SNR) but high b-values provide accurate lesion detection [11].
We conducted our study with an intermediate b-value of 600 which gave us a reasonable SNR and ADC maps. Time duration to perform DWI in our study was 3 min 37 sec. Though multiple b-values give good SNR and accurate ADC values, scan times are prolonged and any movement during this time period can lead to motion artefacts.
Mean ADC values (×10-3 mm2/s) in normal vertebrae of benign and pathological groups were 0.22-0.35. Our results were similar to Herneth AM et al., who demonstrated ADC values in normal healthy vertebrae as 0.2-0.5×10⁻³ mm2/s [10].
Acute benign collapse showed mean ADC of 1.466±0.325×10⁻³ mm2/s and pathological collapse showed a mean ADC of 0.959±0.288×10⁻³ mm2/s. In benign collapse, qualitative analysis with a maximum b-value of 600 showed five cases with isointense signal on DWI and five cases with subtle hyperintense signal. Corresponding ADC maps showed hyperintense signal in all the cases. The reason for subtle hyperintense signal on DWI is because of T2 shine through effect.
Representative case of osteoporotic collapse showing atypical conventional findings with DWI and ADC values is shown in [Table/Fig-7]. Our results are comparable with Chan JHM et al., Sung JK et al., who showed higher ADC values in benign collapse compared with metastatic collapse [8,12]. Bhugaloo A et al., studied DWI in spine using low b-values of 165 s/mm2 and showed variable result in comparison with our study as well as with other studies. According to their study the mean ADC (×10-3 mm2/s) in benign group was low compared to malignant groups (0.96 and 1.73) [13]. The possible reason is due to very low b-value of 165 s/mm2. The results of Castillo M et al., with similar low b-value of 165 are also in contrast with our study. They showed that DWI has no added advantage over conventional T1 sequence of Non contrast MRI in the detection of vertebral metastases [14]. Study by Pozzi G et al., also showed different results compared to our study. With a max b-values of 800 s/mm2, mean ADC (±SD×10-3 mm2/s) in malignant group was 1.241±0.4 and in osteoporosis group was 0.646±0.3 [15]. The possible explanation for benign group showing low ADC values is because the study population included benign fractures of more than six weeks duration.
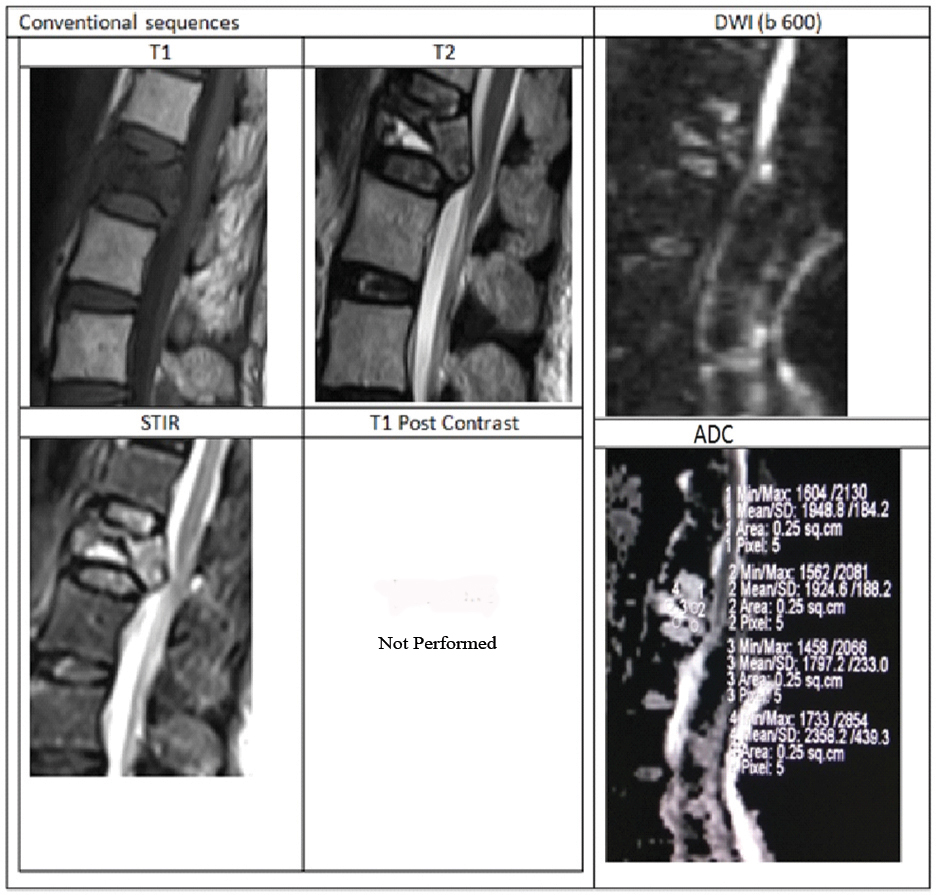
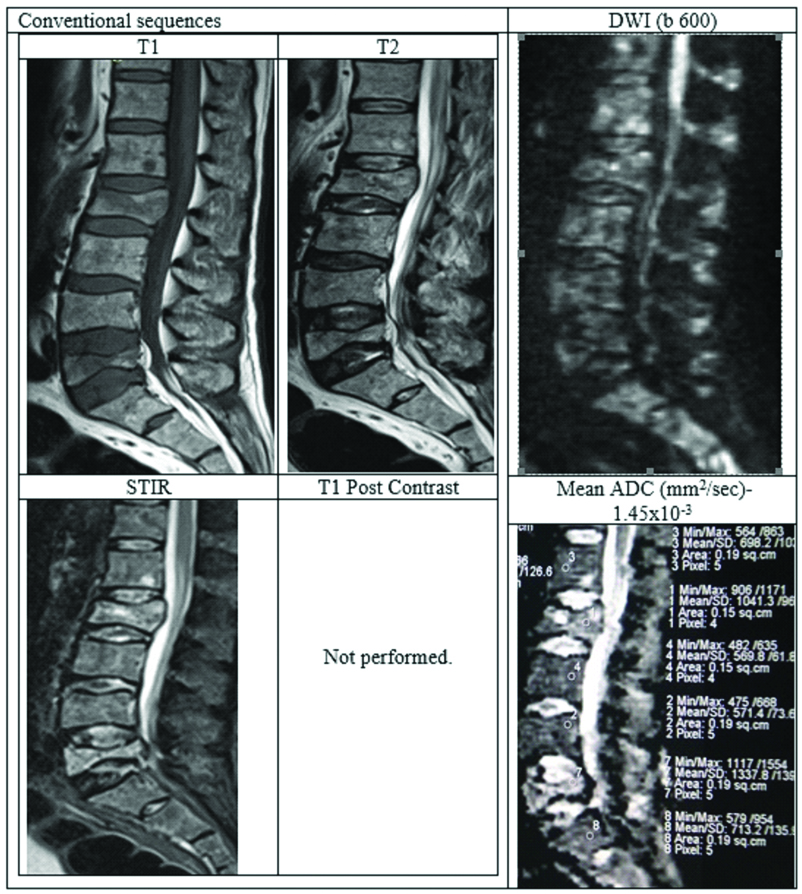
Case of acute osteoporotic compression fracture.
A 78-year-old female presenting with history of trivial fall at house and acute back pain. MRI with DWI showed wedge compression fracture of L1 vertebral body with hypointense marrow signal on T1WI, heterogenous signal on T2WI. STIR images showing hyperintensity with fluid sign (Triangular hyperintensity in the collapsed vertebra). There is retropulsion with posterior convexity in the body of collapsed vertebra compressing the thecal sac and indenting conus medullaris, thus mimicking a malignancy.
DWI showed patchy areas of hyperintense signal but corresponding ADC map reveal no corresponding hypointensity. Mean ADC value in the collapsed vertebra was 1.815×10⁻³ mm2/sec suggesting benign collapse. Finally, patient underwent surgery to relieve cord compression. HPE analysis from the fracture fragments showed no evidence of malignant cells.
Our results are comparable with Biffar A et al., study. They evaluated DWI with four b-value of 100, 250, 400 and 600 s/mm2. Cut-off ADC to differentiate between benign and malignant group was 1.12×10⁻³ mm2/s in EP-DWI and 1.49×10⁻³ mm2/s in ssTSE-DWI with an accuracy of 0.77 and 0.67 respectively [16]. In our study (EPI-DWI), cut-off ADC value to distinguish pathological collapse from acute benign collapse was 1.176×10⁻³ mm2/sec (sensitivity-91.7%, specificity-87.9%). Plank C et al., used b-values of 700 s/mm2 in their study and they established a cut-off of metastatic lesions as 1.05×10⁻³ mm2/s [17].
In our study, we had 23 cases of metastatic collapse and 10 cases of myeloma. Conventional images showed no specific characteristics for metastasis and myeloma groups. Metastasis from Ca prostate showed lower mean ADC value (0.490-0.726). In our study, we had four cases of ca prostate with a mean ADC of 0.62×10⁻³ mm2/s. This is the lowest mean ADC value among the metastasis. The same results are observed by Hasan DI et al., [18]. Statistical analysis between different subgroups of metastatic collapse showed no statistical significance.
Multiple myeloma is the most common primary malignant neoplasm. It is due to abnormal proliferation of plasma B cells leading to marrow infiltration. Diagnosis requires pathological, biochemical and radiological evaluation. In the new guidelines proposed by IMWG (International Myeloma Working Group) MRI findings are also included. True abnormality is considered when the size of lytic lesion is more than 5 mm [19].
In multiple myeloma the marrow cells are replaced by tumour cells which lead to diffusion restriction. ADC values of multiple myeloma are higher than normal bone marrow. MRI and DWI is helpful in assessing the tumoural burden in multiple myeloma. It also has a role in assessing treatment response [20].
Multiple myeloma lesions appear T1 hypointense, T2 hypointense and STIR hyperintense. In DWI the lesions appear hyperintense and by calculating ADC values it is possible to asses’ treatment responders from non-responders.
The mean (±SD) ADC value in multiple myeloma was 0.936±0.395×10⁻³ mm2/s whereas mean ADC in metastatic compression fractures was 0.970±0.237×10⁻³ mm2/s. Representative cases of multiple myeloma and metastatic collapse with their ADC values were shown [Table/Fig-8,9]. Though ADC was significantly lower when compared with benign compression fractures, But ADC values showed no statistically significant difference when compared with metastatic fracture (p>0.05).
Case of multiple myeloma.
A male patient aged 71 years presented with back pain. Radiograph showed multiple collapsed vertebrae with osteopenic changes. Lab investigations showed raised ESR. MRI LS-spine with whole spine screening was asked. Diagnostic possibility of Myeloma/Metastasis was given. Later, it was histopathologically confirmed as multiple myeloma.
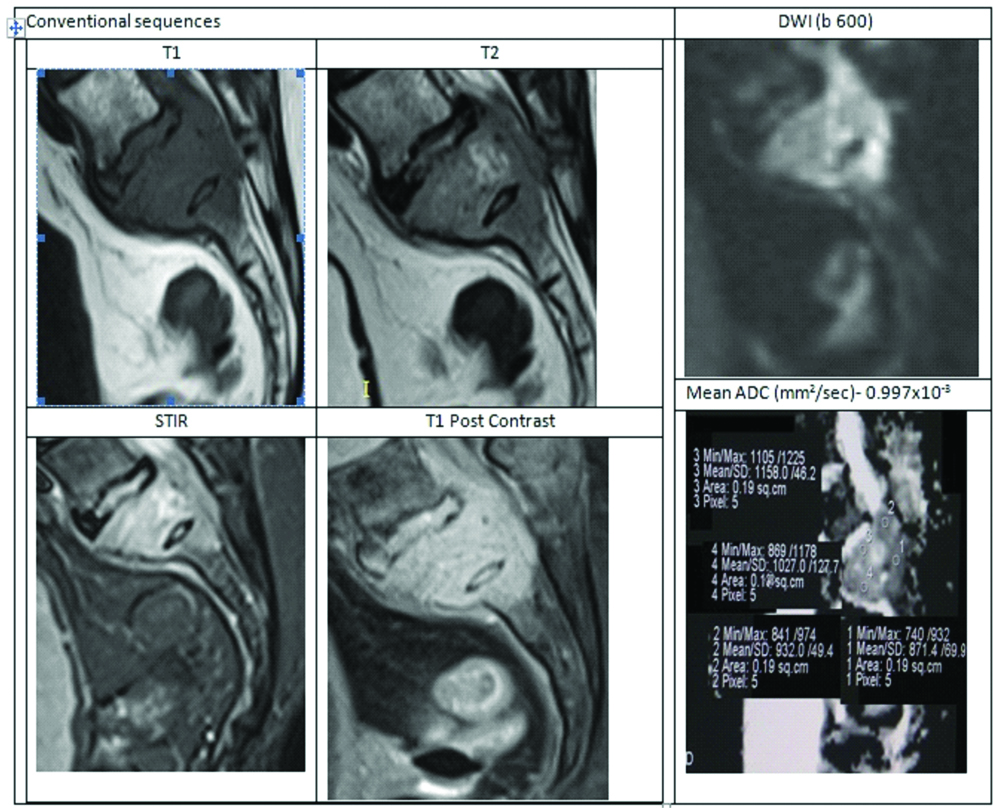
Case of Metastasis from Ca Breast.
A 56-year-old female who is a known case of Ca breast. She presented with neurogenic bladder and paraparesis. MRI LS-spine with contrast done. MRI showed partial collapse of S1 vertebra with T1 hypointense, T2 isointense marrow signal intensity associated with an epidural soft tissue component compressing the filum terminale nerve roots. DWI images show significant diffusion restriction with hypointense signal on ADC. Mean ADC in this case was 0.997×10⁻³ suggesting metastasis.
With this result we can conclude that DWI is not helpful in differentiating metastasis and myeloma. So, to distinguish metastasis and myeloma, other ancillary tests should be performed.
We also had two false negative cases, one is metastasis from carcinoma ovary [Table/Fig-10] and other is metastasis from carcinoma tongue. In these two cases conventional imaging is suggestive of pathological collapse, but ADC values were on the higher side (1.5 and 1.4×10⁻³ mm2/s). So conventional imaging is a must and DWI should be an add-on sequence.
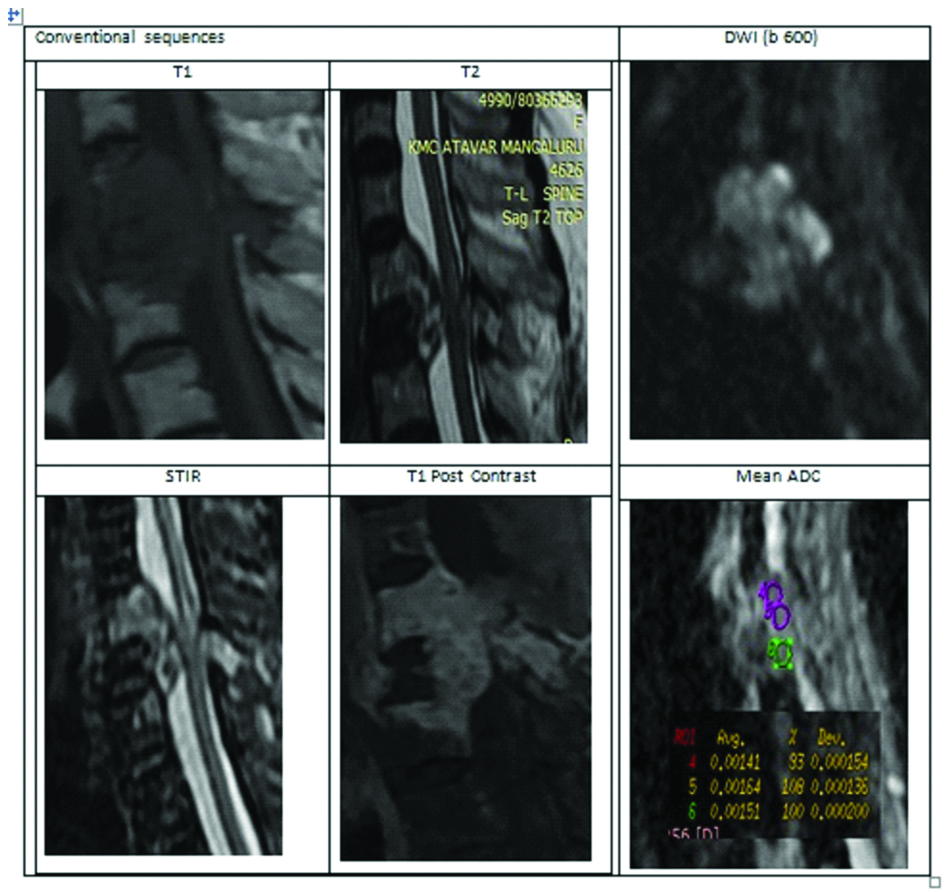
A case of ovarian metastasis-False negative on DWI.
This is a case of 70-year-old female who is a known case of carcinoma ovary. Heterogeneously enhancing altered signal intensity lesion involving D1-D3 vertebral body and posterior elements of D2 vertebra. There is an adjacent soft tissue epidural and paravertebral component compressing the cord. Conventional imaging findings are in favour of metastasis. But, DWI images also showed diffusion restriction. Mean ADC value was 1.5×10⁻³ mm2/sec. Higher ADC value created a diagnostic dilemma, and this was finally proved histopathologically as metastasis.
Limitation
1) Sample size of acute osteoporotic collapse group was small.
2) Imaging was done only with two b-values, so poor SNR in our ADC maps.
Conclusion
DWI is a novel technique in spinal pathologies. DWI with ADC values has a considerable importance in distinguishing acute benign collapse from pathological collapse, but there is a significant overlap between metastatic collapse and multiple myeloma. To avoid false negative and false positive cases in DWI, prior conventional imaging is a must. Hence, we conclude that DWI and ADC mapping should be a routine sequence in a patient with collapsed vertebra because early, accurate diagnosis and tissue characterization is crucial for successful management and can even decrease the number of biopsies.
Data from the table shows p-value <0.05. So, these results were statistically significant.
Data from the table shows p-value >0.05. So, these results were statistically insignificant.