The World Health Organisation (WHO) defines stroke (previously known as cerebrovascular accident or CVA) as rapidly developing clinical symptoms and/or signs of focal and at times global (applied to patients in deep coma and those with subarachnoid haemorrhage) loss of brain function, with symptoms lasting more than 24 hours or leading to death, with no apparent cause other than that of vascular origin. About 85% of all first ever stroke are ischaemic, 10% are due to primary intracerebral haemorrhage and 5% are due to subarachnoid haemorrhage.
Stroke is a major healthcare issue worldwide with an incidence comparable to coronary events, highlighting the importance of understanding risk factors for stroke and subsequent mortality. Stroke is the third most common cause of death in developed nations after ischaemic heart disease and cancer [1]. The prevalence rate of stroke in India is about 1.54 per 1000 and death rate 0.6 per 1000 [2]. Advanced age, hypertension, diabetes mellitus, smoking and atrial fibrillation have been found to be risk factors for stroke and relevant mortality in prospective studies [3].
Medical management of stroke focuses on the prevention of sub-acute complications of stroke like malnutrition, aspiration pneumonia, electrolyte disturbances, bowel or bladder dysfunction, Deep Vein Thrombosis (DVT), pulmonary embolism, contractures, joint abnormalities and skin breakdown [4].
Complications such as seizure or death in stroke may be due to electrolyte disturbances resulting from Syndrome of Inappropriate Antidiuretic Hormone (SIADH) or Cerebral Salt Wasting (CSW), elevation of Brain Natriuretic Peptide (BNP), inappropriate fluid intake or loss [5,6]. Most common clinical presentation in haemorrhagic stroke is headache and vomiting [7]. Vomiting is an important cause of dyselectrolytaemia. In acute phase, complications like dyselectrolytaemia are more common [6]. This electrolyte imbalance may lead to shift of extracellular fluid to intracellular fluid, ultimately causing brain oedema. These changes in electrolytes and water concentration can result in severe complications.
Serum electrolytes can be easily measured in emergency service settings. Studies describing electrolyte status in CVA are rare in western Odisha. If they are estimated and corrected in early phase; patients will have a better prognosis. This study was therefore undertaken to observe the changes in serum electrolyte levels in CVA patients and to find any relation with other biochemical parameters and type of stroke.
Materials and Methods
The present study was undertaken in the Department of Biochemistry, VSS Institute of Medical Sciences and Research (VIMSAR), Burla, Odisha, India, on diagnosed cases of acute stroke, admitted to the Department of General Medicine, during the period of September 2013 to August 2015 (two years). It was a retrospective case control study and included a total of 60 clinically diagnosed and Computed Tomography/Magnetic Resonance Imaging (CT/MRI) proven acute stroke patients (ischaemic/haemorrhagic) in the age group of 40-70 years. Control group consisted of 50 age and sex matched normal healthy individuals.
Pregnant females, patients receiving dialysis for Chronic Renal Failure (CRF), patients with severe hyperglycaemia (>300 mg/dL), hyperlipidaemia, persons receiving medications altering serum electrolytes including anti-hypertensives, cases of subarachnoid haemorrhage, convulsive disorder, and patients with liver disease were excluded from the study. Patients who did not survive the stroke incident were not included into the study. All procedures performed in studies involving human participants were in accordance with the ethical standards of the institutional and/or national research committee.
Blood pressure was measured by standard sphygmomanometer with right arm in supine position. A structured questionnaire was used to obtain data on family history of diabetes and/or hypertension, past and present illness, dietary pattern, addiction, and medication. Approval from the ethical committee was obtained before the study and informed consent was obtained from participants or their relatives. Patients admitted within 48 hours of the onset of stroke were enrolled for this study and at the same time samples were collected for assessment. Samples were analysed immediately without any delay. Association of electrolyte imbalance among stroke patients were identified and correlated.
Anthropometric parameters like height (cm), weight (kg), and Body Mass Index (BMI) was calculated during the time of admission and blood pressure was taken in normal supine posture three times and the mean was used. Biochemical parameters like fasting blood glusose (FBG) and lipid profile (Total cholesterol, Triglyceride, HDL) were estimated in all subjects as per standard guidelines [8-11]. The estimation was done by the help of semi-automated Biochemical Analyser (ACCULAB-AT-112+) using marketed kits. (ACCUREX Diagnostics). Serum electrolytes were estimated by direct Ion Selective Electrode (ISE) method enlite series electrolyte analyser (Accurex biomedical pvt., ltd.,) [12]. Hyponatraemia and hypocalcaemia were considered if serum levels of sodium and calcium were <135 mEq/L and 8.7 mg/dL respectively. All data were collected in case record form. Association between variables were determined using Microsoft Excel. Correlation between parameters was analysed using the Statistical Package for the Social Sciences (SPSS) version 20 software.
Results
The study comprised of 60 diagnosed cases of clinically and CT/MRI proven acute stroke patients (ischaemic/haemorrhagic) and 50 age and sex matched normal healthy persons as control [Table/Fig-1,2].
Age and sex distribution of the groups studied.
| Age Groups (yrs) | Controls (n=50) | Cases (n=60) |
|---|
| Male | Female | Total (%) | Male | Female | Total (%) |
|---|
| 40-50 | 5 | 3 | 16% | 6 | 2 | 13.33% |
| 51-60 | 10 | 8 | 36% | 12 | 6 | 30% |
| 61-70 | 19 | 5 | 48% | 23 | 11 | 56.67% |
Distribution of cases according to the type of stroke.
| Type | No. of Cases | Percentage |
|---|
| Ischaemic | 37 | 61.67% |
| Haemorrhagic | 23 | 38.33% |
Mean age for controls was 58.88±8.12 and for cases it was 59.78±7.64 (p>0.05). BMI for controls was 21.98±2.25 kg/m2 and for cases was 25.51±3.08 kg/m2 (p<0.0001). Systolic blood pressure in the controls was 124.76±10.37 mm Hg and for cases was 174.13±17.68 mm Hg (p<0.0001). Diastolic blood pressure in the healthy controls was 80.21±3.13 mm Hg and for cases was 99.33±7.99 mm Hg (p<0.0001) [Table/Fig-3].
Clinical parameters in the groups studied.
| Parameters | Controls (n=50) | Cases (n=60) | p-value |
|---|
| Mean±SD | Range | Mean±SD | Range |
|---|
| Age (Years) | 58.88±8.12 | 40-70 | 59.78±7.64 | 41-70 | >0.05 |
| BMI (kg/m2) | 21.98±2.25 | 19.6-24.8 | 25.51±3.08 | 24.8-30.2 | <0.0001 |
| SBP (mm Hg) | 124.76±10.37 | 110-136 | 174.13±17.68 | 146-176 | <0.0001 |
| DBP (mm Hg) | 80.21±3.13 | 75-89 | 99.33±7.99 | 91-116 | <0.0001 |
Fasting blood sugar in controls was 86.36±8.21 mg/dL as compared to the cases 88.08±9.36 mg/dl, but it was statistically not significant (p>0.05). Statistically significant (p<0.05) difference was seen for Serum urea in controls (33.94±5.51 mg/dL) and cases (39.72±18.34 mg/dL). Serum creatinine in controls was 0.98±0.23 mg/dL and for cases 1.54±0.71 mg/dL. The difference was statistically significant (p<0.0001) [Table/Fig-4].
Comparison of biochemical parameters in study groups.
| Parameters (mg/dL) | Controls (n=50) | Cases (n=60) | p-value |
|---|
| Mean±SD | Range | Mean±SD | Range |
|---|
| FBS | 86.36±8.21 | 70-104 | 88.08±9.36 | 70-120 | p>0.05 |
| Urea (mg/dL) | 33.94±5.51 | 22-44 | 39.72±18.34 | 21-78 | <0.05 |
| Creatinine (mg/dL) | 0.98±0.23 | 0.5-1.4 | 1.54±0.71 | 0.5-3.1 | <0.0001 |
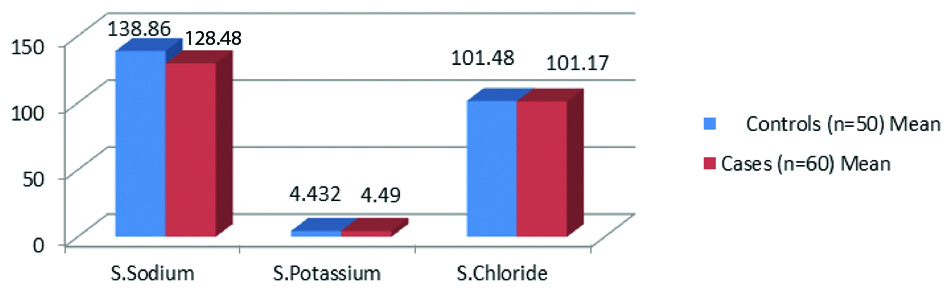
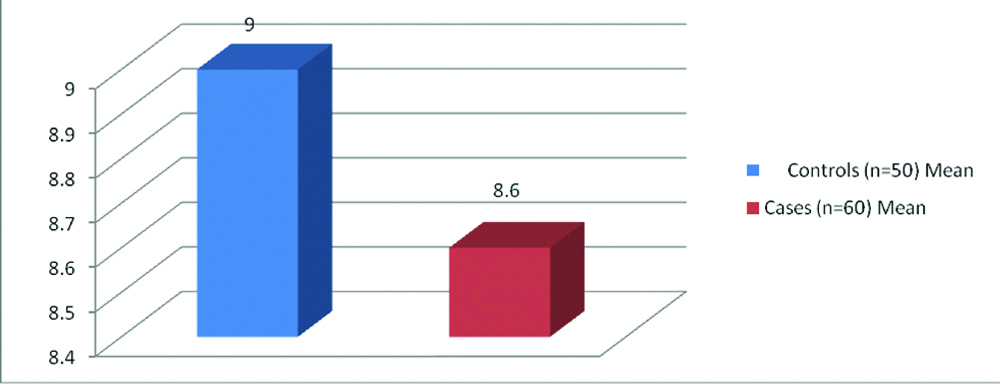
[Table/Fig-5,6 and 7] shows that serum sodium in controls was 138.86±7.28 mEq/L with a range of 125-146 mEq/L and for cases 128.48±4.61 mEq/L with a range of 122-146 mEq/L. Serum sodium was lower in cases as compared to the controls which was statistically significant (p<0.0001). Serum potassium in controls was 4.432±0.51 mEq/L and for cases 4.49±0.55 mEq/L. The difference was statistically not significant (p>0.05). Serum chloride level in controls was 101.48±4.25 mEq/L and for cases 101.17±3.81 mEq/L. The difference was statistically not significant (p>0.05). Serum calcium level in controls was 9.00±0.53 mg/dL and for cases 8.6±0.46 mg/dL. [Table/Fig-8] shows that serum sodium was positively correlated to serum urea in suspected SIADH cases and negatively correlated to serum urea in suspected CSWS cases, which was statistically significant.
Comparison of serum sodium, potassium and chloride in study groups.
| Parameters | Controls (n=50) | Cases (n=60) | p-value |
|---|
| Mean±SD | Range | Mean±SD | Range |
|---|
| S.Sodium (mEq/L) | 138.86±7.28 | 125-146 | 128.48±4.61 | 122-146 | <0.0001 |
| S.Potassium (mEq/L) | 4.432±0.51 | 3.4-5.3 | 4.49±0.55 | 3.2-5.4 | >0.05 |
| S.Chloride (mEq/L) | 101.48±4.25 | 96-110 | 101.17±3.81 | 94-110 | >0.05 |
| S.Calcium (mg/dL) | 9.00±0.53 | 8.1-10 | 8.6±0.46 | 7.5-9.3 | <0.0001 |
Comparison of serum sodium, potassium and chloride in study groups (bar graph).
Comparison of serum calcium in study groups.
Correlation of serum urea with serum sodium in suspected SIADH and CSWS cases.
| Correlation coefficient | SIADH | CSWS |
|---|
| r-value | 0.944 | -0.842 |
| p-value | <0.001 | <0.01 |
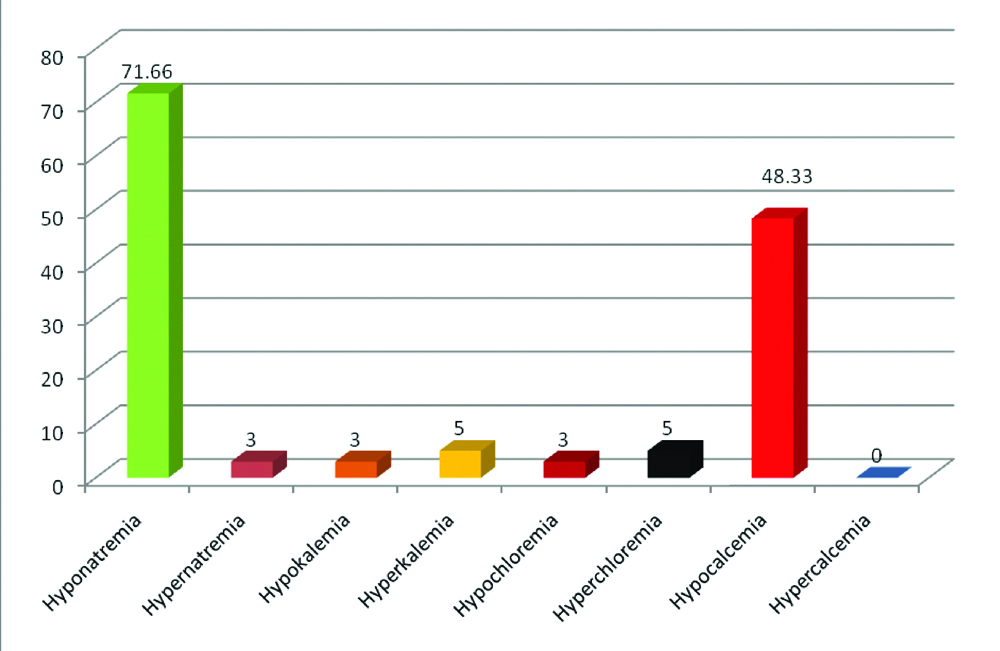
[Table/Fig-9,10] show 71.66 % of stroke patients had hyponatraemia. Hyponatraemia was common among haemorrhagic group and only 3.33% of patient presented with hypernatremia. Total 5% of patients had hyperkalaemia and only 3.33% had hypokalaemia. Total 3.33% of patients had hypochloraemia and 5% had hyperchloraemia. Total 48.33% of patients had hypocalcaemia. No patient presented with hypercalcaemia.
Association of various type of dyselectrolytaemia in different type of stroke.
| Type of dyselectrolytemia | Haemorragic stroke (n=23) | Ischaemic stroke (n=37) | Total n=60 (%) |
|---|
| Hyponatremia | 20 (86.96%) | 23 (62.16%) | 71.66 |
| Hypernatremia | 1 (4.35%) | 1 (2.70%) | 3.33 |
| Hypokalemia | 2 (8.70%) | 0 (0%) | 3.33 |
| Hyperkalemia | 2 (8.70%) | 1 (2.70%) | 5 |
| Hypochloremia | 1 (4.35%) | 1 (2.70%) | 3.33 |
| Hyperchloremia | 2 (8.70%) | 1 (2.70%) | 5 |
| Hypocalcemia | 5 (21.74%) | 24 (64.86%) | 48.33 |
| Hypercalcemia | 0 (0%) | 0 (0%) | 0 |
Percentage of various type of dyseletrolytaemia in different type of stroke.
Discussion
The prevalence of acute stroke in developed countries has reached immense proportions which represent a major problem and its incidence is also increasing day by day in developing countries. The present study, including 60 cases, and 50 healthy controls aimed to assess the frequency of dyselectrolytaemia among stroke patients, an important prognostic factor of acute stroke. The study also correlated changes in some blood parameters according to stroke type.
In our study 13.33% of the cases (acute stroke) were in the 40-50 year age group whereas 30% of cases were in the 51-60 years age group and 56.67% of the cases were in the 61-70 years of age group. Maximum numbers of male and female were also in this age group. Out of 60 cases 41 (68%) were males and 19 (32%) were females. These findings corroborate with a study done by Deoke A et al., [13].
Different types of the stroke patients selected for this study were categorised into ischaemic or haemorrhagic groups. The maximum number of cases was that of ischaemic group i.e., 61.7% followed by haemorrhagic group i.e., 38.3%. Our study is very close to Siddiqui MR et al., [14] which showed that 53% patients had ischaemic stroke and 45% had haemorrhagic stroke.
The mean BMI of cases (25.51±3.08 Kg/m2) was significantly higher than the controls (p<0.0001), very much similar to study done by Deoke A et al., [13]. Systolic and diastolic blood pressure was more in cases than controls and the difference was statistically significant (p<0.0001). In middle and late adult life, hypertension is undoubtedly the strongest modifiable risk factor for both ischaemic and haemorrhagic stroke O’ Donell MJ et al., [15]. Hypertension is present in approximately 70% of stroke cases.
A statistically significant difference was seen for serum urea (p<0.05) and creatinine (p<0.0001) for cases and control. These observations are consistent with a study conducted by Kavalci C et al., but in that study the difference in urea was more statistically significant (p<0.001) [16]. This is probably due to SIADH in maximum number of cases in this study and SIADH is associated with lower plasma urea levels as a result of a high renal clearance of urea [17]. Plasma urea values <30 mg/dL were seen in 80% of patients with SIADH [18]. Increased creatinine level, as a reflection of impaired renal function, is a good marker for some vascular diseases including stroke [19,20].
In this study, there was a prevalence of hyponatraemia and hypocalcaemia in stroke patients. The incidence of hyponatraemia was more in haemorrhagic group and in ischemic group incidence of hypocalcaemia was more. Approximately 71.66% of stroke patients had hyponatraemia which was very close to the study conducted by Roy KS et al., [21]. Hyponatraemia in stroke is usually either due to SIADH or CSWS [22].
SIADH consists of hyponatraemia, inappropriately elevated urine osmolality, excessive urine sodium and decreased serum osmolality in a euvolaemic patient without oedema. In SIADH, ADH is produced continuously despite body fluid hypotonicity. This leads to expanded effective circulatory volume so that the negative feedback mechanism that normally controls ADH fails and ADH continues to be released. Hyponatraemia in SIADH is due to excess water (dilutional hyponatraemia) and is not primarily due to serum sodium deficiency. It is a combination of water retention together with secondary solute loss, which results in reduction in serum sodium [23].
CSWS is defined by the development of excessive natriuresis and subsequent hyponatraemia, dehydration in patients with intracranial disease. Though many hypotheses have been given, but the exact mechanism of CSWS is not known. CSWS is a centrally mediated process characterised by renal loss of sodium resulting in polyuria, natriuresis, hyponatraemia, and hypovolaemia. The postulated mechanisms include decreased sympathetic input to the kidney or the presence of circulating natriuretic factors such as Atrial Natriuretic Peptide (ANP) or BNP or both [24,25]. Decreased sympathetic tone leads to a decreased Glomerular Filtration Rate (GFR), a decreased renin release and decreased renal tubular sodium reabsorption. The electrolyte imbalances observed in CSWS are similar to that of SIADH; but signs of volume depletion (decreased skin turgor, hypotension or low central venous pressure) with salt wasting are present in CSWS which distinguishes it from SIADH.
Plasma urea and fractional excretion of urea (FEUrea) can be considered here as useful biochemical parameters in the differential diagnosis of salt-depleted hyponatraemia in CSWS and in patients with SIADH [26-28]. Hyponatraemia in SIADH is usually associated with a low plasma urea due to high FEUrea [17], whereas in hyponatraemia that is caused by Salt Depletion (SD), plasma urea usually is increased as a result of an abnormal low FEUrea (prerenal uraemia) [29]. Thus in this study, serum sodium was positively correlated with serum urea in suspected SIADH cases which was statistically significant. Similarly, serum sodium was negatively correlated to serum urea in suspected CSWS cases, which was statistically significant.
Hyponatraemia was seen in 71.66% of stroke patients, which was very close to the study conducted by Roy KS et al., according to which 80% patients had hyponatraemia (serum sodium <135 mEq/L) and only 3.33% of patient presented with hypernatremia. Total 5% of patients had hyperkalaemia and only 3.33% had hypokalaemia. Total 3.33% of patients had hypochloraemia and 5% had hyperchloraemia. Total 48.33% of patients had hypocalcaemia. Hypocalcaemia was common among ischaemic group. No patient presented with hypercalcaemia.
Out of 23 haemorrhagic stroke cases 20 cases (86.96%) had hyponatraemia. Out of 37 ischaemic stroke cases 23 (62.16%) had hyponatraemia. So, it is clear that the haemorrhagic group had higher incidence of hyponatraemia. This is consistent with the study by Siddiqui MR et al., [14].
Sodium being the chief cation in the extracellular fluid, it participates in the regulation of water electrolyte balance and osmotic pressure. Any disturbance in its normal level will lead to fluid exchange or oedema, which affects normal functioning of the brain. These may lead to decreased blood flow to the brain or rupture of blood vessels due to pressure changes.
Out of 23 haemorrhagic stroke cases, 5 cases (21.7%) had hypocalcaemia. Out of 37 ischemic stroke cases, 24 cases (64.9%) had hypocalcaemia. So, we found that the ischaemic group had higher incidence of hypocalcaemia. These observations are consistent with the study conducted by Ganti L et al., [30]. Hypocalcaemia observed in this study can also be explained. In cell death due to CNS ischaemia, there are many mechanisms that take place such as excitotoxicity, oxidative stress, apoptosis and necrotic cell death. Each of these mechanisms is associated with cation entry into neural cells. Uncontrolled entry of calcium into cells triggers necrotic and apoptotic cell death [31]. Calcium influx into the cell via N-Methyl-D-Aspartate (NMDA) receptors is the main pathway for delayed cell death and excitotoxicity associated with ischaemia [31,32].
Conclusion
The results of the present study demonstrated that electrolyte disturbances especially hyponatraemia and hypocalcaemia were highly prevalent in CVA patients. The cause of hyponatraemia may be SIADH or CSWS. Thus, early assessment of electrolyte disturbance is essential to prevent morbidity and mortality and for better prognosis. Also, comparative study between ischaemic and haemorrhagic stroke is required to find type of electrolyte disturbance. This should be clarified by larger population studies.