Malaria is an endemic disease of the tropics, spreading across 109 countries, caused by four different species of the genus Plasmodium [1]. Anopheles mosquitoes are the common vectors, seen in humid areas with ambient temperatures between 20°C to 30°C and approximately 80 species transmit malaria. In the Indian subcontinent Anopheles stephensi is the principle vector which breeds in stagnant water [2]. Increased mortality due to malaria has been a problem for centuries; the Government of India has launched National Malaria Control Program in 1953, which proved to be highly successful [3]. Initially microscopy was the gold standard method for the diagnosis of malaria; alternative methods like malaria antigen detection, fluorescent microscopy, antibody detection and molecular amplification have gained significance [4]. In the present study, a comparison of various diagnostic tools with that of a standard and most sensitive method was done, to understand the significance of the tests which can form a basis for research expansion and appropriately target intervention for elimination of malaria. Evaluation of newer diagnostic tools with most sensitive method is helpful to implement better point of care diagnosis, especially in antigenic variants of Plasmodium species and hypnozoites of Plasmodium vivax. Active case detection and strategies for standardisation of various diagnostic methods are very important in low transmission areas as selected in this study [5]. Microscopy and rapid tests may be more appropriate during high transmission, whereas in asymptomatic infections due to residual immunity, molecular methods like PCR have significant role. ELISA for antibody detection is not of much significance in detecting active infection but may be used as surrogate method in diagnosing relapses due to Plasmodium vivax for ruling out liver stages of parasite [5]. Studies indicate that HRP-2 based assays are more sensitive for detection of Plasmodium falciparum than LDH and aldolase, because PfHRP-2 is released continuously throughout the erythrocytic cycle in large amounts during the rupture of schizont [6]. In endemic regions where relapses are common and species identification is not a priority, antigen detection methods by using immunochromatographic lateral flow strip technology are very useful. Rapid tests are technically simple to perform, easy to interpret and reproduce the results [6].
Advanced techniques such as PCR or ELISA may help to augment the sensitivity of microscopy, which is the gold standard test for the diagnosis of malaria [7]. Even though low parasite densities are reliably detected with HRP-2 ELISA, the biggest challenge is to detect Plasmodium falciparum parasitemia when it is superimposed by Plasmodium vivax, in which case PCR or ELISA are essential for accurate diagnosis [8]. PCR provides the added advantage of species differentiation, whereas it is not possible with ELISA, which is based on antibodies directed against a single antigen [9]. This study was carried out to compare the sensitivity and specificity of various diagnostic methods for malaria in South Chennai and to detect the species that are most commonly transmitted in the selected area.
Materials and Methods
Study Design
This was a prospective study conducted at Chettinad Hospital and Research Institute, Kanchipuram, Chennai, Tamil Nadu, India, from January 2015 to January 2016. The blood samples were collected from patients belonging to all age groups presenting with fever, chills and rigors, from various inpatient and outpatient departments. Patients without fever and not having any other clinical features of malaria were excluded for the study. The Institutional Human Ethics Committee approval was obtained on 12th May 2015 with the register number IHEC/02/12 prior to commencement of the study. Informed consent from the patients was obtained, prior to collection of blood samples and declaration of health records.
Sample Size and Collection
The average prevalence rate of malaria in our area calculated from the previous years (2013 to 2014) was found to be 0.3% in our region. In our study sample size calculation was not given much importance, because it is a comparative study, randomly 100 samples were collected and evaluated with four different methods to diagnose malaria. Capillary blood was collected for microscopy by using small bulb pipette, following aseptic precautions about 3 mL of whole blood was collected aseptically in sterile vacutainer for rapid test, ELISA and PCR.
Microscopy
Blood was collected using a bulb pipette and a small drop of blood was placed in the centre of a clean grease free glass slide and a large drop (15 μL) was placed on its right side, without any delay thick and thin smears were made with both the drops and stained by Leishman’s stain. The stained smears were examined by using light microscope under the 40x and 100x objectives. A minimum of 100 to 200 fields per smear were screened to confirm the presence of malarial pigment, various morphological forms of Plasmodium species inside the RBCs and gametocytes.
Rapid Antigen Detection Method
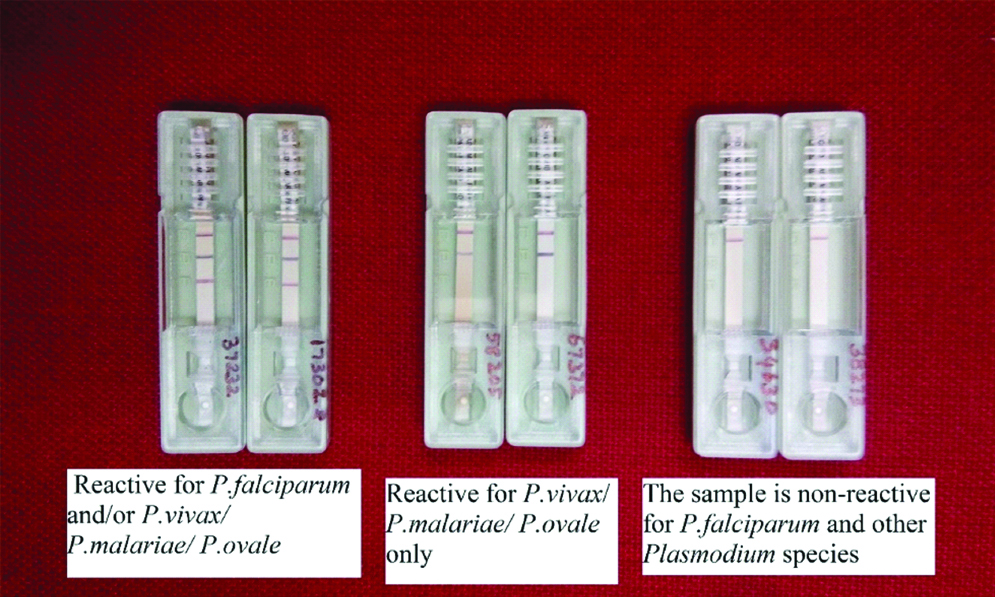
Rapid malaria Pan+Pf cards purchased from J. Mitra & Co Pvt., Ltd., were used. The kits were brought to the room temperature before use. Whole blood was pipetted up to the mark using the sample dropper provided by the kit and dispensed on the sample well S, followed by three drops of buffer to well B, and the results were read after 20 minutes. Appearance of three purple pink coloured lines in the regions of F, P and C indicated that the sample was reactive for Plasmodium falciparum, Plasmodium vivax and other species like Plasmodium malariae and Plasmodium ovale. A two-coloured band at C and F region indicated that the sample was positive for Plasmodium falciparum only, and if the bands were seen on C and P, the sample was considered positive to all other Plasmodium species. Difference in intensity of colour occurs depending on the concentration of pLDH and HRP-2 in the sample between test and control lines [Table/Fig-1]. The test was confirmed as negative if only one band appears on C region even after 20 minutes.
Results of rapid antigen detection method.
ELISA
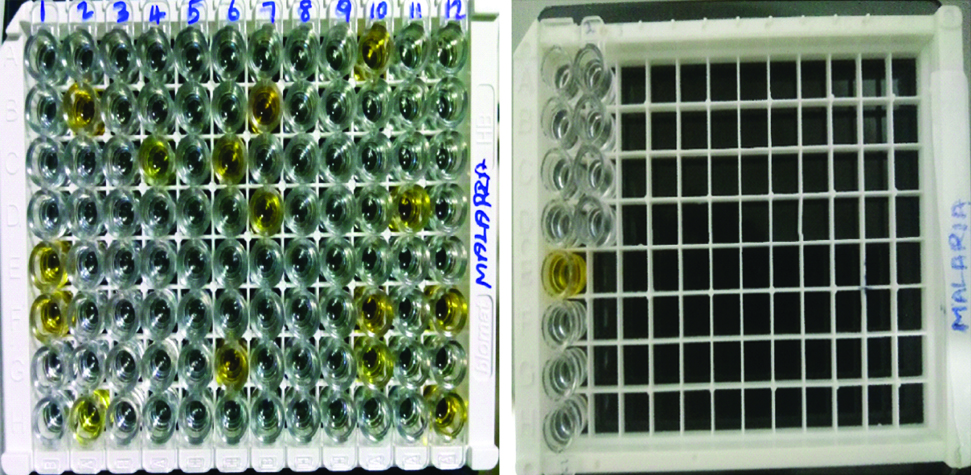
The ERBA LISA PAN (LDH) malaria test kit purchased from TRANSASIA BIO-MEDICALS Ltd., based on the principle of solid phase immunoassay was used in our study for the qualitative detection of pLDH for genus Plasmodium in human blood. ELISA is a genus specific test and the species cannot be differentiated by ELISA. The reagents, the samples and the controls were distributed in the corresponding wells and the procedure was carried out as per the instructions given in the kit insert. About 100 μL of PAN LDH negative controls were added in wells B1, C1 and D1 and positive control in well E1, 10 μL of first sample was added from well F1 onwards and the wells were mixed, covered with strip sealers and incubated at 37°C. This was followed by washing the wells for five times. About 50 μL of the conjugate was added to the wells, mixed, covered and incubated for 30 minutes at 37°C. About 50 μL of coloured reagent was added to all the wells and the plate was covered with black paper and the reaction was left in dark for 15 minutes at room temperature. Finally, 100 μL of stop solution was added to all the wells. The change in colour of the substrate from blue to yellow in the samples was considered reactive and those which remained colourless were considered non-reactive [Table/Fig-2]. Optical densities of the well were read at 450 nm reference wavelength using an ELISA reader, the absorbance values were calculated by deducting the values of blank wells. If the absorbance of test serum was less than the cut-off value, the samples were considered as non-reactive, and if the absorbance of test serum was equal or greater than the cut-off value it is considered as reactive.
ELISA plate showing color change in 16 wells with E1 & E13 as positive controls, F1,B2,H2,C4,C6,G6,B7,D7,A10,F10,G10,D11,F12 and H12 which are positive samples. Wells A1 and A13 are blank, B1,B13,C1,C13,D1 & D13 are negative controls.
Polymerase Chain Reaction
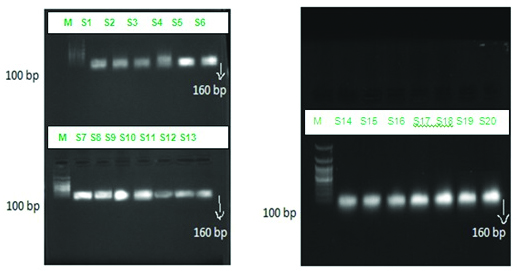
DNA extraction was done as per the procedure mentioned in DNA purification kit (Purefast® Human blood Genomic DNA purification kit). The PCR master mix, agarose gel electrophoresis consumables, primers, positive control and negative controls were procured from Helinibio molecules Chennai, India. Universal primer for detecting the gene 18s rRNA specific for genus Plasmodium was used to test all the 100 samples collected in the present study to assess the sensitivity and to confirm the diagnosis of the samples that were positive by the other three methods. Similar to ELISA, PCR primers used were genus specific and therefore species differentiation could not be made. The forward primer sequence used was CCACATCTAAGGAAGGCAGC and the reverse primer was CACCAGACTTGCCCTCCAA with a product size of 160 bp. About 10 μL of master mix was taken in the PCR vial along with 2.5 μL of forward primers and reverse primers each, and 5 μL of genomic DNA extract from the blood sample. The above mixture was placed in the PCR machine and following reaction was setup, which included an initial denaturation at 94°C for three minutes, followed by 35 cycles of denaturation at 94°C for one minute, annealing at 58°C for one minute and extension at 72°C for one minute. This was followed by a final extension at 72°C for 5 minutes. The products were loaded on to the agarose gel and electrophoresis was run at 50 volts and the bands were observed with the help of ultraviolet transilluminator [Table/Fig-3]. The positive and negative controls were procured from Helini biomolecules.
Gel picture showing bands with product size 160bp for 18s rRNA gene specific for genus Plasmodium for the 20 samples.
Statistical Analysis
Data was analysed by using SPSS package version 16.0, for calculating the sensitivity, specificity, positive and negative predictive values expressed with 95% Confidence Interval. Chi square test was calculated by Microsoft Excel version 2007, One-way ANOVA (Turkey Comparative Test) was calculated by Graphpad prism 4 for p-value estimation was done by comparing with PCR which is the most sensitive method [9].
Results
From a total of 100 samples collected, 71 were males and 29 were females. A total of 15 samples were positive by the three phenotypic methods. Among the 15 samples positive, 12 (80%) were males and 3 (20%) were females [Table/Fig-4]. According to the age wise distribution of positive cases for Plasmodium falciparum and Plasmodium vivax, the p-value among the age group between 21 to 30 years was 0.002 which is significant [Table/Fig-5]. Microscopy was positive in 15 patients (15%), of whom 12 (80%) were Plasmodium vivax and 3 (20%) were identified as Plasmodium falciparum [Table/Fig-6]. Statistical analysis showed 75% sensitivity with microscopy and rapid antigen detection method and 70% sensitivity with ELISA. The specificity and positive predictive values were 100% each for all the above three methods. The negative predictive values for microscopy and rapid antigen method was 94.4% and for ELISA it was 93.5% [Table/Fig-7]. In the age group from 11 to 20 years, comparing with Microscopy, RDT and ELISA Vs PCR showed to be significant (p<0.05). Likewise, in the age group of people between 21 years to 30 years, when compared with Microscopy, RDT and ELISA Vs PCR showed a very high significance (p<0.001) changes [Table/Fig-8].
Gender wise distribution of Plasmodium species by the three phenotypic methods.
| Sex | No of Plasmodium vivax positive | No of Plasmodium falciparum positive | Total positives | Positive % |
|---|
| Males | 9 | 3 | 12 | 80 |
| Females | 3 | 0 | 3 | 20 |
| Total | 12 | 3 | 15 | 100 |
The significance of age wise distribution of positive samples for Plasmodium falciparum and Plasmodium vivax was calculated by chi-square test.
| Plasmodium species comparison among various age groups |
|---|
| Age groups (years) | “p” values | Chi-square |
|---|
| <10 | 0.38 | 1 |
| 11 to 20 | 0.92 | 0.85 |
| 21 to 30 | 0.002 | 0.09 |
| 31 to 40 | 0.07 | 0.29 |
| 41 to 50 | 0.57 | 1 |
| 51 to 60 | 0.27 | 1 |
| 61 to 70 | 1 | 1 |
| 70 and above | 1 | 1 |
Total number of various Plasmodium species positive by different methods for diagnosis of malaria.
| Diagnostic method | Genus Plasmodium | Plasmodium vivax | Plasmodium falciparum | Plasmodium ovale | Plasmodium malariae |
|---|
| Microscopy | 15 | 12 | 3 | 0 | 0 |
| RDT | 15 | 12 | 3 | 0 | 0 |
| ELISA-Genus specific | 14 | - | - | - | - |
| PCR-Genus specific | 20 | - | - | - | - |
Comparison of sensitivities, specificities, PPVs, and NPVs of microscopy, rapid antigen detection method and ELISA with PCR as the standard method in this study.
| Test method | Sensitivity | Specificity | Positive predictive value | Negative predictive value |
|---|
| Microscopy | 75% | 100% | 100% | 94.4% |
| Rapid antigen detection method | 75% | 100% | 100% | 94.4% |
| ELISA | 70% | 100% | 100% | 93.5% |
The significance of age wise distribution of positive samples for by microscopy, RDT, ELISA and PCR was calculated by one-way ANOVA (Turkey Comparitive Test).
| Age group (years) | | Microscopy | RDT | ELISA | PCR |
|---|
| <10 | Mean | 0.667 | 0.667 | 0.667 | 1.000 |
| SD | ±0.577 | ±0.577 | ±0.577 | ±0.000 |
| 11 to 20 | Mean | 3.667 | 3.333 | 2.667 | 5.000 |
| SD | ±0.577 | ±0.577 | ±0.577 | ±1.000* |
| 21 to 30 | Mean | 3.667 | 3.333 | 4.000 | 6.667 |
| SD | ±0.577 | ±0.577 | ±0.000 | ±0.577** |
| 31 to 40 | Mean | 1.667 | 2.000 | 1.667 | 1.333 |
| SD | ±0.577 | ±0.000 | ±0.577 | ±0.577 |
| 41 to 50 | Mean | 0.667 | 0.667 | 1.000 | 0.667 |
| SD | ±0.577 | ±0.577 | ±0.000 | ±0.577 |
| 51 to 60 | Mean | 0.667 | 1.000 | 1.000 | 0.667 |
| SD | ±0.577 | ±0.000 | ±0.000 | ±0.577 |
| 61 to 70 | Mean | 0.667 | 0.667 | 0.333 | 1.000 |
| SD | ±0.577 | ±0.577 | ±0.577 | ±0.000 |
| 70 and above | Mean | 1.000 | 0.667 | 0.333 | 1.000 |
| SD | ±0.000 | ±0.577 | ±0.577 | ±0.000 |
Discussion
The demographic prevalence of Plasmodium falciparum and Plasmodium vivax was estimated by using statistical analysis and the significance was calculated. The percentage of positives was more in males (80%) than females (20%), which could be due to more outdoor work and exposure to more vector bites. The prevalence of malaria was found to be more among younger groups ranging from 10 to 30 years, which can be due to early acquired immunity [10]. Morphological similarities between early developmental stages of malarial parasites belonging to different species and mixed infections are particularly a challenge for microscopy [11]. In mixed infections, species identity by microscopy may be missed, especially in case of Plasmodium vivax infection along with Plasmodium falciparum. Skill, experience of slide reader, quality of smear preparation, staining techniques followed, the quality of microscope, magnitude of parasitaemia and the number of fields studied plays an important role in interpreting microscopic findings [12]. Parasitic LDH and HRP, are released by the intra erythrocytic stages like ring forms, trophozoites and early gametocytes. HRPs are further classified as HRP-1, HRP-2 and HRP-3 in Plasmodium falciparum. These HRPs can be detected even in low parasite densities as much as 0.01%. LDH reflects the presence of metabolically viable parasites and used as prognostic tool during antimalarial therapy. In case of Plasmodium falciparum infections, rapid card test is more accurate when compared to microscopy as it gives more accurate measure of parasite burden when the mature stages are known to be sequestered into various tissues [2]. According to Coleman et al., even though microscopy is the gold standard method, it still showed 10% false negatives, more than 20% false positives with specificity only 70%, making microscopy less appropriate method which may lead to resurgence of the disease due to antimalarial resistance [4]. In our study, the specificity of microscopy was 100%, but the sensitivity was 75%. A similar study was done where PCR was considered as the most sensitive method, the microscopy and rapid diagnostic tests gave lesser sensitivity with 60% and 72.8% respectively, the specificity was 92.5% and 94.3%, correlating with our study [13]. Maltha J et al., evaluated the diagnostic accuracy of PfHRP-2 and PfpLDH detection by using rapid diagnostic tests with that of PCR. A significant variation in results was seen with parasite densities. Antigen detection method showed excellent sensitivities of 100% for PfHRP-2 and 98.7% for PfpLDH followed by negative predictive values of 100% and 99.1% for each, the specificities and positive predictive values were lower for both [14]. Plasmodium species identification by rapid card test has many limitations. HRP-2 is expressed only by Plasmodium falciparum and rapid test with single target antigen detection may prove negative for Plasmodium vivax, Plasmodium ovale and Plasmodium malariae. Some Plasmodium falciparum species may lack both HRP-2 and LDH, during the initial phase of treatment, which may show very low sensitivities by rapid card test. Poor performance of antigen detection kits may also be reflected by regional variation in genetic determinants of parasite specific LDH [9]. PCR is particularly useful in samples with low level parasitemia like five parasites per 1 microlitre (0.0001%) [9]. Imwong M et al., conducted a study in South East Asia, covering countries where malaria is of low transmission, PCR was compared with microscopy and rapid diagnostic tests, which showed a specificity of 100% for both, the positive predictive values ranged from 80% to 100% for microscopy, followed by 60% to 100% for rapid diagnostic tests. The sensitivity was less than 70% for both the methods and even the negative predictive values were ranging from 80% to 98% for both [15]. In our study PCR was considered as the most sensitive method, basing on the statistical analysis the p-value was less than 0.05 which is significant. Considering this the sensitivities of microscopy and rapid antigen detection method was found to be 75% each, followed by ELISA which is 70%. The specificities and the positive predictive values were 100 % for all the three methods, but the negative predictive values varied. The negative predictive value for microscopy and rapid antigen detection methods was 94.4% each. The sensitivity of rapid test was much higher in our study, when compared to the study done by Imwong M et al., because the principle of rapid test in his study was based on single antigen detection, were as in our study rapid test detected both HRP-2 and LDH [15]. In this study, we used only universal primers for identification of genus Plasmodium, which helped in confirmation of results obtained by the other three methods. PCR picked up more positives, proving to be the most sensitive method.
Limitation
The present study helps in selecting appropriate methods for diagnosis of malaria, but the sample size must have been more for calculating the prevalence, in view of increasing population densities in South Chennai. Better choices of molecular methods like multiplex PCR and nested PCR would be helpful in identifying other species, to assess chloroquine resistance and multidrug resistance among Plasmodium falciparum and Plasmodium vivax which are more prevalent species in our area, which might throw light in understanding the epidemiology of malaria in South Chennai and comparing it with other regions.
Conclusion
In our study PCR was more sensitive; it was able to detect more positives than microscopy, antigen detection method and ELISA. Therefore, a combination of two tests, either microscopy or antigen detection with PCR will increase the detection of malaria positive cases.