Identification is one of the main tasks of forensic analysis and refers to the determination of the identity of a living or deceased individual based on certain characteristic features [1,2]. Stature is one of the most important biological profiles in forensic sciences [3]. It exhibits racial variations in different populations and is also affected by genetic and environmental factors, nutrition, sex, age and physical activity [3-6]. Estimation of stature from fragmented skeletal remains, mutilated or amputated limbs or severely decomposed and dispersed human body parts is of very great importance in terms of victim identification in the case of murder, accidents or natural disasters and represents one of the major aspects of forensic science [1].
Anthropologists, anatomists and other medical specialists have employed anthropometric techniques to estimate stature and bone length from unidentified body parts for more than a century [1,7]. Various studies have been published on estimating the stature from skeletal remains [8,9]. Two methods of stature estimation have been established, the mathematical method and the anatomical method [10]. The anatomical method requires the existence of an entire skeleton and the addition of correction factors to compensate for soft tissues. The mathematical method requires a single bone or body parts and makes use of regression formulas or multiplication factors to elicit stature estimates based on correlation of individual bone measurements to statures observed in living populations [4,10]. An entire skeleton or long bone may be unavailable when bodies are dismembered or mutilated during conflicts and mass disasters, or as the result of criminal actions. One practical alternative is therefore, the development of standard calculations employing different parts of the human skeleton [3,4].
Numerous studies have been carried out for identifiying individuals and estimating stature from various parts of the body such as the upper and lower extremities [1,3-5,10-18]. Various linear regression equations have developed in these studies and these formulas give positive results with high correlation and accurate prediction for stature estimation. Stature in humans reaches adult levels between early youth and the 20s. In women, this generally occurs around mid-youth, while in men it takes place toward late youth [19]. A study from Turkey reported no significant difference between the sexes in terms of 10-year increases in stature, citing figures of 0.96 cm in males and 0.92 cm in females [20]. Studies from Europe and North America show that stature increases by up to approximately 1 cm every 10 years [21].
In studies on stature estimation using extremities, it was shown that there are racial and ethnic variations between stature and upper extremity [4,5,14,16]. Since racial, ethnic and nutritional factors play important roles in human growth and development, different formulas have to be applied for different population [22]. Hence, a study on Turkish population was required. The aim of the current study was to reveal the association between upper extremity measurements and the individual’s stature, and then to develop models to determine stature with high accuracy and reliability in forensic situations in which anatomical parts and remains need to be identified in the Turkish adults.
Materials and Methods
Sample
This cross-sectional study consisted of high school students from the Karadeniz Technical University (KTU), Trabzon, Turkey. Turkey consists of seven geographical regions. There are various ethnic groups (average 23) in the minority in Turkey (Kurd, Circassian, Azeri, Laz, Armenian, Gagavuz, Arab, Tatar etc.,) This study was conducted only on people of Turks ethnicity who constitute 71% of the population according to 2008 data (United States Centre for World Mission-USCWM). KTU accepts students from all geographic regions of Turkey regardless of ethnic orgin and socio-economic status.
Sample size was predicted using 80% power at the 5% level of significance in accordance with standard statistical protocol. The total number of students who were enrolled in the courses during the 2016-2017 and 2017-2018 academic years of the university was determined as 861. Approximately 70% of this number is made up of female students (252 males, 609 females). Because of the fact that the students who were enrolled in the study are composed of mostly females, stratified randomisation method was used according to sex with 1:1 ratio. 400 volunteer individuals, 200 male and 200 female, aged 18-25 years, were included in the research group.
Subjects with function disorders in the measurement areas, a history of upper extremity injury, any muscular disease, congenital disorder, deformity, fracture, amputation, movement restriction, systemic arthropathy, neurological disease, trauma or surgery and individuals without Turkish ethnicity were excluded from this study. Ethical approval was obtained from the University Ethics Committee and the research was carried out in accordance with the declaration of Helsinki (protocol no: 24237859-508; approval no: 2016/87). All subjects signed an informed consent form.
Measurements
All upper limb measurements were taken from the right (R) and left (L) sides. The anthropometric measurement points for the measurements in the study are given in the following sections.
Stature (S): Stature was measured from the vertex to the floor in the anatomical position and the Frankfurt plane using a portable stadiometer (SECA 213).
Arm length (ALR and ALL): The distance between the olecranon and acromion with the elbow flexed at 90 degrees and the shoulder fully adducted [Table/Fig-1a] [6,11].
Upper limb measurements: (a) arm length; (b) forearm length; (c) upper extremity length.
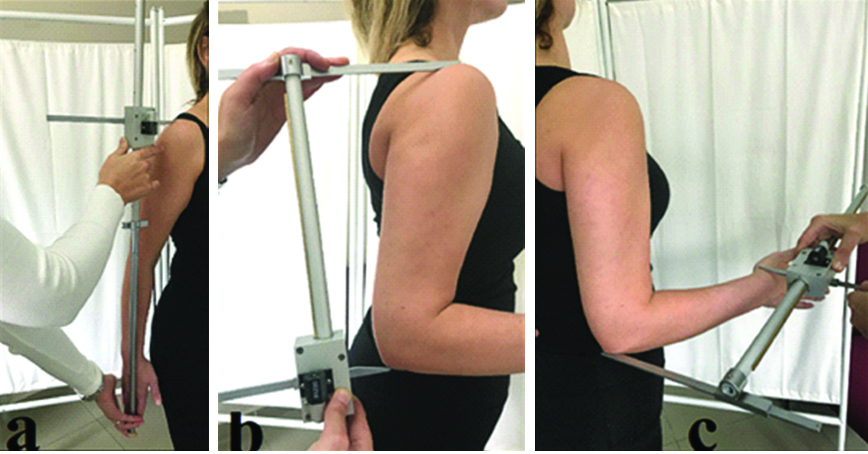
Forearm length (FALR and FALL): The distance between the radial styloid process and olecranon with the elbow flexed at 90 degrees [Table/Fig-1b] [4].
Upper extremity length (UELR and UELL): The distance between the acromion and the most distal part of the third finger [Table/Fig-1c] [22].
Hand length (HLR and HLL): The distance between the most distal point of the third finger and the mid-point of inter-styloid (mid-point of the distance between the radial styloid process and ulnar styloid process) line [Table/Fig-2a] [2]. Hand measurements were performed with the thumb slightly abducted and the other fingers adducted with the palm facing upward.
Hand measurements: (a) hand length; (b) palmar length; (c) third finger length; (d) hand width; (e) wrist width.
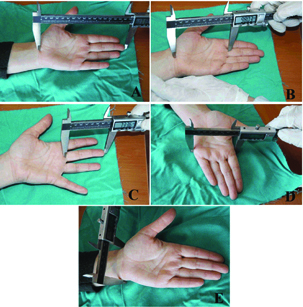
Palmar length (PLR and PLL): The distance between the transverse flexion line of the wrist joint and the flexion line at the most proximal point of the third finger [Table/Fig-2b) [7].
Third finger length (TFLR and TFLL): The distance between the most distal point and the proximal flexion line at the base of the third finger on the palmar surface [Table/Fig-2c] [23].
Hand width (HWR and HWL): The distance between the distal ends of the ossae metacarpi II and V [Table/Fig-2d] [14,16].
Wrist width (WWR and WWL): The distance between the radial styloid process and ulnar styloid process [Table/Fig-2e] [4].
Wrist circumference (WCR and WCL): Wrist circumference was measured around the wrist using a non-elastic tape measure.
Anthropometric measurements were taken using the standard technique and appropriate landmarks [24]. Arm, forearm and upper extremity lengths were measured using a Harpenden anthropometry set (Holtain Limited, UK). Hand measurements were taken using digital calipers with a 0-300 mm measurement capacity sensitive to ±0.01 mm. Stature was measured to the nearest 0.1 cm in bare feet with the subjects standing upright against a stadiometer. Measurements were performed at the same time of day (1 PM-3 PM) to prevent diurnal variation and all measurements were taken by the same individual in order to avoid personal bias.
Statistical Analysis
Statistical analyses were performed on SPSS 21.0 software. Normal distribution and homogeneity of variance were assessed. The t-test was used to compare measurement values between the sexes. Relations between stature and right and left extremity measurements were determined using Pearson Correlation Analysis with 95% confidence interval. Models were developed using linear regression analysis. The stepwise method was used for multiple regression analysis. The multiple regression models were derived as Y (stature)=a (constant)+b1 (regression coefficient of the first variable) X1 (first variable)+b2 (regression coefficient of the second variable) X2 (second variable)+…bn (regression coefficient for the nth variables) Xn (nth variable)±Standard Error Estimation (SEE). The accuracy of these equations was demonstrated by the SEE. Lower SEE values indicated higher accuracy [4,25]. Models were developed for two separate conditions in the present study, one including all upper extremity parameters and the other involving hand measurements alone.
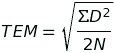
Before beginning data collection, stature and the upper extremity measurements of a sample of 40 volunteers (20 males, 20 females, using stratified randomisation method according to sex) were measured on two separate days and each participant was measured twice. The absolute Technical Error of Measurement (TEM) was initially calculated using the following equation: where, D represents the difference between two successive measurements, and N represents the number of individuals. The relative Technical Error of Measurement (rTEM) was calculated from two successive set of measurements by dividing the TEM for a given variable by the grand mean of that variable and multiplying the result by 100.
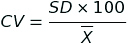
The coefficient of Reliability (R) was calculated. In addition to these measurements, the Coefficient of Variation (CV) was calculated with the following formula: where X̄ is the average of measurements and SD is the standard deviation. The CV expresses sample variability relative to the mean of the sample.
Intra-observer measurement error and reliability were calculated to be within acceptable limits for all measurements (R >0.9; rTEM <5%). [Table/Fig-3,4] show the results of precision and reliability analysis of anthropometric measurements found statistically significant at multiple regression analyses.
Anthropometric measurements, TEM, rTEM and R values.
| a | b | d2 | TEM | rTEM (%) | R* | p-value |
|---|
| S | 162.69±9.36 | 163.41±9.3 | 0.72±0.33 | 0.56 | 0.34 | 0.996 | <0.001 |
| UELR | 75.2±5.18 | 75.68±5.20 | 0.48±0.27 | 0.39 | 0.52 | 0.994 | <0.001 |
| UELL | 74.78±5.13 | 75.3±5.14 | 0.53±0.24 | 0.41 | 0.54 | 0.994 | <0.001 |
| ALR | 36.18±2.90 | 36.67±2.94 | 0.5±0.31 | 0.41 | 1.13 | 0.980 | <0.001 |
| ALL | 35.96±2.68 | 36.51±2.70 | 0.55±0.20 | 0.41 | 1.14 | 0.977 | <0.001 |
| FALR | 26.74±2.22 | 27.09±2.31 | 0.36±0.29 | 0.32 | 1.20 | 0.980 | <0.001 |
| FALL | 26.66±2.16 | 27.05±2.17 | 0.38±0.25 | 0.33 | 1.21 | 0.977 | <0.001 |
| HLR | 17.59±1.42 | 17.98±1.45 | 0.4±0.18 | 0.31 | 1.72 | 0.955 | <0.001 |
| HLL | 17.48±1.45 | 17.85±1.48 | 0.37±0.16 | 0.28 | 1.59 | 0.963 | <0.001 |
| HWR | 7.58±0.91 | 7.89±0.92 | 0.31±0.10 | 0.23 | 2.93 | 0.938 | <0.001 |
| HWL | 7.52±0.88 | 7.85±0.94 | 0.33±0.11 | 0.24 | 3.18 | 0.928 | <0.001 |
| PLR | 10.02±1.05 | 10.31±1.03 | 0.29±0.14 | 0.23 | 2.25 | 0.952 | <0.001 |
| PLL | 10.01±1.05 | 10.37±1.12 | 0.37±0.21 | 0.30 | 2.92 | 0.925 | <0.001 |
| WCR | 15.96±1.39 | 16.52±1.42 | 0.56±0,13 | 0.40 | 2.49 | 0.917 | <0.001 |
| WCL | 15.94±1.37 | 16.43±1.37 | 0.49±0.20 | 0.37 | 2.30 | 0.926 | <0.001 |
| WWR | 5.16±0.87 | 5.37±0.87 | 0.21±0.11 | 0.17 | 3.21 | 0.962 | <0.001 |
| WWL | 5.14±0.87 | 5.41±0.87 | 0.27±0.16 | 0.22 | 4.23 | 0.934 | <0.001 |
| TFLR | 7.41±0.99 | 7.53±1.00 | 0.12±0.08 | 0.10 | 1.40 | 0.989 | <0.001 |
| TFLL | 7.4±0.92 | 7.52±0.93 | 0.12±0.07 | 0.10 | 1.29 | 0.989 | <0.001 |
n=40; a: Average of the first measurement; b: Average of the second measurement; d: Difference between the average; TEM: Technical error measurement; rTEM: Relative technical error of measurement; R*: Coefficient of reliability; p: Statistical significance level of R; R: Right; L: Left; S: stature; UEL: Upper extremity length; AL: Arm length; FAL: Forearm length; HL: Hand length; HW: Hand width; PL: Palmar length; WC: Wrist circumference; WW: Wrist width; TFL: Third finger length
Average, standard deviation and coefficient of variation.
| Variables | X̄ | SD | CV |
|---|
| Stature | 163.05 | 9.33 | 5.72 |
| UELR | 75.44 | 5.19 | 6.88 |
| UELL | 75.04 | 5.13 | 6.84 |
| ALR | 36.42 | 2.92 | 8.01 |
| ALL | 36.24 | 2.69 | 7.42 |
| FALR | 26.92 | 2.26 | 8.41 |
| FALL | 26.85 | 2.17 | 8.07 |
| HLR | 17.78 | 1.44 | 8.09 |
| HLL | 17.67 | 1.46 | 8.29 |
| HWR | 7.74 | 0.91 | 11.78 |
| HWL | 7.69 | 0.91 | 11.83 |
| PLR | 10.16 | 1.04 | 10.24 |
| PLL | 10.19 | 1.09 | 10.68 |
| WCR | 16.24 | 1.40 | 8.63 |
| WCL | 16.18 | 1.37 | 8.45 |
| WWR | 5.27 | 0.87 | 16.49 |
| WWL | 5.27 | 0.87 | 16.43 |
| TFLR | 7.47 | 0.99 | 13.30 |
| TFLL | 7.46 | 0.92 | 12.38 |
n=40; X̄: average; SD: Standard deviation; CV: Coefficient of variation; R: Right; L: Left; S: Stature; UEL: Upper extremity length; AL: Arm length; FAL: Forearm length; HL: Hand length; HW: Hand width; PL: Palmar length; WC: Wrist circumference; WW: Wrist width; TFL: Third finger length
Results
Descriptive statistical analysis findings for the right and left upper extremities in the research group are shown in [Table/Fig-5]. T-test results for all measurements in male and female groups are shown in [Table/Fig-6]. A statistically significant difference was observed between the male and female groups (p<0.05), with male measurements being higher than those of females.
Research group (n=400) descriptive statistics for all measurements (cm).
| Research Group (n=400) |
|---|
| Min | Max | Mean±SD | | Min | Max | Mean±SD |
|---|
| AGE | 18 | 25 | 19.37±1.48 | S | 143.00 | 187.00 | 163.15±8.46 |
| ALR | 28.00 | 46.00 | 35.93±2.98 | ALL | 29.00 | 45.00 | 35.78±2.80 |
| FALR | 22.00 | 36.00 | 26.64±2.19 | FALL | 22.00 | 37.00 | 26.59±2.13 |
| UELR | 56.00 | 88.00 | 74.90±4.92 | UELL | 55.00 | 87.00 | 74.56±4.84 |
| HLR | 13.06 | 21.21 | 17.30±1.51 | HLL | 13.30 | 21.07 | 17.26±1.48 |
| HWR | 4.06 | 10.88 | 7.35±1.23 | HWL | 4.30 | 10.97 | 7.29±1.20 |
| WWR | 2.30 | 8.30 | 4.97±1.16 | WWL | 2.32 | 8.15 | 4.95±1.13 |
| WCR | 13.00 | 20.00 | 15.81±1.25 | WCL | 11.16 | 20.50 | 15.77±1.27 |
| PLR | 6.59 | 14.04 | 9.78±1.27 | PLL | 6.69 | 13.07 | 9.74±1.26 |
| TFLR | 4.18 | 10.79 | 7.22±1.23 | TFLL | 4.10 | 10.65 | 7.17±1.23 |
SD: Standard deviation; R: Right; L: Left; S: Stature; AL: Arm length; FAL: Forearm length; UEL: Upper extremity length; HL: Hand length; HW: Hand width; WW: Wrist width; WC: Wrist circumference; PL: Palmar length; TFL: Third finger length
Analysis of differences between mean measurements in the male and female groups.
| Female (n=200)Mean±SD | Male (n=200)Mean±SD | t | p |
|---|
| AGE | 19.34±01.47 | 19.45±1.51 | -0.662 | 0.508 |
| S | 159.35±5.80 | 172.92±6.06 | -20.738 | <0.001* |
| ALR | 34.89±2.29 | 38.60±2.90 | -12.125 | <0.001* |
| FALR | 25.71±1.43 | 29.01±2.02 | -15.764 | <0.001* |
| UELR | 72.88±3.68 | 80.10±3.78 | -17.467 | <0.001* |
| HLR | 16.90±1.37 | 18.31±1.39 | -9.173 | <0.001* |
| HWR | 7.18±1.21 | 7.79±1.16 | -4.559 | <0.001* |
| WWR | 4.89±1.15 | 5.17±1.15 | -2.149 | 0.032* |
| WCR | 15.31±0.92 | 17.08±1.07 | -16.406 | <0.001* |
| PLR | 9.55±1.22 | 10.36±1.23 | -5.908 | <0.001* |
| TFLR | 7.11±1.20 | 7.49±1.26 | -2.756 | 0.006* |
| | | | | |
| ALL | 34.80±2.15 | 38.30±2.72 | -12.177 | <0.001* |
| FALL | 25.74±1.48 | 28.78±1.98 | -14.720 | <0.001* |
| UELL | 72.53±3.61 | 79.81±3.46 | -18.315 | <0.001* |
| HLL | 16.86±1.35 | 18.26±1.33 | -9.293 | <0.001* |
| HWL | 7.12±1.19 | 7.74±1.12 | -4.751 | <0.001* |
| WWL | 4.88±1.13 | 5.13±1.13 | -1.996 | 0.047* |
| WCL | 15.28±0.91 | 17.00±1.23 | -13.376 | <0.001* |
| PLL | 9.52±1.23 | 10.29±1.17 | -5.635 | 0.000* |
| TFLL | 7.07±1.21 | 7.43±1.25 | -2.645 | 0.008* |
*p<0.05 significiant; S: Stature; R: Right; L: Left; t: t statistics; AL: Arm length; FAL: Forearm length; UEL: Upper extremity length; HL: Hand length; HW: Hand width; WW: Wrist width; WC: Wrist circumference; PL: Palmar length; TFL: Third finger length
[Table/Fig-7] illustrates the correlation coefficients between stature and right upper extremity measurements, and [Table/Fig-8] illustrates the correlation coefficients between stature and left upper extremity measurements for the research and male-female groups. Statistically significant correlations were observed in all parameters in all groups (p<0.05). Comparison of correlations (r) between stature and upper extremity parameters in different populations are presented in [Table/Fig-9].
Correlations between stature and right upper extremity measurements.
| Research group (n=400) | Female (n=200) | Male (n=200) |
|---|
| r | p | r | p | r | p |
|---|
| ALR | 0.717 | <0.001** | 0.575 | <0.001** | 0.497 | <0.001** |
| FALR | 0.753 | <0.001** | 0.549 | <0.001** | 0.486 | <0.001** |
| UELR | 0.861 | <0.001** | 0.768 | <0.001** | 0.675 | <0.001** |
| HLR | 0.501 | <0.001** | 0.309 | <0.001** | 0.339 | <0.001** |
| HWR | 0.480 | <0.001** | 0.260 | <0.001** | 0.248 | 0.038* |
| WWR | 0.320 | <0.001** | 0.314 | <0.001** | 0.317 | <0.001** |
| WCR | 0.626 | <0.001** | 0.572 | <0.001** | 0.675 | <0.001** |
| PLR | 0.301 | <0.001** | 0.310 | <0.001** | 0.303 | <0.001** |
| TFLR | 0.200 | <0.001** | 0.225 | <0.001** | 0.223 | 0.018* |
**p<0.01, *p<0.05 significiant; r: Correlation coefficient
Correlations between stature and left upper extremity measurements.
| Research group (n=400) | Female (n=200) | Male (n=200) |
|---|
| r | p | r | p | r | p |
|---|
| ALL | 0.724 | <0.001** | 0.574 | <0.001** | 0.534 | <0.001** |
| FALL | 0.734 | <0.001** | 0.538 | <0.001** | 0.473 | <0.001** |
| UELL | 0.868 | <0.001** | 0.758 | <0.001** | 0.716 | <0.001** |
| HLL | 0.505 | <0.001** | 0.307 | <0.001** | 0.350 | <0.001** |
| HWL | 0.469 | <0.001** | 0.258 | <0.001** | 0.231 | <0.001** |
| WWL | 0.318 | <0.001** | 0.317 | <0.001** | 0.312 | <0.001** |
| WCL | 0.608 | <0.001** | 0.545 | <0.001** | 0.321 | 0.001** |
| PLL | 0.293 | <0.001** | 0.304 | <0.001** | 0.221 | 0.019* |
| TFLSOL | 0.181 | <0.001** | 0.231 | <0.001** | 0.219 | <0.001** |
**p<0.01, *p<0.05 significiant; r: Correlation coefficient
Comparison of correlations (r) between stature and upper extremity parameters in different populations.
| Sex | Turkey | Sudanese | Central India | Southern Nigeria | Turkey | Iranian | North India | Nigeria | Australian |
|---|
| | Present study | Ahmed AA [4] | Shende MR et al., [22] | Oladunni E [10] | Özaslan A et al., [28] | Akhlaghi M et al., [13] | Chandra A et al., [23] | Ugbem LP et al., [16] | Howley D et al., [27] |
|---|
| UELR | Male | 0.675 | 0.698 | 0.416 | - | 0.450 | 0.635 | - | - | - |
| Female | 0.768 | 0.643 | 0.367 | - | 0.660 | 0.735 | - | - | - |
| Combine | 0.861 | - | 0.540 | - | - | 0.832 | - | - | - |
| UELL | Male | 0.716 | - | - | - | - | - | - | - | - |
| Female | 0.758 | - | - | - | - | - | - | - | - |
| Combine | 0.868 | - | - | - | - | - | - | - | - |
| ALR | Male | 0.497 | - | - | 0.142 | - | 0.602 | - | - | - |
| Female | 0.575 | - | - | 0.214 | - | 0.669 | - | - | - |
| Combine | 0.717 | - | - | - | - | 0.759 | 0.565 | 0.206 | - |
| ALL | Male | 0.534 | - | - | - | - | - | - | - | - |
| Female | 0.574 | - | - | - | - | - | - | - | - |
| Combine | 0.724 | - | - | - | - | - | - | - | - |
| FALR | Male | 0.486 | 0.725 | - | 0.390 | - | 0.354 | - | - | 0.748 |
| Female | 0.549 | 0.722 | - | 0.481 | - | 0.299 | - | - | 0.780 |
| Combine | 0.753 | - | - | - | - | 0.580 | - | 0.543 | 0.886 |
| FALL | Male | 0.473 | - | - | - | - | - | - | - | 0.740 |
| Female | 0.538 | - | - | - | - | - | - | - | 0.778 |
| Combine | 0.734 | - | - | - | - | - | - | - | 0.887 |
| HLR | Male | 0.339 | 0.602 | - | - | 0.530 | 0.696 | - | - | 0.647 |
| Female | 0.309 | 0.615 | - | - | 0.350 | 0.724 | - | - | 0.719 |
| Combine | 0.501 | - | - | - | - | 0.816 | 0.598 | 0.609 | 0.949 |
| HLL | Male | 0.350 | - | - | - | - | - | - | - | 0.686 |
| Female | 0.307 | - | - | - | - | - | - | - | 0.865 |
| Combine | 0.505 | - | - | - | - | - | - | - | 0.748 |
| HWR | Male | 0.248 | 0.358 | - | - | 0.140 | 0.310 | - | - | 0.505 |
| Female | 0.260 | 0.431 | - | - | 0.290 | 0.509 | - | - | 0.433 |
| Combine | 0.480 | - | - | - | - | 0.736 | 0.460 | 0.583 | 0.743 |
| HWL | Male | 0.231 | - | - | - | - | - | - | - | 0.592 |
| Female | 0.258 | - | - | - | - | - | - | - | 0.535 |
| Combine | 0.469 | - | - | - | - | - | - | - | 0.785 |
| PLR | Male | 0.303 | - | - | - | - | - | - | - | 0.540 |
| Female | 0.310 | - | - | - | - | - | - | - | 0.569 |
| Combine | 0.301 | - | - | - | - | - | - | - | 0.777 |
| PLL | Male | 0.221 | - | - | - | - | - | - | - | 0.505 |
| Female | 0.304 | - | - | - | - | - | - | - | 0.620 |
| Combine | 0.293 | - | - | - | - | - | - | - | 0.783 |
| WCR | Male | 0.675 | - | - | - | - | - | - | - | - |
| Female | 0.572 | - | - | - | - | - | - | - | - |
| Combine | 0.626 | - | - | - | - | - | - | - | - |
| WCL | Male | 0.321 | - | - | - | - | - | - | - | - |
| Female | 0.545 | - | - | - | - | - | - | - | - |
| Combine | 0.608 | - | - | - | - | - | - | - | - |
| WWR | Male | 0.317 | 0.522 | - | - | 0.180 | - | - | - | - |
| Female | 0.314 | 0.327 | - | - | 0.140 | - | - | - | - |
| Combine | 0.320 | - | - | - | - | - | - | - | - |
| WWL | Male | 0.312 | - | - | - | - | - | - | - | - |
| Female | 0.317 | - | - | - | - | - | - | - | - |
| Combine | 0.318 | - | - | - | - | - | - | - | - |
| TFR | Male | 0.223 | - | - | - | - | 0.674 | - | - | - |
| Female | 0.225 | - | - | - | - | 0.644 | - | - | - |
| Combine | 0.200 | - | - | - | - | 0.759 | 0.480 | - | - |
| TFL | Male | 0.219 | - | - | - | - | - | - | - | - |
| Female | 0.231 | - | - | - | - | - | - | - | - |
| Combine | 0.181 | - | - | - | - | - | - | - | - |
R: Right; L: Left; S: Stature; UEL: Upper extremity length; AL: Arm length; FAL: Forearm length; HL: Hand length; HW: Hand width; PL: Palmar length; WC: Wrist circumference; WW: Wrist width; TFL: Third finger length
Models developed from the right upper extremity measurements for stature estimation are presented in [Table/Fig-10], and models for left upper extremity measurements are shown in [Table/Fig-11]. The research, male and female groups were evaluated as a whole, and the increases in coefficient of determination (R2) produced by all variables added to the model were found significant (p<0.001).
Models for all right upper extremity measurements.
| Group | ±SEE | R | R2 | Adj R2 | F | VIF | p |
|---|
| RG | ±3.909 | 0.888 | 0.788 | 0.787 | 492.069 | UELR: 2.187FALR: 2.444WCR: 1.715 | <0.001 |
| Male | ±4.385 | 0.697 | 0.486 | 0.477 | 51.626 | UELR: 1.317FALR: 1.317 | <0.001 |
| Female | ±3.580 | 0.789 | 0.622 | 0.620 | 234.720 | UELR: 1.359FALR: 1.359 | <0.001 |
| Regression Equations |
| S=45.441+(1.084×UELR)+(0.814×FALR)+(0.938×WCR)SM=81.447+(0.921×UELR)+(0.610×FALR)SF=61.620+(1.042×UELR)+(0.848×FALR) |
S: Stature; RG: Research group; M: Male; F: Female; SEE: Standard error estimation; R: Coefficient of reliability; R2: Coefficient of determination; Adj R2: Adjusted r-squared; VIF: Variance inflation factor; F: F statistics
Models for all left upper extremity measurements.
| Group | ±SEE | R | R2 | Adj R2 | F | VIF | p |
|---|
| RG | ±3.975 | 0.884 | 0.781 | 0.780 | 471.663 | UELL: 2.342FALL: 2.469WCL: 1.674 | <0.001 |
| Male | ±3.721 | 0.716 | 0.592 | 0.589 | 116.006 | UELL: 1.000FALL: 1.000 | <0.001 |
| Female | ±3.538 | 0.797 | 0.635 | 0.628 | 98.067 | UELL: 2.583FALL: 1.600WCL: 1.196WWL: 5.979HLL: 7.177 | <0.001 |
| Regression Equations |
| S=44.912+(1.197×UELL)+(0.620×FALL)+(0.792×WCL)SM=65.529+(1.075×UELL)+(0.616×FALL)SF=56.365+(0.813×UELL)+(0.411×FALL)+(0.939×WCL)+(2.257×WWL)+(1.784×HLL) |
S: Stature; RG: Research group; M: Male; F: Female; SEE: Standard error estimation; R: Coefficient of reliability; R2: Coefficient of determination; Adj R2: Adjusted r-squared; VIF: Variance Inflation Factor; F: F statistics.
Right hand regression equations for the research, male and female groups are shown in [Table/Fig-12], and left hand regression equations are shown in [Table/Fig-13]. The research, male and female groups were evaluated as a whole, and the increases in the coefficient of determination produced by all variables added to the model were found significant (p<0.001).
Models for right hand measurements.
| Group | ±SEE | R | R2 | Adj R2 | F | VIF | p |
|---|
| RG | ±4.707 | 0.827 | 0.684 | 0.682 | 285.893 | WCR: 1.279HLR: 3.490WWR: 3.021 | <0.001 |
| Male | ±4.897 | 0.605 | 0.425 | 0.348 | 20.737 | WCR: 1.215HLR: 3.982WWR: 3.718 | <0.001 |
| Female | ±4.245 | 0.686 | 0.471 | 0.465 | 84.232 | HLR: 3.338WWR: 3.325WCR: 1.012 | <0.001 |
| Regression Equations |
| S=55.760+(2.539×WCR)+(5.598×HLR)+(-5.951×WWR)SM=96.068+(1.306×WCR)+(4.254×HLR)+(-4.517×WWR)SF=78.379+(4.726×HLR)+(-5.051×WWR)+(1.685×WCR) |
S: Stature; RG: Research group; M: Male; F: Female; SEE: Standard error estimation; R: Coefficient of reliability; R2: Coefficient of determination; Adj R2: Adjusted r-squared; VIF: Variance inflation factor; F: F statistics
Models for left hand measurements.
| Group | ±SEE | R | R2 | Adj R2 | F | VIF | p |
|---|
| RG | ±4.812 | 0.791 | 0.625 | 0.621 | 208.137 | HLL: 1.964WWL: 1.537TFLL: 2.080PLL: 1.036 | <0.001 |
| Male | ±4.958 | 0.591 | 0.470 | 0.431 | 19.346 | HLL: 4.258HWL: 3.144WCL: 1.132 | <0.001 |
| Female | ±4.124 | 0.709 | 0.502 | 0.495 | 90.655 | WCL: 1.050HLL: 3.551WWL: 5.077PLL: 4.875 | <0.001 |
| Regression Equations |
| S=62.608+(10.121×HLL)+(-2.494×WWL)+(-4.592×TFLL)+(-2.961×PLL)SM=104.276+(4.665×HLL)+(-4.671×HWL)+(1.152×WCL)SF=73.605+(1.660×WCL)+(6.031×HLL)+(-4.416×WWL)+(-2.279×PLL) |
S: Stature; RG: Research group; M: Male; F: Female; SEE: Standard error estimation; R: Coefficient of reliability; R2: Coefficient of determination; Adj R2: Adjusted r-squared; VIF: Variance inflation factor; F: F statistics.
Discussion
The results of the current study demonstrate that the statures and recorded upper extremity measurements of males are significantly larger than those of females. Our comparison, findings between males and females were similar to those of previous studies in which anthropometric measurements were performed in the same and different populations [3,4,10,12-14,16-18]. These findings may be attributed to stature in males being greater than in females for genetic reasons, due to puberty in females starting and ending approximately two years earlier than in males.
The correlation coefficients between stature and right and left upper extremity measurements in this study were highly significantly and positively correlated in the research and male-female groups, indicating that linear regression equations for the estimation of stature can be derived from upper extremity measurements. The highest correlation with stature in the research, female and male groups was observed in the right upper extremity length (r=0.861, r=0.768, and r=0.675, respectively) and left upper extremity length (r=0.868, r=0.758 and r=0.716, respectively) (p<0.01). Our findings were rather higher than the results of Shende MR et al., study [22], and were similar to those reported by Akhlaghi M et al., study for right sides in Iranian population [13]. After upper extremity length, the highest correlations were observed in right and left forearm lengths (r=0.753, r=0.734) in both groups; in right and left arm lengths (r=0.575, r=0.574) in females; and in right and left arm lengths (r=0.497, r=0.534, respectively) in males [Table/Fig-7,8] in the current study. In Özaslan A et al., study, the highest values were associated with upper extremity length (62%) and forearm length (38%) for males and upper extremity length (64%) and arm length (43%) for females in Turkish subjects [26]. The correlation between stature and arm length in the present study was higher than that reported for studied North Indian [23] and Nigeran [16] subjects, but is lower than Iranian [13] subjects. When the right forearm length is evaluated, the correlation coefficient was greater than that reported for studied Nigeran [10,16] and Iranian [13] populations, but is lower for Sudanese [18] and Australian (Howley) populations. The correlation values of left forearm length were lower than Australian subjects in Howley D et al., study for research, male and female groups [27].
In the present study, arm length exhibited a higher correlation coefficient than hand length, and the lowest correlations in the research group were in right third finger length (r=0.200) and left third finger length (r=0.181). The lowest correlations among female subjects were in right third finger length (r=0.225) and left third finger length (r=0.231). In the male group, the lowest correlation were in right third finger length (r=0.223) and left third finger length (r=0.219) [Table/Fig-7,8]. The correlation of the third finger length was found to be quite low in contrast to the Iranian [13] and North Indian population [23]. Ugbem LP et al., reported significant correlations between stature and arm length, forearm length, hand length and hand width in Nigerian subjects, again in agreement with our results [16]. In contrast to our study, they reported the highest degree of correlation with hand length, while the lowest degree of correlation was with arm length. The correlation coefficients between stature and the hand length, hand width and wrist width were lower than Sudanese subjects [18]. Comparison of correlation coefficients between stature and upper extremity parameters in different populations are shown in [Table/Fig-9]. It can be seen clearly that, although all upper extremity parameters were significantly correlated with stature in both our current study and previous studies, the strongest and weakest correlations varied between populations. These variational findings may be the result of variables such as genetic background, nutrition, climate and physical activity levels between populations, or the number of samples included in the study.
Considering the probability of both extremities being present in forensic cases, right and left upper extremity measurements were evaluated together in stature estimation in the current study. In case of multiple fleshed body parts being recovered for analysis, the model with the lowest SEE should be chosen because this will produce the most accurate stature estimate [27]. Ahmed AA estimated stature from upper extremity measurements and reported a SEE: ±3.54-±5.85 for both sexes in Sudanese population [18]. In Navid S et al., study, stature and upper extremity length were correlated in all cases (±SEE=7.16, R2=0.513) and in the male group (SEE=±4.52, R2=0.398) on the basis of linear regression equations developed for stature estimation in Iranian population [6]. Özaslan A et al., reported SEE ranged from ±6.03 to ±6.9 cm for hand dimensions [28] and Şanlı SG et al., reported SEE ±3.49 cm for hand length in Turkish population [29]. Ilayperuma I et al., developed model using hand length values in Sri Lankan adults (SEE: ±3.493 in males, ±3.625 in females) [17]. In the current study, the best regression equations were determined in the research group for the right upper extremity (SEE: ±3.909, R2: 0.788), and for the left upper extremity (SEE: ±3.975, R2: 0.781) [Table/Fig-10,11]. The best regression equations were determined in research group for the right hand (SEE: ±4.707, R2: 0.684), and for left hand (SEE: ±4.812, R2: 0.625). These results show that the right upper extremity and right hand elicited a better estimate than the left upper extremity and left hand [Table/Fig-12,13]. The accuracy of stature estimation models for all ranged from ±3.538 to ±4.958 cm in the current study. SEE obtained in the present study was lower than that reported previously studies [6,18,27,28].
Limitation
In spite of the efforts made to increase the sample size, the final sample was smaller than desired. Turkish adults would necessitate a larger sample with adequate geographical and social heterogeneity or a national examination that evaluates all population. Equations are specific to the Turkish population and these should not be used for other populations. The models achieved in this study were based on adult sample and are not applicable for juveniles.
Conclusion
The results of present study demonstrate strong relationship between the upper extremity components and stature. All models developed in this study provided valid and reliable stature estimations with high correlation and accuracy levels and low estimation error. The stature estimation formulas have a 3-4 cm deviation. The models in this study can be used for forensic identification purposes in the Turkish adults. Right and left upper extremity measurements can also be used for populations with similar anthropometric characteristics to those of our cases.
n=40; a: Average of the first measurement; b: Average of the second measurement; d: Difference between the average; TEM: Technical error measurement; rTEM: Relative technical error of measurement; R*: Coefficient of reliability; p: Statistical significance level of R; R: Right; L: Left; S: stature; UEL: Upper extremity length; AL: Arm length; FAL: Forearm length; HL: Hand length; HW: Hand width; PL: Palmar length; WC: Wrist circumference; WW: Wrist width; TFL: Third finger length
n=40; X̄: average; SD: Standard deviation; CV: Coefficient of variation; R: Right; L: Left; S: Stature; UEL: Upper extremity length; AL: Arm length; FAL: Forearm length; HL: Hand length; HW: Hand width; PL: Palmar length; WC: Wrist circumference; WW: Wrist width; TFL: Third finger length
SD: Standard deviation; R: Right; L: Left; S: Stature; AL: Arm length; FAL: Forearm length; UEL: Upper extremity length; HL: Hand length; HW: Hand width; WW: Wrist width; WC: Wrist circumference; PL: Palmar length; TFL: Third finger length
*p<0.05 significiant; S: Stature; R: Right; L: Left; t: t statistics; AL: Arm length; FAL: Forearm length; UEL: Upper extremity length; HL: Hand length; HW: Hand width; WW: Wrist width; WC: Wrist circumference; PL: Palmar length; TFL: Third finger length
**p<0.01, *p<0.05 significiant; r: Correlation coefficient
**p<0.01, *p<0.05 significiant; r: Correlation coefficient
R: Right; L: Left; S: Stature; UEL: Upper extremity length; AL: Arm length; FAL: Forearm length; HL: Hand length; HW: Hand width; PL: Palmar length; WC: Wrist circumference; WW: Wrist width; TFL: Third finger length
S: Stature; RG: Research group; M: Male; F: Female; SEE: Standard error estimation; R: Coefficient of reliability; R2: Coefficient of determination; Adj R2: Adjusted r-squared; VIF: Variance inflation factor; F: F statistics
S: Stature; RG: Research group; M: Male; F: Female; SEE: Standard error estimation; R: Coefficient of reliability; R2: Coefficient of determination; Adj R2: Adjusted r-squared; VIF: Variance Inflation Factor; F: F statistics.
S: Stature; RG: Research group; M: Male; F: Female; SEE: Standard error estimation; R: Coefficient of reliability; R2: Coefficient of determination; Adj R2: Adjusted r-squared; VIF: Variance inflation factor; F: F statistics
S: Stature; RG: Research group; M: Male; F: Female; SEE: Standard error estimation; R: Coefficient of reliability; R2: Coefficient of determination; Adj R2: Adjusted r-squared; VIF: Variance inflation factor; F: F statistics.