CRC throughout the world differ significantly and is a formidable health crisis. The number of CRC-related deaths accounts for 8% and also the fourth most common cause of death due to cancer. Almost 60% of cases are encountered in developed countries [1,2]. In India, CRC Annual Incidence Rates are 4.4 (colon) and 4.1 (rectum) per 100000 in men and 3.9 per 100000 in women for colon cancer. In men; CRC ranks 8th for colon and 9th for rectal. Whereas, CRC in women ranks 9th for colon and does not figure in the top 10 cancers for rectal [3].
Clinicopathologic staging of CRC is carried out by using the American Joint Committee on Cancer/International Union Against Cancer (AJCC/UICC) [4], Tumour-Node-Metastasis (TNM) staging system for prognosis and treatment decision [1].
However, a significant number of tumours in spite of categorised as low risk by the TNM system demonstrate local or distant recurrences. TNM staging in patients with intermediate-stage tumours can serve as a dependable prognostic system taking into consideration morphologic, molecular or treatment-related factors that can stratify more accurately categories into different risk. Thus, a major research center of attention to evaluate the prognosis of CRC for additional explorating factors has been studied [5,6].
The potential histopathologic parameters in CRC comprise presence of an inflammatory infiltrate, tumour border configuration, lymphatic and extramural venous invasion and, Tumour Budding (TB) [5]. Among these parameters, TB (i.e., isolated single cancer cells or clusters composed of fewer than five undifferentiated cancer cells at the invasive tumour margin) has established the current focus. It is now considered as an independent adverse histopathological prognostic factor in CRC as more significant than those defined by TNM staging alone that may allocate stratification of patients into risk categories and also potentially lead the treatment of choice, chiefly in T3/4 N0 M0 (stage II) CRCs [5-7].
TB has been considered as PTB when localised predominantly at the invasive front. TB can also be observed within the tumour where it is surrounded by malignant glands on all sides, which has been referred to as ITB. ITB has been evaluated in preoperative biopsies and found to be associated with higher tumour grade, lymphovascular invasion and the presence of lymph node metastasis in the CRC resected specimen and, also with distant metastasis [8-14]. The presence of ITB in preoperative biopsies and PTB in corresponding resections is strongly and positively correlated; suggesting that an OTB count (i.e., PTB and ITB together) could be useful [14-16].
A cytokeratin (CK 20) Immunohistochemistry (IHC) is characteristically expressed in higher percentage of CRC and it differentiate effectively CRC from primary carcinoma of lung, liver, breast and, female genital tract [17]. A CK IHC is useful in certain situations when it is particularly difficult to decide TB in routine Haematoxylin and Eosin (H&E) staining like abundant inflammatory infiltrate and stromal reaction at the invasive front makes it hard to distinguish between activated lymphocytes, histiocytes or stromal cells with that of real buds [18].
The International Tumour Budding Consensus Conference (ITBCC) held at BERN (2016) recommended guidelines for assessment of TB (PTB and ITB), the consensus outlined the role of cytokeratin IHC stain, the scoring system and the location of TB as crucial areas of further scrutiny [19].
In this study, we assessed the scoring system of TB by H&E staining with IHC (CK20) in resected specimens of CRC and its relation with known prognostic histopathological parameters.
Materials and Methods
The study was descriptive cross-sectional study which was undertaken at the Department of Pathology, JSS Medical College, JSS Academy of Higher Education and Research, Mysuru, Karnataka, India. A total number of 50 resected CRC were studied prospectively between June 2015 and Aug 2017. All cases diagnosed histopathologically as adenocarcinomas of the colorectum in resected specimens were included in the study after obtaining approval from the hospital ethics committee (IEC no.-ECR/387/Inst/KA/2013/RR-16) and consent of the patient.
All specimens were received in 10% formalin. Relevant clinical information including age at diagnosis, gender and presenting complaints were obtained according to the proforma. The specimens were then subjected to gross description and adequate sampling by appropriate tissue section. Microscopic features were studied with routine H&E stained sections. Histological type, grade, depth of invasion, Lymphovascular Invasion (LVI), number of lymph nodes resected, number of lymph nodes with metastasis and pathological stage of tumour were noted.
The tumours were classified according to WHO classification [1] and the American Joint Committee of Cancer (AJCC) 8th edition [4], was followed for staging of the CRC specimens. All diagnostic slides were re-reviewed and the tumour block with the highest budding grade on standard H&E histology was selected for cytokeratin IHC (CK20-Genepulse, Rabbit Monoclonal Antibody; 1:200, enzyme pre-treatment five minutes, DAB chromogen).
A 3-4 μm thick sections were taken on Poly-L-Lysine coated slides. The slides were baked at 60°C for one hour in hot air oven. Slides were deparaffinised, rehydrated and heated in a pressure cooker containing antigen retrieval solution, sodium citrate buffer at pH 6. When the pressure cooker reached operating temperature and pressure, it was timed for one minute or upto 2 to 3 whistles. The slides were cooled, washed with wash buffer solution. Peroxide block was applied for 10 minutes and washed with Tris Buffered Saline (TBS) for 2-5 minutes and same protocol was followed for protein block application. The sections were incubated with CK20 primary antibody for one hour and washed with TBS for 2-5 minutes. Post primary block/enhancer was applied for 30 minutes and washed with TBS for 2-5 minutes. The sections were incubated with SS label (polymer) for 30 minutes and washed with TBS for 2-5 minutes. The bound antibody was visualised using a DAB-chromogen substrate. The sections were rinsed in running water and counterstained with haematoxylin and again rinsed in water for five minutes.
Sections from normal colonic mucosa were taken as positive control and sections from the ductal carcinoma of the breast were taken as negative control. Positivity of CK20 taken as cytoplasmic brown colour staining.
TB was defined as the presence of de-differentiated single cell or small clusters of upto five cells near the invasive front of the main tumour as PTB and within the tumour as ITB. OTB was considered as a total of PTB and ITB [6].
The scoring was done according to Rieger G et al., using cut-off and continuous scores both in H&E and IHC stained sections [16]. Cut-off scores were calculated to categorise TB as high grade and low grade. Continuous scores represent total number of buds which were counted as PTB, ITB and OTB without categorically grading them as high grade or low grade.
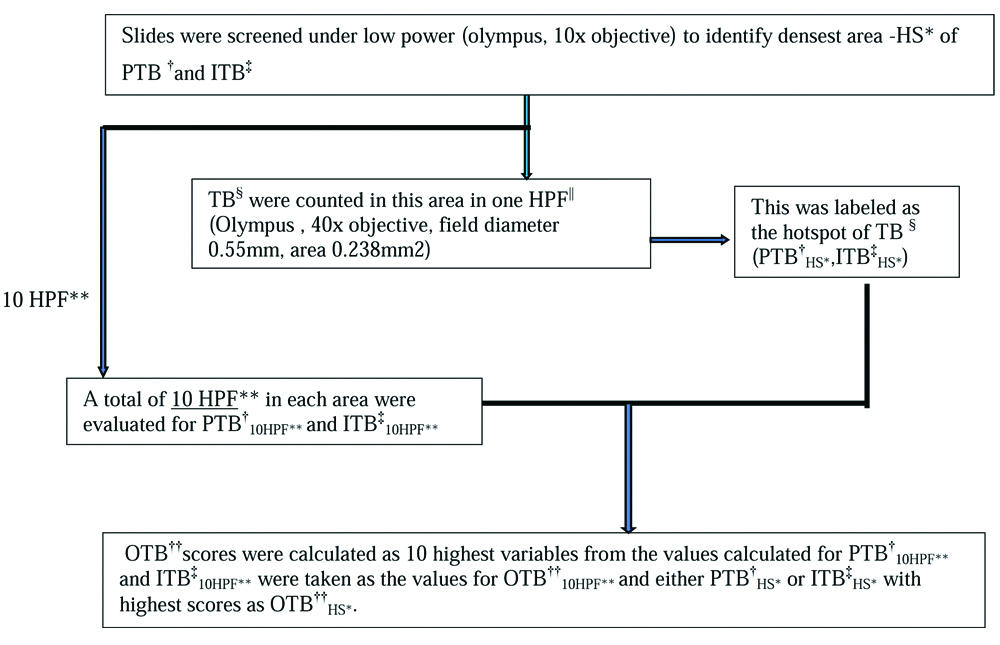
PTB, ITB and OTB were assessed as per [Table/Fig-1] under 10 high power field (10HPF) and densest area as Hot Spot (HS) i.e., 1HPF. PTB cut-off of ≥10 buds were taken as high grade in both PTB10HPF and PTBHS [16,20,21] and, ITB cut-off of ≥5 buds were taken as high grade in both ITB10HPF and ITBHS [13,16]. Whereas OTB cut off of ≥8 and ≥14 buds were taken as high grade in OTB10HPF and OTBHS respectively [16].
Study design: Flow chart depicting the assessment of tumour budding by H&E and CK20 IHC. *Hot spot, †Peritumoural budding, ‡Intratumoural budding, §Tumour budding, ||High power fields, **10 high power fields, ††Overall tumour budding.
PTB, ITB and OTB scores were compared in both H&E and IHC stained sections and the association with various clinicopathological features like gender, location, tumour size, pT, pN, LVI, grade and inflammation was also evaluated.
Statistical Analysis
Descriptive statistics was performed for all budding counts.Pearson’s correlation coefficient was used to determine the strength of the linear relationship (r) between PTB, ITB and OTB.The association of TB as a continuous variable with categorical endpoints was analysed with the Wilcoxon Rank Sum Test.
The Chi-Square or Fisher’s-Exact tests were used where appropriate. Analyses were performed using SPSS (Version 20). The p-values <0.05 were considered statistically significant.
Results
Among the 50 cases evaluated in the study [Table/Fig-2], the age group between 61-70 years had maximum CRC followed by 41-50 years.The youngest patient in the study was 32-year-old and the eldest was 82-year-old, with a mean age of 56.6. Majority (54%) patients were female. Most common presenting complaint was bleeding per rectum, seen in almost all cases. Right side was more common and grossly ulceroinfiltrative pattern in 30 cases (60%) were prominent. Histopathologically, majority were adenocarcinoma (NST) type 43 cases (86%) and grading wise low grade in 44 cases (88%). According to pTNM staging highest cases were in pT3 and pN0. On quantitative assessment of TB by both H&E and positive cytoplasmic brown colour staining of CK20 by IHC, the following features were noted. All the 50 cases showed CK20 positivity. In comparison to the H&E stained sections an increased detection of high grade TB in IHC stained sections of PTB [Table/Fig-3a and b], ITB [Table/Fig-3c and d] and OTB [Table/Fig-4a and b] were noted. In PTB10HPF IHC 16% (8 cases) and PTBHS 52% (26 cases) in comparison to the H&E stained sections where only one high grade case was noted. Whereas, 28% (14 cases) in ITB10HPF and 74% (37 cases) in ITBHS, in comparison to the H&E stained sections where only 10 high grade cases were noted. Also 34% (17 cases) in OTB10HPF in comparison to the H&E stained sections where only five cases were high grade. Also noted dense inflammatory and stromal reaction in H&E staining having high TB count on IHC staining [Table/Fig-4c and d].
Clinicopathological characteristics of 50 colorectal carcinoma cases.
| Characteristics | No. of patients (%) |
|---|
| 1 | Age (range) | Mean age of 56.6 years. |
| 2 | Gender | Female-27(54%) |
| Male-23 (46%) |
| 3 | Clinical presentation | Bleeding per rectum-42 (84%) |
| Abdominal pain-08 (16%) |
| 4 | Tumour site | Right colon-37 (74%) |
| Left colon-13 (26%) |
| 5 | Gross | Ulceroinfiltrative growth-30 (60%) |
| Ulceroprolifertaive-10 (20%) |
| Polypoidal growth-05 (10%) |
| Stricture-03 (06%) |
| Perforation-02 (04%) |
| 6 | Histopathological type | Adenocarcinoma (NST) type-43 (86%) |
| Mucinous adenocarcinoma-06 (12%) |
| Signet ring cell carcinoma-01 (02%). |
| 7 | Histopathological Grade | Low grade-44 (88%) |
| High grade-06 (12%) |
| 8 | pT stage | pT1: 00 (00%) |
| pT2: 14 (15.1%) |
| pT3: 34 (68%) |
| pT4a: 02 (20.4%) |
| pT4b: 00 (00%) |
| 9 | pN stage | pN0: 28 (56%) |
| pN1a: 08 (16%) |
| pN1b:0 6 (12%) |
| pN2a: 06 (12%) |
| pN2b: 02 (04%) |
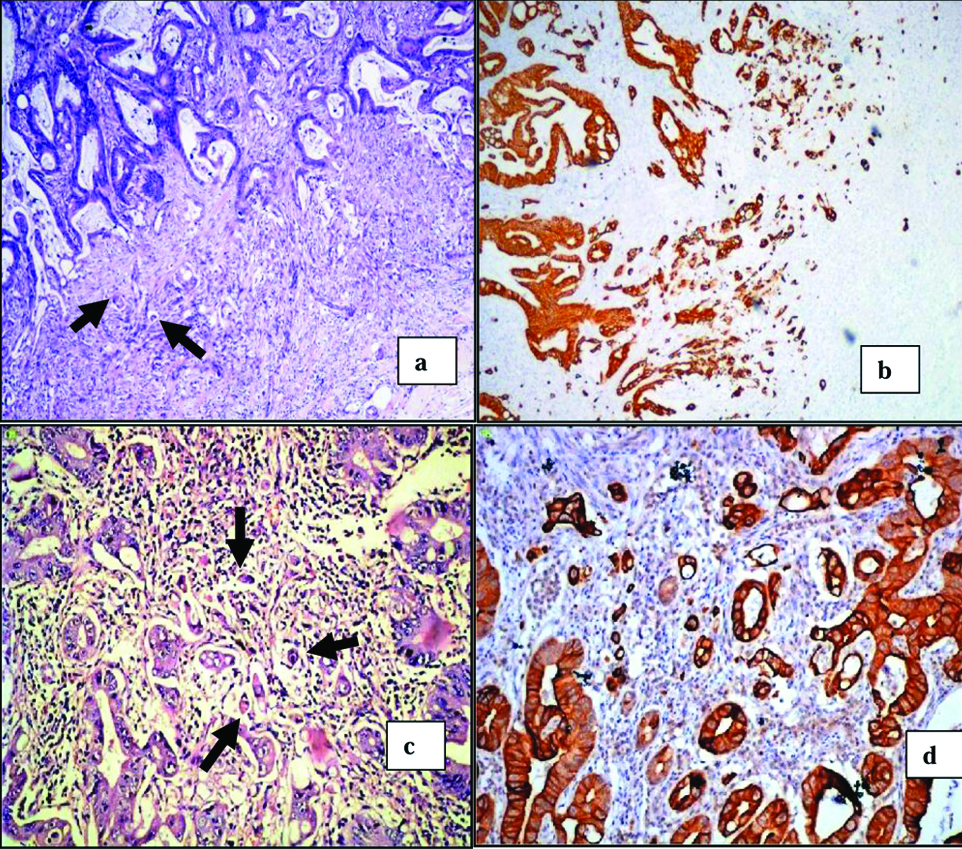
a) Peritumoural budding (arrows) at the invasive front of colorectal carcinoma (H&E,x40).
b) Peritumoural budding at the invasive front of colorectal carcinoma, showing increased detection of tumour buds via IHC CK 20 (IHC,x40).
c) Intratumoural budding (arrows) within the tumour of colorectal carcinoma (H&E, x400).
d) Intratumoural budding within the tumour of colorectal carcinoma, showing increased detection of tumour buds via IHC CK 20 (IHC, x400).
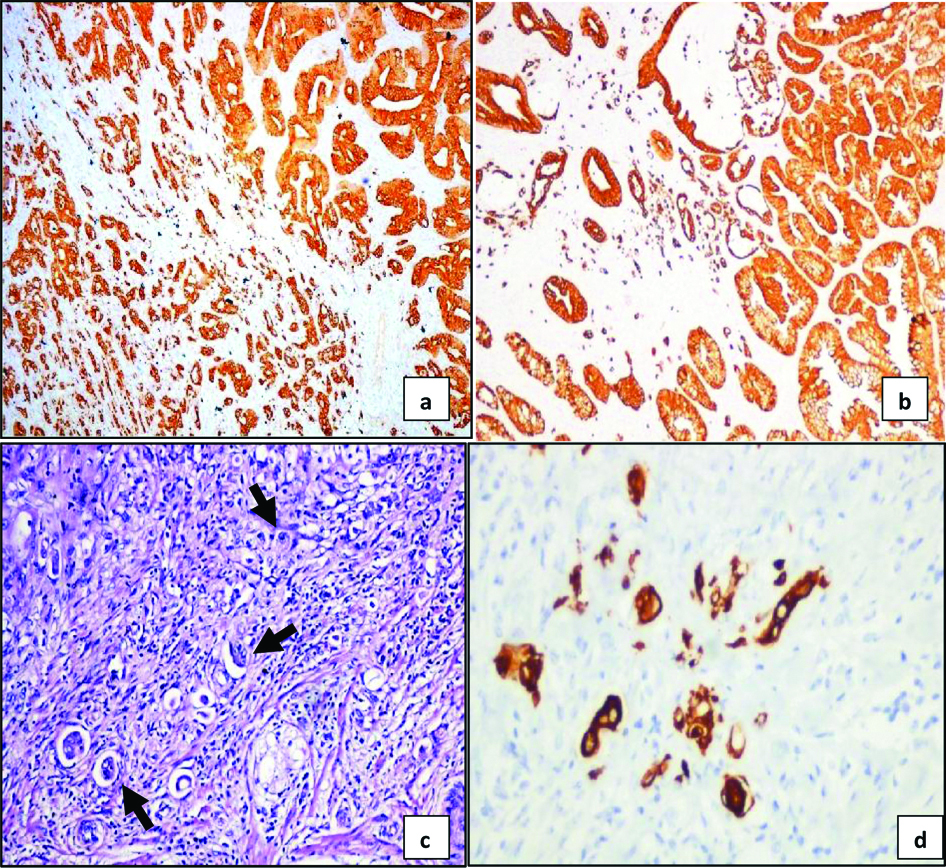
a) High grade peritumoural budding (≥10 buds) (IHC, x40).
b) Intratumoural buds counted within the tumour in 10 High power fields (IHC, x40).
c) Tumour buds seen as single cell or as cluster of ≤5 cells (arrows) in dense inflammatory and stromal reaction in H and E stained sections (H&E, x400).
d) IHC CK 20 stained section shows increase in tumour buds seen as single cell or as cluster of ≤5 cells (IHC, x400).
Topographic assessment of TB in CRC was done using descriptive statistics for PTB, ITB and OTB [Table/Fig-5]. Pearson’s correlation coefficient was done to measure the strength of the linear relationship between PTB, ITB and OTB [Table/Fig-6] and it also shows that PTB, ITB and OTB are interdependent to each other. All r values are above+0.60, the highest pearson’s r-value (0.94) was noted between OTB10HPF and PTB10HPF, and OTBHS and PTBHS (pearson’s r=0.93). Therefore, the findings [Table/Fig-5,6] display that OTB is better in evaluating TB in comparison to PTB and ITB.
Descriptive statistics for PTB, ITB and OTB (n=50).
| PTB10 HPF | ITB10 HPF | OTB10 HPF | PTBHS | ITBHS | OTBHS |
|---|
| Mean | 5.78 | 3.78 | 7.08 | 11.80 | 9.26 | 13.12 |
| Median | 4.00 | 3.00 | 5.50 | 10.00 | 8.00 | 10.50 |
| Minimum | 1 | 1 | 1 | 1 | 2 | 5 |
| Maximum | 22 | 14 | 24 | 55 | 34 | 46 |
PTB: Peritumoural budding; ITB: Intratumoural budding; OTB: Overall tumour budding; 10 HPF: 10 high power fields; HS: Hot spot
Pearson’s correlation coefficients (r) underlining the linear relationship between PTB, ITB and OTB (n=50).
| PTB10 HPF | ITB10 HPF | OTB10 HPF | PTBHS | ITBHS | OTBHS |
|---|
| PTB10 HPF | 1.0 | | | | | |
| ITB10 HPF | 0.71 | 1.0 | | | | |
| OTB10 HPF | 0.94 | 0.81 | 1.0 | | | |
| PTBHS | 0.89 | 0.64 | 0.86 | 1.0 | | |
| ITBHS | 0.58 | 0.90 | 0.72 | 0.57 | 1.0 | |
| OTBHS | 0.85 | 0.73 | 0.90 | 0.93 | 0.71 | 1.0 |
PTB: Peritumoural budding; ITB: Intratumoural budding; OTB: Overall tumour budding; 10 HPF: 10 high power fields; HS: Hot spot
A cut-off score of ≥10 buds for PTB counts, ≥5 buds for ITB counts and ≥8 and ≥14 for OTB10HPF and OTBHS were taken as high grade respectively. When budding scores were dichotomized [Table/Fig-7], significant association between PTB10HPF with inflammation and tumour size, ITB10HPF with gender, location and tumour size, OTB10HPF with tumour size, PTBHS with gender and OTBHS with gender and tumour size (all p<0.05) were reliably predicted. When continuous scores were used [Table/Fig-8], TB counts were significantly associated (p<0.05, all) with more advanced T-stage, presence of nodal metastasis, LVI, tumour grade and inflammation independent of the location of assessment (PTB, ITB or OTB, HS or 10 HPF). The assessments [Table/Fig-7,8] show continuous scores were better than cut-off scroes in evaluation of TB in CRC.
Association of clinicopathological features with PTB, ITB and OTB scores by cut-off scores using Wilcoxon rank sum test (n=50, All correlation p<0.05 values are shown in bold).
| PTB10 HPF | ITB10 HPF | OTB10 HPF | PTBHS | ITBHS | OTBHS |
|---|
| Gender | 0.217 | 0.020 | 0.079 | 0.028 | 0.418 | 0.018 |
| Location | 0.146 | 0.007 | 0.173 | 0.163 | 0.453 | 0.326 |
| pT | 0.201 | 0.497 | 0.247 | 0.144 | 0.686 | 0.432 |
| pN | 0.374 | 0.306 | 0.507 | 0.262 | 0.519 | 0.306 |
| LVI | 0.501 | 0.417 | 0.763 | 0.778 | 1.000 | 0.154 |
| Grade | 0.513 | 1.000 | 0.440 | 0.651 | 0.595 | 0.310 |
| Inflammation | 0.005 | 0.743 | 0.321 | 0.886 | 0.626 | 0.205 |
| Tumour size | 0.013 | 0.045 | 0.001 | 0.517 | 0.350 | 0.009 |
PTB: Peritumoural budding; ITB: Intratumoural budding; OTB: Overall tumour budding; 10 HPF: 10 high power fields; HS:Hot spot
Association of clinicopathological features with PTB, ITB and OTB scores by continuous scores using Wilcoxon rank sum test (n=50, All correlation p<0.05 values are shown in bold).
| PTB10 HPF | ITB10 HPF | OTB10 HPF | PTBHS | ITBHS | OTBHS |
|---|
| Gender | <0.0001 | <0.0001 | <0.0001 | <0.0001 | <0.0001 | <0.0001 |
| Location | <0.0001 | <0.0001 | <0.0001 | <0.0001 | <0.0001 | <0.0001 |
| pT | 0.0004 | 0.0786 | <0.0001 | <0.0001 | <0.0001 | <0.0001 |
| pN | 0.0004 | <0.0001 | 0.0001 | <0.0001 | <0.0001 | 0.0001 |
| LVI | <0.0001 | 0.001 | <0.0001 | 0.0001 | 0.0001 | 0.0001 |
| Grade | <0.0001 | <0.0001 | <0.0001 | <0.0001 | <0.0001 | <0.0001 |
| Inflammation | <0.0001 | 0.0002 | <0.0001 | <0.0001 | 0.0001 | 0.0001 |
| Tumour size | 0.286 | 0.001 | 0.612 | 0.0001 | 0.007 | <0.0001 |
PTB: Peritumoural budding; ITB: Intratumoural budding; OTB: Overall tumour budding; 10 HPF: 10 high power fields; HS: Hot spot
Discussion
TB in CRC has been studied comprehensively and brought TB into the clinical dominion as an additional prognostic parameter [6,14,22-25]. Several studies and meta-analyses established TB as an independent clinically significant risk factor for unfavourable outcomes in CRC [14,15,26-29].
According to the current TNM guidelines, presence of TB signify an aggressive phenotype, independent of staging. The advent of the era of personalised patient care as an upcoming concept of cancer treatment, inclusion of TB into the CRC TNM staging could aid in tailoring the treatment of choice especially in high risk subgroups requiring more rigorous treatment approaches, or its absence may aid decision-making in later stage cancers [15,25,28]. AJCC/UICC Stage II (pT3/4 N0 M0) CRC include heterogeneous group with highly variable outcomes having decreased 5-year survival rate from 66.5% (stage IIA) to 32.3% (stage IIC) and poor prognosis. This contrasts with 73.1% (stage IIIA) and 46.3% (stage IIIC) 5-year survival rate for node-positive patients [4,14].
Many studies demonstrated stage II CRC with high TB is associated with LVI, infiltrative tumour margin, higher tumour grade and linked to poor prognosis [14,30]. TB is useful in identifying sub groups of high risk within this population. The significantly worse outcome suggests that adjuvant chemotherapy should be considered in these patients. The presence of TB in stage II can be used as a parameter in making decisions of treatment [11,14,18,31]. In the current study also majority of TB were seen in pT3 and pN0 as mentioned in the literature by various studies [11,14,18,31].
Despite the numerous different methodologies using variable number of fields, field size and consisting of qualitative to semiquantitative to more quantitative assessments, in meta-analyses TB has sustained to come out as an independent prognostic factor in CRC [26,30]. In 2016 ITBCC [19] recommends standardised reporting of TB in CRC. These guidelines have been incorporated in College of American Pathologists (CAP) [32] cancer protocol for CRC along with the 8th edition of the AJCC staging manual [4] and also in the National Comprehensive Cancer Network (NCCN; version 2.2017) which is a current guideline in oncology clinical practice [33]. On histopathological examination by scanning power, evidences to the existence of TB consist of infiltrative growth pattern, blurring of tumour and underlying stromal interface, and invasive front with distinct irregularity. These features warn for evaluation by low and high power magnification [5]. There are certain situations on routine H&E staining, at the invasive front where the tumour and stroma interface TB may be obscured by dense inflammatory infiltrates and abundant stromal reaction, making it tough to differentiate between histiocytes, activated lymphocytes, stromal cells and real buds [5,18]. Many studies confirmed that the TB count is increased by use of cytokeratin stains [14,18,19].
In the present study, it was observed that TB on H&E was obscured by inflammatory and stromal reaction. In these cases after application of IHC, an increased rate of detection of TB was noted. This is similar to the evaluation done in various other studies [16,18,19,34].
The ITBCC also recommends hotspot method and ITB assessment [19]. A clear distinction regarding geographical distribution and method of analysis between PTB and ITB is not defined. In order to obtain clarity regarding this we evaluated as per Rieger G et al., in 10HPF areas of PTB and ITB and this data was then used to calculate an OTB score with regards to 10HPF and in the same way densest region of TB, considered as HS, was evaluated for PTB, ITB and OTB [16].
This was done to evaluate the impact of location on scoring. Statistically, all values of PTB, ITB and OTB significantly correlated with each other. The OTB recapitulated the association identified in PTB and ITB which suggest that the location does not play a role as long as the HS of TB is identified. This finding is in conjunction with the study published by Rieger G et al., in 2017 [16].
The distribution of TB across the range of values (i.e., continuous scores) provides hint for a useful/appropriate threshold value. An additional argument supporting a continuous count of TB can be made from the probability of having a clinically relevant outcome (such as lymph node metastasis) which may increase as the number of TB increases [13,16].
A significant association was observed between TB, gender, location, pT, pN, LVI, grade, inflammation and tumour size, all of which confirms a poor prognosis with continuous scores when compared to cut-off. This is similar to the observation made by Rieger G et al., in his study [16]. Cut-offs are frequently applied in pathology practice despite their limitations (tumour grade, LVI) however, in order to benefit from both types of data, it is recommended that the number of TB and a corresponding category (low-grade, high-grade) should be reported.
This is the collective histopathological study in Indian literature to the best of authors’ knowledge signifying an improvement in the overall detection of TB by CK20 in IHC stained sections.
Limitation
Limitations of the present study include small number of cases and no follow-up of the patients as they are referred elsewhere. Further studies are required to validate the utility of continuous scores in a larger cohort of patients with respect to lymph node and distant metastasis and disease specific and disease free survival. Also, its correlation to Microsatellite Instability (MSI) status has to be evaluated, and the subsequent decreased counts in the post Neoadjuvant Chemotherapy (NACT) resected specimens and its prognostic implication has to be evaluated.
Conclusion
TB is a potential and potent histopathological prognostic forecaster of lymph nodal metastasis and a higher stage of tumour and allocates as a marker for stratification of patients into high risk categories in CRC. The TB in routine histopathology report should be advocated by H&E staining aided by IHC. An OTB count in a single HS on CK 20 stained section excels in the assessment of TB as the OTB count encompasses the positive aspects of PTB and ITB and, show significant association with histopathological parameters. TB is a significant histopathological prognostic marker and can lead the treatment of choice in CRC. This emphasises the fact that there is merit in mentioning the TB in the histopathology report.
The aforementioned finding need to be evaluated with further studies and the impact of TB as a continuous variable on disease specific survival and disease free survival needs to be scrutinised.
PTB: Peritumoural budding; ITB: Intratumoural budding; OTB: Overall tumour budding; 10 HPF: 10 high power fields; HS: Hot spot
PTB: Peritumoural budding; ITB: Intratumoural budding; OTB: Overall tumour budding; 10 HPF: 10 high power fields; HS: Hot spot
PTB: Peritumoural budding; ITB: Intratumoural budding; OTB: Overall tumour budding; 10 HPF: 10 high power fields; HS:Hot spot
PTB: Peritumoural budding; ITB: Intratumoural budding; OTB: Overall tumour budding; 10 HPF: 10 high power fields; HS: Hot spot