Sartorius muscle is the muscle of anterior compartment of thigh. It is innervated by Nerve to Sartorius (NS), a branch of femoral nerve. Normally, NS originates from anterior division of femoral nerve. The pectineus muscle is the muscle of adductor compartment of thigh. Nerve to Pectineus (NP) innervates pectineus muscle [1].
Sartorius is responsible for abduction and outward rotation of the hip joint, flexion and inward rotation of knee joint. Overstraining of sartorius muscle as in jogging and swimming (breast stroking) may cause pes anserine bursitis. Pes anserine bursitis is most common in young individuals involved in sporting activities and in obese, middle-aged women [2,3]. Main function of pectineus is adduction of thigh and involved in groin strain. Groin strain often occurs in sports that require pivoting and quick changes of direction, such as soccer and hockey. The injury may range from mild pain in the adductor muscles to severe pain, tenderness, and inflammation in this area [1].
So, in case of injury to NS and NP or their Composite Fascicles (CFs), functions of sartorius and pectineus muscles are impaired. The information pertaining to impairment of functions of sartorius and pectineus muscles on account of injury to NS and NP and fascicles therein or in their extension in femoral nerve, are transmitted to and from the brain by these NS and NP through their fascicles. So, to restore the impairment by neural intervention at fascicular level [4], the configuration of pathways of CFs and distribution pattern of nerve fibers for innervations are necessary to be investigated for location, identification and longitudinal extension both ways, cranially and caudally in femoral nerve. The identification of pathways, configuration of CFs is usually done by high resolution MRI but it has limitations of resolution (accuracy of sampling interval) in recording and interpretation. This has inspired the author to carry out a histological experiment to overcome these limitations of MRI. Scanty literature is available regarding intraneural, internal or external morphological set up of CFs in the femoral in general and its branches NS and NP in particular. So NS and NP have been taken up to unfold identification, configuration and extension of pathways of CFs and distribution of nerve fibers in femoral nerve up to emergence of these nerves.
Therefore, a micro-anatomical study has been designed for revealing fascicular configuration, distribution and exploration of sharing of nerve fibres through tracking, the longitudinal pathways of CFs in femoral nerve terminating into emergence of sartorius and pectenius nerve.
Materials and Methods
The present study was a histological or microanatomical study which was conducted as histological workup from October 2017 to January 2018. A right femoral nerve [Table/Fig-1] was harvested from a 70-year-old female cadaver in the dissection hall of Anatomy department of AIIMS, Rishikesh, Uttaranchal, India. In our case NS emerged from lateral side of femoral trunk below the inguinal ligament and NP from the medial side of trunk of femoral nerve as usual. As transformational processes consisting of split, fusion and multiplexing, due to more transient dynamics of morphological changes in fascicular pathways and their organisational setup, are more frequent in this part [5,6] so right from upper most end of the femoral nerve to the emergence of NS and NP was considered for preparing closely sampled histological slides at 1 to 2 mm sample interval to record almost all the transformational processes. The measurements of the entire length of the femoral nerve were taken from inguinal ligament, a discernible landmark, in this region and blocks of 0.4 to 0.5 cm lengths were prepared.
In situ image of cropped femoral nerve with identification of nerve to sartorius and pectineus; FN=femoral nerve; P=nerve to pectineus; S=nerve to Sartorius; IL= Inguinal ligament
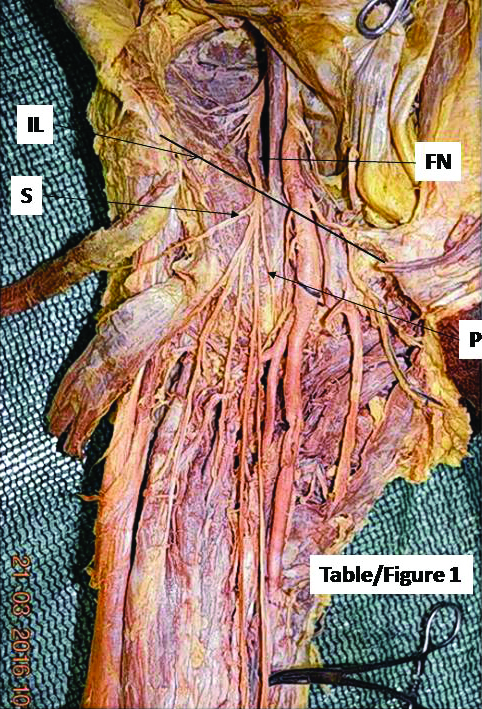
The cropped femoral nerve measuring 1.0 cm below and 8.9 cm above, so net 9.9 cm of femoral nerve, keeping inguinal ligament as origin (0.0 cm) was cut into 24 pieces, sequentially from proximal to distal end of femoral nerve. So, all the 24 blocks, (A1-A24) were processed to prepare 13 to 19 slides in 3 to 4 sets from each block. Typically, each block was trimmed 1 mm from the bottom by microtome. Then first set of 3/7 slides was processed. Similarly, second and third sets of 3/7 slides was prepared after trimming 1 mm each from the bottom of the block after each set in continuation. All the slides were stained with haematoxylin and eosin. This process was repeated for all the 24 blocks. Besides these 24 blocks, we have also prepared two more blocks (S1 and P1), one each from NS and NP at their emergence. After processing and staining by haematoxylin and eosin, these slides were photographed by 16 mega pixel Sony camera under a high resolution microscope of model PZRM-26 having software “Future Winjoe”. After this, the CFs were named from CFs 1 to 21 [Table/Fig-2] in the cranial most slide A1 8 correlated down to A24 1 from proximal to distal.
Slide A1 8: CF=composite fascicle; CFs named from CF 1 to CF 21, NS=nerve to sartorius enveloped by yellow colour; NP=nerve to pectineus enveloped by blue colour; D=dorsal, V=ventral, M=medial
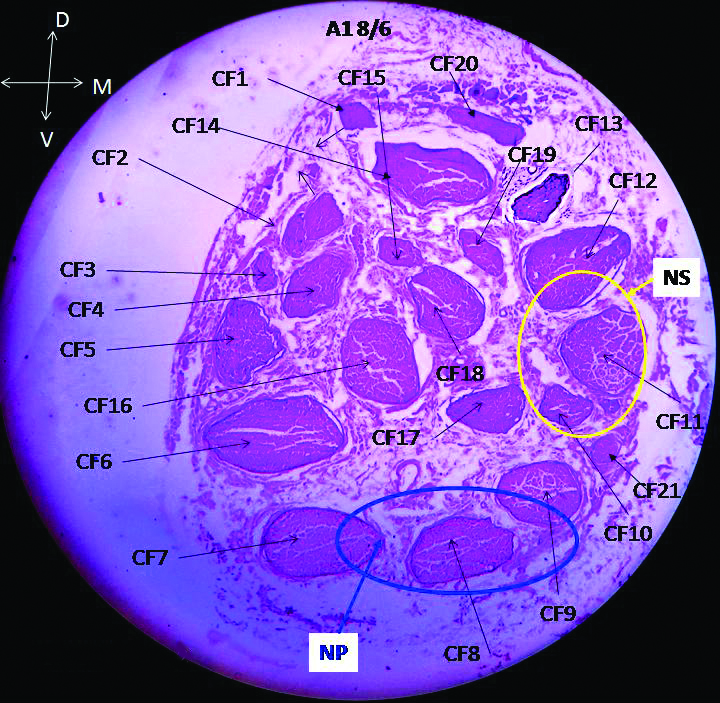
Correlation and tracking of CFs: All the CFs participating in formation of NS and NP in slides from A1 8 through A24 1 were tracked, correlated and interpreted for identification, shape, size, continuity, consistency and transformational processes of CFs [Table/Fig-3,4] in femoral nerve and in first block of NS and NP up to slides S1 1 and P1 1 at their emergence. The methodology adopted for correlation was placement of consecutive slides side by side caudally and cranially and compared all the fascicles in both sections on the basis of correlation parameters. The correlation parameters used were location (Dorsal, Ventral, Lateral and Medial; Central or peripheral), shapes (circular, oval and irregular), sizes (large, medium and small), orientation, split, fusion, migration and multiplexing. Lateral and medial sides and dorsal and ventral faces were marked by tissue marker with colour code for lateral, medial, dorsal and ventral sides for our reference. As soon as intra-block correlation was over; the similar methodology was adopted for inter-block (A1 through A24) correlation through sequential slides. As long as the CF was found consistent and continuous during correlation in different sections in (proximal to distal) cranial to caudal direction, the same number was retained but when any CF underwent transformational processes [Table/Fig-5a,b; 6a,b; 7a,b], after crossing over the point of inflexion, a sequential new unique identity numbers were given to new CFs so formed.
Correlation of CFs participating in formation of nerve to sartorius. Level of slides=Represent the distance of slide from Inguinal ligament; involved sections=Represent the consecutive section between which transformational process is taking place; participating CFs in transformation=The CFs numbers contributing fully to Nerve to sartorius are made complete bold and those contributing partly are marked by star and made partly bold; T process=Transformational process; new CFs named after transformation; S=Split; F=Fusion; M=Multiplexing; SC=Shape change
| Level of slides (cm) | Involved sections | Participating CF’s | T Process | New CF’s |
|---|
| 8.60275 | 8.50225 | A1 6-A1 5 | 10+11, 12* | F | 23, 22* |
| 8.20475 | 8.10425 | A2 10-A2 9 | 23 | S | 23.1; 23.2 |
| 8.10275 | 8.00225 | A2 6-A2 5 | 23.1 | S | 29; 30 |
| 8.00025 | 7.80725 | A2 1-A3 15 | 29, 23.2 | F | 31 |
| 7.60025 | 7.40675 | A3 1-A4 14 | 22*, 30 | F | 39* |
| 7.30275 | 7.20225 | A4 6-A4 5 | 39*, 31 | F | 45* |
| 7.20025 | 7.00575 | A4 1-A5 12 | 45* | S | 45.1, 2*, 3 |
| 6.80025 | 6.60725 | A5 1-A6 15 | 45.2* | S | 58*+57 |
| | | 45.3, 57 | F | 57′ |
| 6.40025 | 6.20525 | A6 1-A7 11 | 58* | S | 65, 66 |
| 5.80525 | 5.70475 | A8 11-A8 10 | 66 | S | 66a, 66b |
| 5.20025 | 5.00725 | A9 1-A10 15 | 76d, 66b, 80 | F | 94* |
| | | 57′, 27′ | F | 95* |
| 5.00525 | 4.90475 | A10 11-A10 10 | 94* | S | 100*, 101* |
| | | 95*, 90 | M | 95a, 102* |
| 4.90275 | 4.80225 | A10 6-A10 5 | 102* | S | 109, 110* |
| 4.80025 | 4.60675 | A10 1-A11 14 | 95a, 106, 110* | M | 112, 113* |
| 4.60475 | 4.50425 | A11 10-A11 9 | 113*, 112 | F | 117*, 113a |
| 4.50275 | 4.40225 | A11 6-A11 5 | 99, 100*, 101* | F | 118* |
| | | 66a, 117 | M | 119, 120, 121, 122 |
| 4.40025 | 4.20725 | A11 1-A12 15 | 122* | SC | 122a* |
| | | 118* | S | 129*, 130, 131 |
| 4.20525 | 4.10475 | A12 11-A12 10 | 129* | S | 133, 134 |
| 4.10275 | 4.00225 | A12 6-A12 5 | 119+134 | F | 138* |
| 4.00025 | 3.80675 | A12 1-A13 14 | 122a* | S | 145*, 146 |
| | | 133, 138* | F | 142* |
| 3.80475 | 3.70425 | A13 10-A13 9 | 145* | S | 150, 151 |
| | | 142* | S | 142′+142″ |
| 3.70275 | 3.60225 | A13 6-A13 5 | 150+142′ * | M | 155+156+161 |
| 3.60025 | 3.40675 | A13 1-A14 14 | 155, 156, 161 | F | 166* |
| 3.40475 | 3.30425 | A14 10-A14 9 | 166* | S | 174, 175* |
| 3.30275 | 3.20225 | A14 6-A14 5 | 167, 175* | M | 180, 181, 182 |
| 3.00475 | 2.90425 | A15 10-A15 9 | 157, 181 | F | 190* |
| | | 174 | SC | 193 |
| | | 180, 186 | F | 192* |
| 2.90225 | 2.80175 | A15 5-A15 4 | 193, 194, 195 | F | 196* |
| | | 191, 192* | F | 197* |
| 2.80025 | 2.60725 | A15 1-A16 15 | 185, 190*, 197, 199 | M | 204*, 205*, 206 |
| 2.60525 | 2.50475 | A16 11-10 | 204* | S | 207*, 208 |
| 2.50275 | 2.40225 | A16 6-A16 5 | 188, 207 | M | 210*, 211 |
| | | 205* | S | 215, 216* |
| 2.40025 | 2.20675 | A16 1-A17 14 | 196* | S | 217, 218* |
| 2.10275 | 2.00225 | A17 6-A17 5 | 216* | S | 219, 220 |
| | | 218* | S | 218a+218b |
| | | 210*, 212, 200 | M | 221, 222, 223, 224, 225 |
| 1.70275 | 1.60225 | A18 6-A18 5 | 218a+CF215 | F | 242 |
| 1.30275 | 1.20225 | A19 6-A19 5 | 224, 242 | F | 254 |
| 1.00525 | 0.90475 | A20 11-A20 10 | 254 | S | 272, 273 |
| 0.40025 | 0.20825 | A21 1-A22 17 | 272, 273, 219 | M | 289, 290 |
| IL0.00025 | -0.29275 | A22 1-A23 15 | 290 | S | 298, 299 |
| -0.39725 | -0.49975 | A23 6-A23 1 | 289 | S | 307, 308, 309 |
| -0.49975 | | After A23 1 | 307, 308, 309, 298, 299 | As NS | Emerged out |
Correlation of CFs participating in formation of Nerve to Pectineus. Level of slides=Represent the distance of slide from Inguinal ligament; involved sections=Represent the consecutive section between which transformational process is taking place; participating CFs in transformation=The CFs numbers contributing fully to Nerve to pectineus are made complete bold and those contributing partly are marked by star and made partly bold.; T process=Transformational process; new CFs named after transformation; S=Split; F=Fusion; M=Multiplexing; SC=Shape change
| Level of slides in mm | Involved sections | Participating CF’s | TP | New CF’s |
|---|
| A1 8-A1 1 | 7*, 8, 9* | | |
| 8.50025 | 8.30925 | A1 1-A2 19 | 8 | S | 8.1+8.2 |
| 8.30775 | 8.20725 | A2 16-A2 15 | 7*+8.1 | F | 26 |
| 8.20475 | 8.10425 | A2 10-A2 9 | 26 | S | 26a*+26b |
| | | 9*+8.2 | F | 27* |
| 7.60025 | 7.40675 | A3 1-A4 14 | 34*+26a* | F | 40 |
| 7.20025 | 7.00575 | A4 1-A5 12 | 40+27* | M | 40′*+27′ |
| 6.80025 | 6.60725 | A5 1-A6 15 | 40′* | S | 52*+53 |
| 5.60225 | 5.60025 | A8 5-A8 1 | 83+52* | F | 86* |
| 5.20025 | 5.00725 | A9 1-A10 15 | 86* | S | 92*+93 |
| | | 47a+27′ | F | 95* |
| 5.00525 | 4.90475 | A10 11-A10 10 | 95*+90 | M | 95a+102* |
| 4.90275 | 4.80225 | A10 6-A10 5 | 92* | S | 107+108 |
| | | 102* | S | 109+110* |
| 4.80025 | 4.60675 | A10 1-A11 14 | 95a+106+110* | M | 112+113* |
| | | 108+109 | F | 109a |
| 4.60475 | 4.50425 | A11 10-A11 9 | 107+109a | F | 116* |
| | | 113* | S | 113a+113b* |
| | | 113b*+112 | F | 117 |
| 4.50275 | 4.40225 | A11 6-A11 5 | 66a+117 | M | 119+120+121*+122* |
| | | 116*+113a | M | 123*+124 |
| 4.40025 | 4.20725 | A11 1-A12 15 | 123*+124+121* | F | 127* |
| | | 122* | SC | 122a* |
| 4.00025 | 3.80675 | A12 1-A13 14 | 122a* | S | 145*+146 |
| | A13 10-A13 9 | 145* | S | 150+151 |
| 3.70275 | 3.60225 | A 13 6- A13 5 | 127* | S | 158*+159+160 |
| 3.60025 | 3.40675 | A13 1-A14 14 | 158* | S | 168+169 |
| | | 146+160 | F | 157 |
| 3.20025 | 3.00625 | A14 1-A15 13 | 169+182+151 | M | 185*+186 |
| 3.00475 | 2.90425 | A15 10-A15 9 | 157+181 | F | 190 |
| 2.80025 | 2.60725 | A15 1-A16 15 | 185*+190, | M | 205*+206 |
| 2.50275 | 2.40225 | A16 6-A16 5 | 205* | S | 215+216* |
| 2.10275 | 2.00225 | A17 6-A17 5 | 206 | S | 213+214 |
| | | 216* | S | 219+220 |
| 1.70275 | 1.60225 | A18 6-A18 5 | 213+214 | F | 238 |
| -0.29475 | -0.39525 | A23 11-A23 10 | 238 | S | 305+306 |
| -0.89975 | -0.89975 | After A24 1 | 220+305+306 | NP | Emerged out |
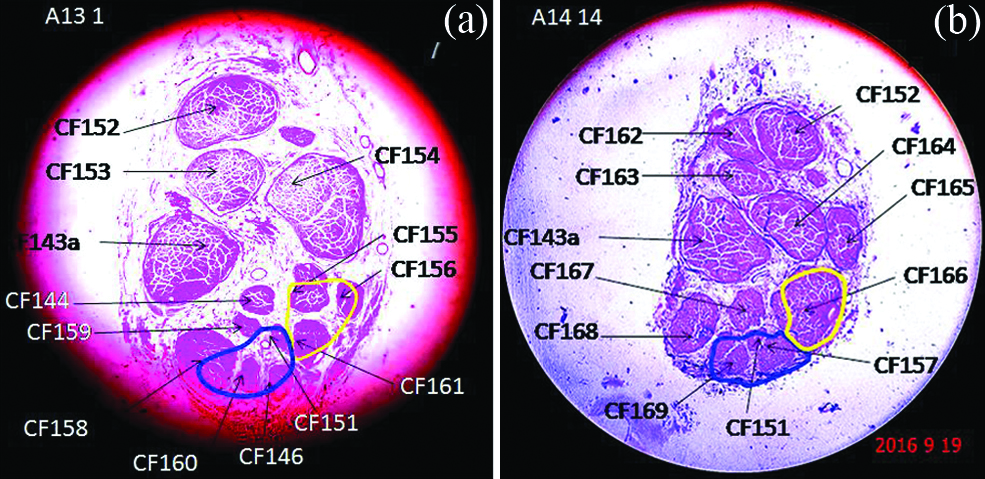
A typical example of split and fusion from A13 1 to A14 14 and mapping of NS and NP.
CF=composite fascicle; CF153 split into CFs 162 and 163; CF 154 split into CFs 164 and 165; CFs 155, 156 and 161 fused into 166; CFs 144 and 159 fused into 167; CFs 146, 160 fused into 157; CF 158 split into 168 and 169.
The CF 155 contributes partially and CFs 156 and 161 contribute fully as enveloped in yellow colour in slide A13 1 to nerve to sartorius (yellow) which in A14 14 is formed partially by CF 166 whereas Nerve to pectineus (blue) has partial contribution from 158 and full from 146, 151 and 160 in A13 1 and full contribution from 151, 157 and 169 in slide A14 14.
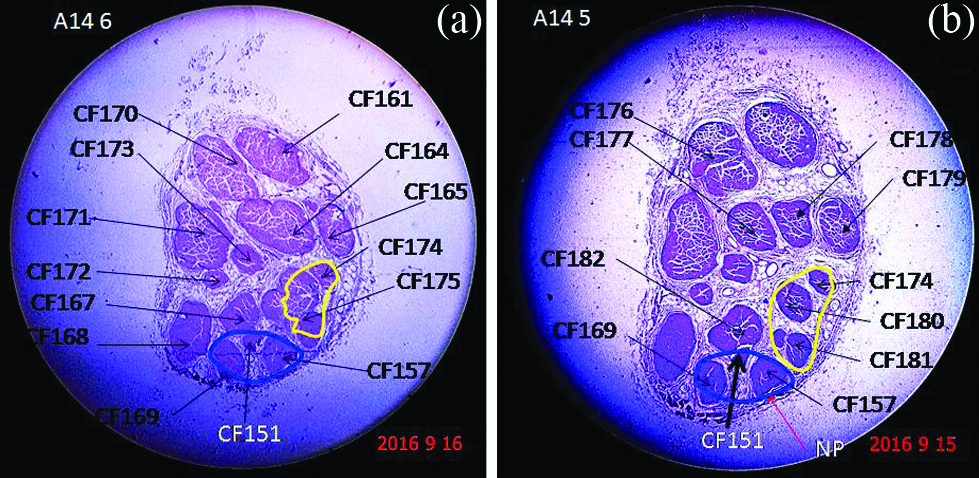
A classic example of two multiplexing processes and mapping of NS and NP in A14 6 and A14 5.
CF 164, CF 165 and CF 170 multiplexed transforming into CF 176, CF 177, CF 178 and CF 179. CF 167 and CF 175 multiplexed transforming into CF 180, CF 181 and CF 182.
CF 175 contributes partially and CF 174 contribute fully in slide A14 6 to nerve to Sartorius (yellow) which in slide A14 5 is formed fully by CFs 180, 181 and 174. In both slides A14 6 and A14 5 nerve to pectineus (blue) is formed fully by CFs 151, 157 and 169.
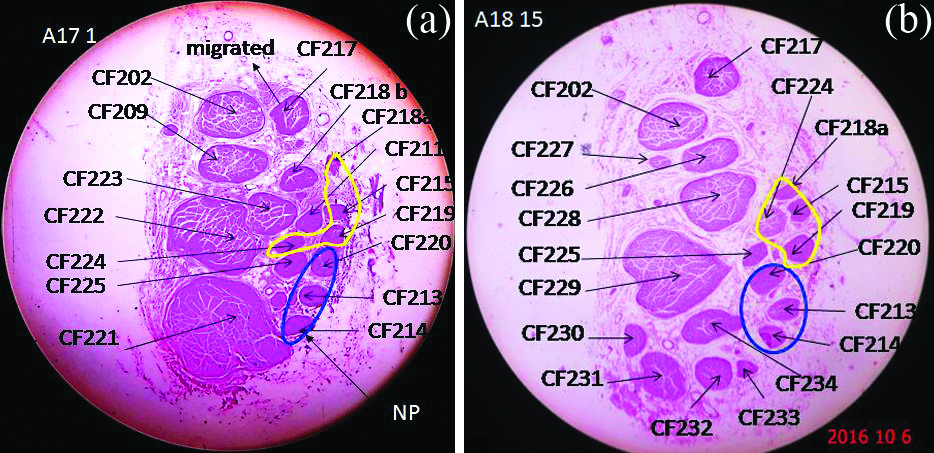
Typical slide showing transformational processes like split, fusion and multiplexing in CFs of A18 15 from A17 1 and mapping of NS and NP.
CF 209 split into CF 226 and CF 227; CF 223, CF 218b and CF 211 fused into CF 228; CF 221 and CF 222 multiplexed into CF 229, CF 230, CF 231, CF 232, CF 233 and CF 234.
In slide A171 CFs 219, 215, 218a, 224 contribute fully to Nerve to Sartorius (yellow) whereas in slide A18 15 CFs 219, 215, 218a, 224 contribute fully to nerve to sartorius. CFs 220+213+214 contribute fully to nerve to pectineus (blue) in slides A17 1 and A18 15.
Thus, all the sections were correlated and pathways of CFs were identified from top slide to the emergence of NS and NP and then the correlation of CFs in slides of branch nerves NS and NP was also done in slides S1 1 and P1 1. The correlation of fascicles was also done beginning from 1st slide S1 and P1 of NS and NP through A24 block up to the top of femoral nerve from distal (A24 block) to proximal (A1 block). The position of transformational processes including continuity and consistency were determined in the slides from inguinal ligament as all the sections were calibrated in distance from inguinal ligament.
Modelling of fascicular pathways: The data in tables present models of pathways of CFs of NS and NP. The 3D model of pathways of these contributing fascicles would have been too complex to be drawn therefore; the same CF’s data would be stored in tables to provide a sense of continuous and consistent pathways of CFs interrupted by transformational processes. The intervals of consistent pathways of these CFs contributing to NS and NP in each slide would be shown. The group of CFs constituting NS and NP would also be tracked in each slide. All these data set would be shown in tables.
Results
Based on physical examination, NS and NP emerged out from lateral and medial side of femoral nerve at distances of 0.5 and 0.9 cm below the inguinal ligament respectively [Table/Fig-1]. The tracking, correlation and interpretation of CFs revealed the formation of NS and NP after A23 1 [Table/Fig-8] and A24 1[Table/Fig-9], their point of emanation was situated at 0.49975 cm and 0.89975 cm respectively below inguinal ligament. These distances established a good matching between physical measurements and computed by slide planning and preparation.
Emergence of nerve to sartorius: Nerve to sartorius (yellow) consisting of CFs 298, 299, 307, 308, 309 emerged out after A23 1 as it is not seen in A24 14. CFs contributing to nerve to pectineus in slides are 220, 305, 306, NS-nerve to sartorius.
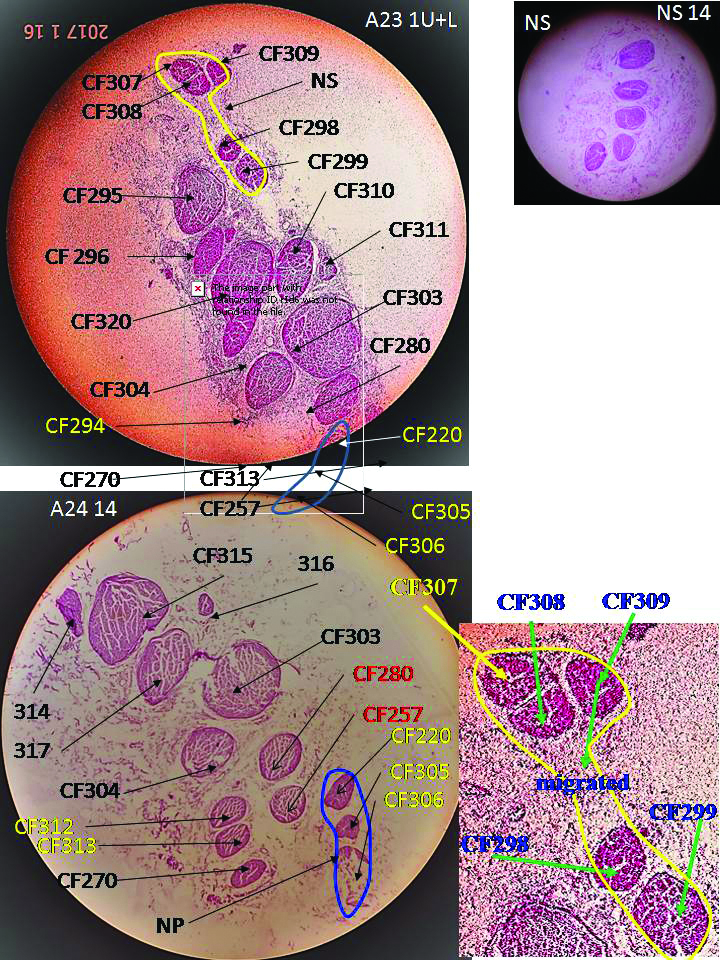
Nerve to pectineus consisting of CFs 220, 305, 306 emerged out after A24 1.
A huge data volume was generated out of the experimental research work consisting of 24 blocks from femoral nerve and two blocks, one each from NS and NP, each of length 4/5 mm. All the 26 blocks were processed for 344 slides consisting of images of 5400 CFs. These CFs were consolidated into 318 through tracking, correlating and interpreting all the 21 CFs in A1 8 passing through 209 transformational processes. The CFs, 10, 11, 12 and 7, 8, 9 fully or partially contributing to NS and NP underwent 82 transformational processes transforming into CFs, 298, 299, 307, 308, 309 forming NS at emergence in A23 1 and 220, 305, 306 forming NP at emergence in A24 1.
Correlation results: The tracking, correlation and interpretation of CFs in histological slides from A1 8 in which the CFs were named (CF1-21) to A24 1 (the point of emergence of NP) portrayed good matching of CFs in the same set of slides (such as A2 19-A2 16 etc.,) barring few exceptions (A8 2-3). The correlation between two sets of slides too was found satisfactory except when it is disturbed by multiplexing. The inter-block (Block A1 1, A2 19 etc., here A1 1 is the caudal most slide of block A1 and A2 19 is the cranial most slide of block A2) tracking and correlation was also found matching with good level of confidence. Thus, the correlation of CFs was extended in all the blocks and thereby in all slides. This tracking brought out continuity, consistency and correlativity of CFs interrupted by transient dynamic processes and changes in shapes, sizes and orientations causing plexiforms [6]. The CFs correlation data pertaining to exclusively NS and NP formation in their entire pathways were presented in [Table/Fig-3,4]. Besides, the mapping of NS and NP through correlation of group of CFs contributing to NS and NP, was also carried out in all the slides [Table/Fig-10,11]. The positions of transformational processes with reference to inguinal ligament of all these histological sections were also labelled and recorded in these tables. Normally the changes in these processes were regular but in a few cases, the transformational processes occurred instantly as observed in the consecutive slides A8 2-3, at the interval of 5 micron. The consolidation of correlation, tracking and interpretation of the occurrences of these dynamic changes brought out two tabular models both for NS and NP as illustrated below to comprehend the pathways of CFs contributing to NS and NP.
Mapping of Nerve to sartorius in the slides from A1 8 through A23 1.
| Slides | Group of CFs in NS | CCC between (cm) | CCC Interval (cm) |
|---|
| A1 8-6 | 10+11+12* | 8.60375-8.60275 | 0.001 |
| A1 5/1-A2 10 | 22*+23 | 8.50225-8.20475 | 0.2975 |
| A2 9/6 | 23.1+23.2+22* | 8.10425-8.10275 | 0.0015 |
| A2 5/1 | 23.2+30+29+22 | 8.00225-8.00025 | 0.002 |
| A3 15/1 | 31+30+22 | 7.80725-7.60025 | 0.207 |
| A4 14/6 | 31+39 | 7.40675-7.30275 | 0.104 |
| A4 5/1 | 45 | 7.20225-7.20025 | 0.002 |
| A5 12/1 | 45.2+45.3 | 7.00575-6.80025 | 0.2055 |
| A6 15/12 | 57+45.3+58 | 6.60725-6.60575 | 0.0015 |
| A6 11/1 | 57′+58 | 6.50525-6.40025 | 0.105 |
| A7 11-A8 11 | 66+57′ | 6.20525-5.80525 | 0.4 |
| A8 10-A9 1 | 66b+66a+57′ | 5.70475-5.20025 | 0.5045 |
| A10 15/11 | 94*+95*+66a | 5.00725-5.00525 | 0.002 |
| A10 10/6 | 101*+100*+95a+66a+102 | 4.90475-4.90275 | 0.002 |
| A10 5/1 | 101*+100*+95a+66a+110* | 4.80225-4.80025 | 0.002 |
| A11 14/10 | 101*+100*+113*+66a | 4.60675-4.60475 | 0.002 |
| A11 9/6 | 101*+100*+117*+66a | 4.50425-4.50275 | 0.0015 |
| A11 5/1 | 122+118+119 | 4.40225-4.40025 | 0.002 |
| A12 15/11 | 122a+129+119 | 4.20725-4.20525 | 0.002 |
| A12 10/6 | 122a*+133+119 | 4.10475-4.10275 | 0.002 |
| A12 5/1 | 122a*+133+138 | 4.00225-4.00025 | 0.002 |
| A13 14/10 | 145+142* | 3.80675-3.80475 | 0.002 |
| A13 9/6 | 150+142′ | 3.70425-3.70275 | 0.0015 |
| A13 5/1 | 155+156+161 | 3.60225-3.60025 | 0.002 |
| A14 14/10 | 166 | 3.40675-3.40475 | 0.002 |
| A14 9/6 | 175*+174 | 3.30425-3.30275 | 0.0015 |
| A14 5- A15 10 | 181+180+174 | 3.20225-3.00475 | 0.1975 |
| A15 9/5 | 193+192*+190* | 2.90425-2.90225 | 0.002 |
| A15 4/1 | 196*+197*+190* | 2.80175-2.80025 | 0.0015 |
| A16 15/11 | 196*+204*+205* | 2.60725-2.60525 | 0.002 |
| A16 10/6 | 196*+207*+205* | 2.50475-2.50275 | 0.002 |
| A16 5/1 | 196*+210*+215+216* | 2.40225-2.40025 | 0.002 |
| A17 14/6 | 218*+215+216*+210* | 2.20675-2.10275 | 0.104 |
| A17 5/1-A18 6 | 219+215+218a+224 | 2.00225-1.70275 | 0.2995 |
| A18 5/1-A19 6 | 219, 224, 242 | 1.60225-1.30275 | 0.2995 |
| A19 5/1-A20 11 | 219, 254 | 1.20225-1.00525 | 0.197 |
| A20 10-A21 1 | 219, 272, 273 | 0.90475-0.40025 | 0.5045 |
| A22 17-A22 1 | 290, 289 | 0.20825-0.00025 | 0.208 |
| A23 15/6 | 289, 298, 299 | -0.29275+0.39725 | 0.1045 |
| A23 5/1 | 298, 299, 307, 308, 309 | -0.49775+0.49975 | 0.002 |
| A23 1 | 298, 299, 307, 308, 309 | -0.49975 | NS emerged out |
This table shows correlation of group of fascicles constituting NS, their continuity, consistency and correlativity. Only those slides are given between which fascicles are correlatable, consistence and continuous. CCC between (cm): levels of slides between which the group of CFs are continuous, consistent and correlatable. CCC interval (cm): interval of continuity, consistency and correlativity of group of CFs. CCC=Continuous, Consistent and Correlatable
Mapping of nerve to pectineus in the slides from A1 8 through A24 1.
| Slides | Group of CFs in NP | C CC between (cm) | C CC Interval (cm) |
|---|
| A1 8-A1 1 | 7*+8+9* | 8.60375- 8.50025 | 0.1035 |
| A2 19/16 | 7*+8.1+9*+8.2 | 8.30925-8.30775 | 0.0015 |
| A2 15/10 | 26*+9*+8.2 | 8.20725-8.20475 | 0.0025 |
| A2 9-A3 1 | 26a*+27* | 8.10425-7.60025 | 0.5040 |
| A4 14/1 | 40*+27* | 7.40675-7.20025 | 0.2065 |
| A5 12/1 | 40′*+27′ | 7.00575-6.80025 | 0.2055 |
| A6 15-A8 3 | 52*+27′ | 6.60725-5.60125 | 1.006 |
| A8 2-A9 1 | 86*+27′ | 5.60075-5.20025 | 0.4005 |
| A10 15/11 | 92*+95* | 5.00725-5.00525 | 0.002 |
| A10 10/6 | 92*+102* | 4.90475-4.90275 | 0.002 |
| A10 5/1 | 108+109+110* | 4.80225-4.80025 | 0.002 |
| A11 14/10 | 109a+113** | 4.60675-4.60475 | 0.002 |
| A11 9/6 | 117+116*+113a | 4.50425-4.50275 | 0.0015 |
| A11 5/1 | 122+123*+124+121* | 4.40225-4.40025 | 0.002 |
| A12 15/1 | 122a+127* | 4.20725-4.00025 | 0.207 |
| A13 14/10 | 146+127*+145* | 3.80675-3.80475 | 0.002 |
| A13 9/6 | 146+127*+151 | 3.70425-3.70275 | 0.0015 |
| A13 5/1 | 146+160+158*+151 | 3.60225-3.60025 | 0.002 |
| A14 14/1 | 151+157+169 | 3.40675-3.20025 | 0.2065 |
| A15 13/10 | 185*+157 | 3.00625-3.00475 | 0.0015 |
| A15 9/1 | 190+185* | 2.90425-2.80025 | 0.104 |
| A16 15/6 | 205+206 | 2.60725-2.50275 | 0.1045 |
| A16 5-A17 6 | 216*+213+214 | 2.40225-2.10275 | 0.2995 |
| A17 5-A18 6 | 220+213+214 | 2.00225-1.70275 | 0.2995 |
| A18 5-A23 15/11 | 220+238 | 1.60225-(-0.29275) | 1.895 |
| A23 10-A24 1 | 220, 305, 306 | -0.39525-(-89975) | 0.5045 |
| After A24 1 | 220, 305, 306 | NP emerged out | |
This table shows correlation of group of fascicles constituting NP, their continuity, consistency and correlativity. Slides=Only those slides between which fascicles are correlatable, consistence and continuous. CCC between (cm): levels of slides between which the group of CFs are continuous, consistent and correlatable. CCC interval (cm): interval of continuity, consistency and correlativity of group of CFs. CCC=continuous, consistent and correlatable
Table model NS: The correlation of CFs (1-21) from top most slide A1 8 to A23 1 revealed that the CF 10, 11 and 12 located in the medial side at periphery of femoral nerve in A1 8, were the main {CF 10, 11 (fully) and 12 (partly)} contributors to NS. These CFs underwent 49 transformational process (21 splits, 19 fusions and 9 multiplexings) transforming into CFs 298, 299, 307, 308 and 309 [Table/Fig-3] forming NS ready to emerge in section, A23 1 [Table/Fig-8]. These CFs present in A23 1 were matching with those present in the slides S1 1 prepared from first block of NS. These CFs were found absent in A24 15. The continuity, consistency and correlativity of the group of CFs contributing to NS in each slide and the positions of group of CFs were also shown in [Table/Fig-3]. Furthermore, widespread individual CFs less affected by transformational processes was presented [Table/Fig-12]. For example-CF23 remained continuous, consistent and extendable between the slides A1 5-A2 9 for 3 mm. These tables together draw clear picture of pathways of CFs contributing to NS.
Computation of continuity, consistency and correlativity of selected CFs of nerve to sartorius.
| Contributing CFs | Sections/slides | CCC Interval (mm) | Placement between (cm) |
|---|
| CF23 | A1 5-A2 9 | 3.98 | 8.50225-8.10425 |
| CF22 | A1 5-A3 1 | 9.02 | 8.50225-7.60025 |
| CF30 | A2 5-A3 1 | 4.02 | 8.00225-7.60025 |
| CF31 | A3 15-A4 6 | 5.045 | 7.80725-7.30275 |
| CF45.3 | A5 12-A6 12 | 4.0 | 7.00575-6.60575 |
| CF57/57′ | A6 15-A9 1 | 14.07 | 6.60725-5.20025 |
| CF66/66a | A711-A11 6 | 17.025 | 6.20525-4.50275 |
| CF100+101 | A10 10-A11 6 | 4.02 | 4.90475-4.50275 |
| CF122/122a | A11 5-A12 1 | 4.02 | 4.40225-4.00025 |
| CF196 | A15 4-A16 1 | 4.015 | 2.80175-2.40025 |
| CF215+216 | A165-A17 6 | 3.045 | 2.40225-2.10275 |
| CF219 | A17 5-A21 1 | 16.02 | 2.00225-0.40025 |
| CF219+272+273 | A20 10-A21 1 | 5.045 | 0.90475-0.40025 |
Contributing CFs are CFs contributing to NS which are more continuous, consistent and correlatable. Slides/sections=represents the slides between which the CF is continuous, consistent and correlatable. CCC interval (mm)=represents the interval in millimetres in which CFs are continuous, consistent and correlatable. Placement between: represents the calibrated labels in distance from inguinal ligament. The stimulating electrodes can be placed within this interval. CCC=continuous, consistent and correlatable
Table model NP: The main contributors of NP, CFs 7, 8 and 9 out of 21 CFs in cranial most slide A1 8 were located in the ventral periphery of femoral nerve. The correlation of these CFs down to A24 1 and vice-versa brought out that these CFs were transformed into CFs 220, 305 and 306 in A24 1 having undergone 33 transformational processes (Split-14, Fusion-12, and Multiplexing-7). The CFs 220, 305 and 306 were correlating with those found in the slide P1 1 [Table/Fig-9]. These CFs were missing from the sections after A24 1. This together with location of point of emergence of NP substantiated the correlation of CFs. These were also observed surrounded by internal epineurium before emergence of NP. The detailed tracking and correlation of data revealed the clear picture of pathways of CFs of NP from its emergence passing through transformational processes to CF 7, 8 and 9 [Table/Fig-4]. Then the group of CFs constituting NP were sorted in all the slides beginning from A24 1 (emergence of NP) to first cranial most slide A1 8. Slide wise and group wise continuity, correlativity and consistency were also computed [Table/Fig-11]. The continuity, correlativity and consistency are crucial and important in entire pathways of CFs contributing to NP for placement of electrode for intraoperative or otherwise stimulation.
During evolving these models of pathways of NS and NP, typically relevant and exemplary transformational processes, split, fusion and multiplexing, have been presented in three pairs of transitional slides, A13 1 and A14 14, A14 6 and A14 5, A17 1 and A18 15. The description of these processes appended below:
1. A typical example of split and fusion between A13 1 and A14 14 [Table/Fig-5a,b].
CF 153 in A13 1 split into CF 162 and 163 in A14 13. CF154 in A13 1 split into 164 and 165 in A14 13. CF155, 156, and 161 in A13 1 fused into 166 in A14 13. CF144, 159 in A13 1 fused forming CF167 in A14 13. CF146, 160 in A13 1 fused into CF157 in A14 13. CF158 in A13 1 splits into 168 and 169 in A14 13. The highlighted CFs without star are fully and those with star are partly contributing to NS and NP as explained below by mapping of these nerves using symbols and also elaborated in [Table/Fig-3]. NS=155*+156+161 and NP=146+160+158*+151 in slide A13 1. These two symbolic statements show that CFs 156, 161 fully and CF155 partly together with the CFs 146, 151, 160 fully and CF158 partly contribute to NS and NP respectively in the slide A13 1. Then these CFs, after having undergone transformational processes, form NS and NP as-NS=166* means, as CFs 155, 156 and 61 fused together forming 166 so now the larger fascicle will partly contribute to NS whereas CFs 146, 160 fused into 157 and 158 split into 168 and 169 in A14 14 so, Now NP=151+157+169. Here CFs 151, 157, 169 fully contribute to NP. This event is very clearly brought out in [Table/Fig-1] by mapping NS and NP through enveloping NS by yellow curve and NP by blue curve in [Table/Fig-2].
2. Two typical examples of multiplexing between slides, A14 6 and A14 5 [Table/Fig-6a,b].
CF 164, 165 and 170 in A14 6 after multiplexing, reorganised into CF 176, 177, 178 and 179 in A14 5. CF 167 and 175 in A14 6 multiplexed transforming into CF 180, 181 and 182 in A14 5. The constituents of NS and NP as mapped are shown here in symbolic representation as-NS=CF 175*+174: NP=151+157+169 in A14 6 and NS=CF 181+180+174: NP=157+169+151 in A14 5.
3. The typical examples of split, fusion and multiplexing together between slides A17 1-A18 15 [Table/Fig-7a,b]:
CF 209 in A17 5 split into CF 226 and 227 in A18 15. CF 223, 218b and 211 in A17 5 fused into CF 228 in A18 15. CF 221 and 222 in A17 5 multiplexed into CF 229, 230, 231, 232, 233 and 234 in A18 15. The mapped fascicles in NS and NP symbolically can be shown as: NS=219+215+218a+224; NP=220+213+214 in A17 1 and NS=219+215+218a+224; NP=220+213+214 in A18 15.
Discussion
Though the mapping of fascicles has been done by some authors on femoral nerve [7], sciatic nerve [8] and on pudendal nerve [9]. But these authors tracked the fascicles at the interval of five mm missing the complete distribution of nerve fibers through transformational processes which are very important for suitable placement of nerve cuff electrodes unlike our study. Few authors have also carried out 3D peripheral nerve fascicle reconstruction [10].
The physical measurements of positions of various important points in correlation and tracking of straight and continuous pathways of CFs, interrupted by transformational processes and point of emanation of NS and NP [Table/Fig-3,4] of femoral nerve from ‘Inguinal ligament’, are highly useful in localising and identifying the CFs. The phenomenon of transformational processes alters the distribution pattern of nerve fibers, their grouping into CFs, their setup or organisation and their innervation pattern. The split of CFs in one slide subdivides the nerve fibers into two or more CFs in next slide and the fusion causes mixing of the fibers from two or more CFs in one slide into one CF in next slide. The multiplexing of two or more input CFs redistribute the nerve fibers into two or more output CFs. No nerve possesses purely sensory or motor nerve fibers [11]. These nerve fibers emanating from afferent and efferent nerve roots are initially grouped into motor and sensory fascicles but the naturally, developing system to form branch nerves containing appropriate blend of both types nerve fibers to facilitate emergence of branch nerves for appropriate innervation of targeted region, causes these transformational processes. As these processes of split, fusion and multiplexing cause the changes in shape, size, orientation and location of CFs due to distribution and intermixing of nerve fibers so identification, extension of pathways constituting configuration and organisation of CFs becomes complex. However, comprehending correlation parameters and using our own skill, experience and knowledge, the clear picture of fascicular pathways of CFs during formation of NS and NP till their emergence from femoral nerve, have been brought out.
NS Model
This model reveals the complete pathways of CFs 10, 11 and 12 contributing to NS from slide A1 8 cranially to CFs, 298, 299, 307, 308 and 309 in A23 1 caudally [Table/Fig-3]. After identification through slide correlation, the group of CFs constituting NS in each and every slide were sorted out in groups to track NS in these slides. The continuity, consistency and correlativity of groups of CFs in each slide forming NS are also displayed in this table [Table/Fig-10]. The specific CFs having more continuity, consistency and correlativity were also identified to see more straight paths [Table/Fig-12].
NP Model
The CFs 7, 8 and 9 in slide A1 8 have been found main contributors to NP formed of CFs 220, 305 and 306 at emergence after A24 1 [Table/Fig-4]. The model presents very clear picture of pathways of CFs from top of femoral nerve to the emanation of NP. Not only these CFs have been identified by names in the entire length of their pathways but also the location of transformational processes may be determined with the help of calibrated slides and calibrated distances. The NP was correlated in all the slides by identifying through assigned numbers of group of CFs contributing partially or fully to NP as shown in [Table/Fig-11]. The specific CFs having more continuity, consistency and correlativity were also shown in [Table/Fig-13]. These tables not only provide very clear picture of CF’s pathways but also determine the location of transformational processes interrupting their straight pathways.
Computation of continuity, consistency and correlativity of selected CFs of nerve to pectineus.
| Contributing CFs | Sections/slides | Interval (mm) | Placement between (cm) |
|---|
| CF9* | A1 8-A2 10 | 0.399 | 8.60375-8.20475 |
| CF26/26a | A2 15-A3 1 | 0.607 | 8.20725-7.600250 |
| CF40/40′ | A4 14-A5 1 | 0.6065 | 7.40675-6.80025 |
| CF27* | A2 9-A9 1 | 2.904 | 8.10425-5.20025 |
| CF86* | A8 2-A9 1 | 0.4005 | 5.60075-5.20025 |
| CF122**/122a** | A11 5-A12 1 | 0.402 | 4.40225-4.00025 |
| CF127* | A12 15-A13 6 | 0.5045 | 4.20725-3.70275 |
| CF213+214 | A16 5-A18 6 | 0.6995 | 2.40225-1.70275 |
| CF220+238 | A18 5-A23 11 | 1.895 | 1.60225-(-0.29275) |
| CF220, 305, 306 | A23 10-A24 1 | 0.5045 | -0.39525-(-89975) |
Contributing CFs is CFs contributing to NP which is more continuous, consistent and correlatable. Slides/sections=represents the slides between which the CF is continuous, consistent and correlatable. CCC interval (mm)=represents the interval in millimetres in which CFs are continuous, consistent and correlatable. Placement between: represents the calibrated labels in distance from inguinal ligament. The stimulating electrodes can be placed within this interval. CCC=continuous, consistent and correlatable.
This experimental work produced two table models of NS and NP, would not only facilitate to smoothen the controversy of somatotopy and plexiformation [12] by identification, isolation and localisation of fascicle and its relationship with the specific nerve and region of innervations by these nerve fibers but also provide shape, size and directivity of fascicle for matching of nerve fibers for repair, grafting and regeneration [4]. Our models also brought out consistency and continuity of CFs in their longitudinal pathways which is never along the whole pathway of fascicle rather it is prevalent in between transformational processes. This establishes limited somatotopic structure of fascicles.
Clinical Significance
The nerves NP and NS and also their CFs can be injured anywhere in entire fascicular pathways causing partial/full paralysis of the sartorius and pectineus muscles impairing their functions. Therefore, the diagnosis of such neural insults requires not only the location and degree of injury but also identification, isolation, orientation, shape and size of injured CFs for planning surgical repair, grafting and regeneration. As the current experimental study brought out detailed microanatomy of NS and NP at the fascicular level consisting of internal morphology of CFs, fascicular pathways and detailed configuration so this data can be of immense use in diagnosis and neurosurgical manipulation.
The lack of thorough knowledge of innervation pattern illustrating the relationship of nerve to impaired muscle or problematic sensory area hinders the diagnosis. Here the injured elements are nerve, fascicles or nerve fibers. So, it is not only nerves but also fascicles which can suffer from injury anywhere in entire fascicular pathways from origin to point of innervation producing signs and symptoms. Thus, the investigation should not be focused on nerves only rather longitudinal pathways and configuration of fascicles should also be kept in mind. Now to investigate the degree and location of injury in nerve and CF, high resolution MRI advanced neurography [13,14] is used. But this has its own limitations of recording and interpretation and as such injured CFs neither can be identified nor related to innervations pattern of the ailed sensory area with more accuracy. This generates uncertainty in diagnosis and thereby in treatment. Thus the radiologists and neurosurgeons face the impediments of pinpointing the precise position of injury and its degree, the identification and localisation of injured CFs either for intraoperative stimulation to observe muscle response or to plan neuro-therapy or to plan neurosurgical manipulation.
However, our models of NS and NP from femoral nerve may reasonably overcome this impediment of identification of expected injured CFs as these models present the complete picture of CFs contributing to these nerves coupled with innervation pattern. Methodologically, it can be done by one to one correlation between images of histological transverse section and MRI transverse section at the same position from inguinal ligament. The distance of location of injured fascicle from inguinal ligament may be computed in MRI neurography and then the calibrated histological section in the evolved models of NS and NP at the same level is compared and examined for confirmation of identification of injured fascicle. This can further be reconfirmed by the analysis of the response of ailed organ by placing the electrodes at most suitable location for external or internal electrical stimulation of specific fascicle during intraoperative stimulation on the fascicles constituting NS and NP. The successful and non-invasive stimulation will depend on finding out most suitable location for placement of electrical electrode. The most suitable site of placement of electrode may be decided on the basis of continuous and consistent fascicles contributing fully to the nerve innervating the problematic area from our models. After identification of injured fascicle, the idea of shape, size, location and orientation can be obtained from our Table models NP and NS for matching, alignment and directivity of nerve fibers for repair, grafting and regeneration. Intraoperative nerve stimulation in the awake patient is a readily available tool that can aid in this goal by identifying the CF and suitable location through our model. Careful alignment is the critical factor in the first step. The nerve ends are inspected to identify fascicular groups matching proximally and distally amenable to individual fascicular repair [4]. These detailed procedures focus on longitudinal identification of fascicles, location of injury site and matching of fascicles for repair and grafting for administering the suitable surgical treatment. This is expected to improve failure rate with minimum invasion to other anatomical structures by iatrogenic procedures.
Our models alert the neurosurgeon to avoid intraoperative damage to fascicles during neurosurgical manipulation for repair and grafting to manage regeneration. Planning of neuro-surgical manipulations from MRI neurogrphy in association with our models will definitely enhance success to failure ratio drastically.
Limitation
The distribution of nerve fibers after multiplexing is complex so identification of nerve fibers or fascicle is subjective but interpretational skill and experience together with the suitability of correlation parameters minimises the ambiguity. The study has been carried out on a single cadaver. More experiments will produce more data for expanding scope of results of this study for making it statistically significant. This will take into account the variations in nerve network along with other anatomical variations affecting the dimensions of nerves and corresponding variations in fascicular configuration.
Conclusion
The models NS and NP portrayed a clear and complete picture consisting of detailed configuration, pattern, organisation of fascicular pathways interrupted by splits, fusions and plexiforms, shapes and sizes of CFs. All the histological slides used in the models were calibrated with distances from inguinal ligament for locating the injury on specific fascicles. The models of NS and NP can significantly improve the interpretation of injured CFs in MRI advanced neurography. The complete fascicular picture will facilitate its repair, grafting or regeneration together with detection of most suitable site for placement of electrical electrode for stimulation of specific fascicle. This will minimise the iatrogenic invasion along with reducing the failure rate. This may also help in advancing the technology in developing the instrument or equipment, CF electrode like nerve cuff electrode to revolutionise the treatment.
Recommendations
More experiments are to be carried out on femoral nerves in general and NS and NP in particular to accommodate variations and branching pattern through fascicular mapping.
The ability to manipulate nerve recovery at the cellular or gene level will provide the next significant improvement in nerve recovery.
Stimulation by nerve cuff electrode superseded cumbersome muscle based electrode but intraoperative stimulation by development of fascicle cuff electrode (Author’s innovative idea) may be another improvement over nerve cuff electrode. But this requires further research to find the dimensions of CFs contributing to innervating nerve.
Fascicular anatomy of the branch-free length of the femoral nerve distal to the inguinal ligament, the length of branch-free portion, its dimensions, the level and order of origin of various motor branches has direct clinical applications and should be further investigated in more number of cases.
This table shows correlation of group of fascicles constituting NS, their continuity, consistency and correlativity. Only those slides are given between which fascicles are correlatable, consistence and continuous. CCC between (cm): levels of slides between which the group of CFs are continuous, consistent and correlatable. CCC interval (cm): interval of continuity, consistency and correlativity of group of CFs. CCC=Continuous, Consistent and Correlatable
This table shows correlation of group of fascicles constituting NP, their continuity, consistency and correlativity. Slides=Only those slides between which fascicles are correlatable, consistence and continuous. CCC between (cm): levels of slides between which the group of CFs are continuous, consistent and correlatable. CCC interval (cm): interval of continuity, consistency and correlativity of group of CFs. CCC=continuous, consistent and correlatable
Contributing CFs are CFs contributing to NS which are more continuous, consistent and correlatable. Slides/sections=represents the slides between which the CF is continuous, consistent and correlatable. CCC interval (mm)=represents the interval in millimetres in which CFs are continuous, consistent and correlatable. Placement between: represents the calibrated sups in distance from inguinal ligament. The stimulating electrodes can be placed within this interval. CCC=continuous, consistent and correlatable