Correspondence: Neck Circumference as a Tool for Predicting Hyperuricaemia: A Hospital Based Cross-sectional Study
Himel Mondal1, Shaikat Mondal2
1 Tutor, Department of Physiology, Fakir Mohan Medical College and Hospital, Balasore, Odisha, India.
2 Senior Resident, Department of Physiology, Kalna SD Hospital, Kalna, Purba Bardhaman, West Bengal, India.
NAME, ADDRESS, E-MAIL ID OF THE CORRESPONDING AUTHOR: Dr. Himel Mondal, Tutor, Department of Physiology, Fakir Mohan Medical College and Hospital, Balasore-756019, Odisha, India.
E-mail: himelmkcg@gmail.com
Dear Editor,
We read an interesting article contributed by Chaturvedi A et al., in your journal [1]. The study was aimed at finding “relationship of Neck Circumference (NC) as a parameter in predicting hyperuricaemia” [1]. Our understanding of the research question and methodology used in the study has been summarised in [Table/Fig-1]. We would like to share some of our views about the methodology of the study.
Research question and study methodology of the study conducted by Chaturvedi A et al., [1].
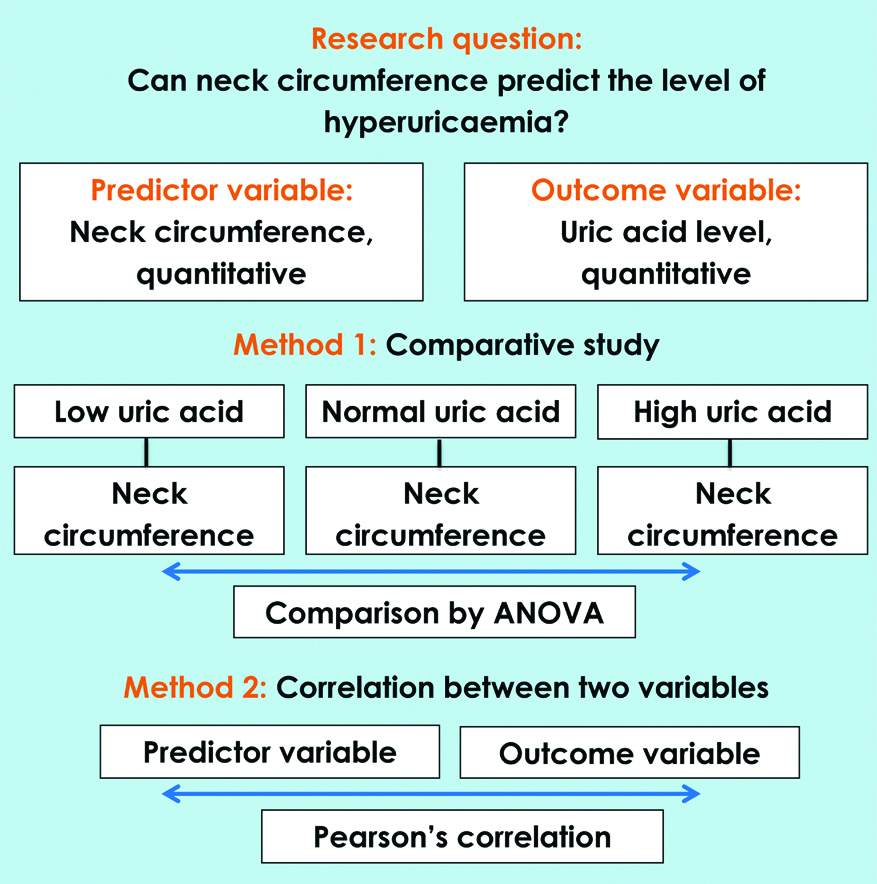
Sample size calculation: The formula used for sample size calculation is commonly used for estimating a proportion with a specified precision. Generally, it is used to estimate the prevalence. According to the aim of the study, the authors did not want to find any prevalence rate. Hence, they could use the formula for sample size estimation for “comparative studies” [2,3] or “correlation studies” [4].
During sample size calculation, if there is no similar study present in literature, a rough guess can be used by researchers. However, if feasible, data from a pilot study can be used for sample size estimation with better acceptability [3].
Categorisation of study population: Authors categorised the sample in hypouricaemic, normouricaemic and hyperuricaemic groups. Then, they compared the different anthropometric and biochemical markers among the groups. However, the research question was “if neck circumference can predict the hyperuricaemia”. Authors could divide the sample in “more than normal” and “normal” according to neck circumference. Then, they could compare the parameters between groups.
Missing data: One of the vital data of the study was missing from the manuscript. According to the title and the aim, the principal parameters were “neck circumference” and “uric acid”. We could not find the level of uric acid in each group of subjects. This could be presented for better clarity. In addition, the “[Table/Fig-4]” in the said article could be presented as “[Table/Fig-1]” as it contains the details of group-wise distribution of study population.
About interpretation of the result: From the comparative result, it was evident that low uric acid level is an indicator of low neck circumference. Similarly, high uric acid level is indicator of high neck circumference. Obviously, this may be important from the physiological point of view. To understand the association further, we evaluated the data of the study by considering “normal” and “more than normal” uric acid level (Group I and Group III of the study population). When we compared the neck circumference by unpaired t-test (with two tail α=0.05), it gave us t=0.84, p=0.40. Hence, there was no statistically significant difference between NC of normal- and hyperuricaemic group.
The correlation coefficient: Finding correlation coefficient between two continuous variables (NC and Uric acid) was the best suited statistical analysis for this study. Authors’ decision about inclusion of this method was a wise idea. However, the correlation between NC and uric acid level was found to be very weak (r=0.241, r2=0.06, n=160). Furthermore, author forgot to mention the “p” along with the correlation coefficient. The r2 showed that approximately 6% of the study population (160×6%=9.6≈10 subjects) had the perfect correlation between NC and uric acid. Considering these data, the NC cannot be considered as an effective tool to predict hyperuricaemia, even in the studied population.
We hope this correspondence would help the authors and readers of the journal for better design of their future studies.
Author’s Reply
1) Formula used for sample size calculation was according to prevalence of hyperuricaemia present in urban population.
2) As the data regarding cut-off values of neck circumference in relation to uric acid levels are scarce, it was not possible to divide the study population on the basis of neck circumference.
3) This may be attributed to the small sample size of our study.
4) Group of subjects were divided according to uric acid level i.e., normal (3.4-7.2 mg/dL males; 2.4-6.1 mg/dL females), above and below the normal.
[1]. Chaturvedi A, Tiwari S, Verma N, Narayan J, Pal AK, Srivastava N, Neck circumference as a tool for predicting hyperuricaemia: a hospital based cross-sectional studyJournal of Clinical and Diagnostic Research 2018 12(7):CC01-CC03.10.7860/JCDR/2018/34649.11795 [Google Scholar] [CrossRef]
[2]. Charan J, Biswas T, How to calculate sample size for different study designs in medical research?Indian J Psychol Med 2013 35:121-26.10.4103/0253-7176.11623224049221 [Google Scholar] [CrossRef] [PubMed]
[3]. Peacock JL, Peacock PJ, Research designIn: Oxford Handbook of Medical Statics 2011 UKOxford University Press:60-74.10.1093/med/9780199551286.003.0001 [Google Scholar] [CrossRef]
[4]. Mondal H, Mondal S, Sample size calculation to data analysis of a correlation study in Microsoft Excel®: A hands-on guide with exampleInt J Clin Exp Physiol 2016 3:180-89.10.4103/2348-8832.196896 [Google Scholar] [CrossRef]