The EE can play a major role, either positively or negatively in the success and progress of students and their studies [1]. The EE at a dental school includes various components such as the infrastructure (buildings, lecture halls, layout of the university, access to resources etc.), clinical activities, the atmosphere created by staff and students and the clinical supervision of students both at the dental hospital and at outreach sites [2]. These factors vary across different dental schools and have a major role in influencing the perception of students regarding their EE [1]. By assessing the EE in a dental school, possible problem areas can be identified and addressed in order to create a more positive and supportive learning milieu for the students [3]. Studies have reported that dental students tend to be under severe stress due to the workload and by improving the EE, it could assist in both reducing and in coping with the perceived levels of stress [4,5].
There are four dental schools in South Africa that offer the dental (BDS or equivalent BChD) degree. These four dental schools are continuously audited and subsequently accredited by the Health Professionals Council of South Africa (HPCSA) which enables them to train the dental students. This accreditation process also ensures that the curriculum, outcomes, teaching and training is standardised at these four schools.
There are various EE assessment tools used to determine the perceptions of students and of these, the DREEM has been proven to be both valid and reliable in assessing EEs [6-8]. It has been used to identify the strengths and weaknesses of various dental institutions and for the benchmarking of these institutions both locally and internationally [6-8]. The outcome of benchmarking allows academics to improve on their identified weaknesses and ultimately provide an EE that is conducive and supportive for all students [7]. In addition, educators and management have used the DREEM results to become more responsive and sensitive to the concerns of students [8-10].
The aim of the present study was to determine and compare final year dental students’ perceptions of learning environment; academic environment; academic atmosphere; clinical work and supervision and teaching at the institution at which they were enrolled. No similar study has been undertaken in South Africa and this study will allow the four dental schools to be benchmarked against each other and other international dental universities.
Materials and Methods
Primary ethical clearance for this study was received from the Faculty of Health Sciences Research Ethics Committee at the University of Pretoria (360/2017). All other dental schools received reciprocity following primary approval at the University of Pretoria. Informed consent was obtained from the respondents and all information was strictly confidential and anonymous.
This was a descriptive cross-sectional analytical study. It was carried out at the four dental schools in SA between September and November 2017. All final year students registered in 2017 at these institutes were invited to participate in this study. The students attended on a full-time daily basis and the importance of attending lectures and modules was stressed throughout the curriculum.
Due to the nature of the study and to ensure students’ anonymity, the results were coded and reported under the headings of University 1, 2, 3 and 4 in no particular order.
The study instrument, the DREEM is an internationally validated tool used for assessing the students’ perceptions regarding their dental training institution [3]. It consisted of five categories with a total of 50 items. Additional demographic information including the age, gender and the name of the institution was recorded. Each DREEM item was scored between 0 and 4 with 0 representing strongly disagree, 1-disagree, 2-uncertain, 3-agree and 4 strongly agree. There were nine negative items and these were recoded in the reverse manner in order to score them appropriately. Students were asked to choose the response which best represents the statement in relation to their dental school.
The total DREEM score was out of 200 with a lower score indicating dissatisfaction [7,11]. A total DREEM score of between 50 and 100 was considered having “plenty of problems” while a score of between 101 and 150 was considered “more positive than negative”. The individual DREEM item mean scores were classified as follows: 3.5 or greater indicated a positive perception; between 2.1 and 3.4 meant that this could be enhanced or improved while a mean score of 2.0 or less was indicative of a problematic area [7].
The domain score was calculated by taking the sum of the individual item scores in that domain while the total DREEM score was calculated from the sum of the five domain scores. The mean, median and standard deviation was calculated and compared by gender, age and institution.
Statistical Analysis
Appropriate measures of central tendency and dispersion were used to summarise the data. Inferential statistics including t-tests and ANOVA were used to compare outcomes among the different groups. Descriptive statistics were used and data was reported as frequencies and percentages for categorical variables.
Results
A total of 210 final year students were registered at the four dental schools in 2017 and of these, 141 (67%) successfully completed all of the DREEM items. The response rate per institution ranged between 74% and 51%. The mean age of the students was 23.9 years (±2.41) with 60% being 23 years or younger and almost three quarter (71%) being female. The respondents from one dental school (Dental School 3) were significantly older than the rest of the respondents (p<0.01). The results of the mean individual, domain and total scores in relation to the institution is shown in [Table/Fig-1]. Although there were no significant differences between the age and the mean domain and total scores, older students tended to score higher than their younger counterparts [Table/Fig-2]. Older students reported to be more stimulated with lectures, were more confident and felt they had received appropriate feedback during their studies. Males scored significantly higher than females in two domains; academic perception (p=0.03) and perception of atmosphere (p=0.04) [Table/Fig-2].
Results of the mean individual, domain and total scores in relation to the institution (n=141).
| Perception of learning | School 1(n=34) | School 2 (n=15) | School 3 (n=30) | School 4 (n=62) | Total (n=141) | p-value |
|---|
| 1. I am encouraged to participate in class | 2.72 (0.86) | 2.63 (0.89) | 3.17 (0.75) | 2.79 (0.66) | 2.82 (0.77) | 0.04 |
| 2. The lectures are often stimulating | 2.48 (1.01) | 2.00 (0.89) | 3.23 (0.73) | 2.49 (0.83) | 2.57 (0.93) | 0.00 |
| 3. The lectures are student-centered | 2.67 (0.74) | 2.13 (0.96) | 2.90 (0.80) | 2.48 (0.81) | 2.58 (0.83) | 0.01 |
| 4. The teaching helps to develop my competence | 2.96 (0.70) | 2.63 (0.96) | 3.20 (0.76) | 2.84 (0.70) | 2.92 (0.75) | 0.05 |
| 5. The teaching is well focused | 2.91 (0.76) | 2.13(0.89) | 3.10 (0.80) | 2.72 (0.75) | 2.78 (0.81) | 0.00 |
| 6. The teaching helps to develop my confidence | 2.50 (0.81) | 1.94(1.24) | 3.20 (0.76) | 2.60 (0.89) | 2.62 (0.94) | 0.00 |
| 7. The teaching time is put to good use | 2.54 (1.01) | 1.47 (1.19) | 3.13 (0.90) | 2.64 (0.80) | 2.59 (0.10) | 0.00 |
| 8. The teaching over-emphasises factual learning* | 1.48 (1.01) | 1.81 (1.05) | 1.10 (0.85) | 1.58 (0.78) | 1.49 (0.90) | 0.04 |
| 9. I am clear about learning objectives for the course | 2.70 (0.87) | 2.06 (0.93) | 3.10 (0.61) | 2.69 (0.78) | 2.70 (0.83) | 0.00 |
| 10. Teaching encourages me to be an active learner | 2.72 (0.69) | 1.69 (1.14) | 3.03 (0.85) | 2.60 (0.88) | 2.62 (0.91) | 0.00 |
| 11. Long term learning is emphasised over short term | 2.64 (0.99) | 1.56 (1.32) | 2.93 (0.94) | 2.79 (0.77) | 2.65 (0.10) | 0.00 |
| 12. The teaching is too teacher-centered* | 2.21 (0.83) | 1.60 (0.99) | 2.33 (1.12) | 1.93 (0.82) | 2.05 (0.92) | 0.03 |
| Total | 30.07 (5.49) | 23.00 (6.37) | 34.43 (5.69) | 30.22 (6.08) | 30.33 (6.50) | 0.00 |
| Perception of lecturers | |
| 1. The lecturers are knowledgeable | 3.05 (0.84) | 2.75 (0.93) | 3.30 (0.99) | 3.29 (0.59) | 3.18 (0.79) | 0.04 |
| 2. The lecturers are patient with patients | 3.05 (0.84) | 2.56 (1.03) | 3.00 (1.08) | 2.80 (0.90) | 2.88 (0.94) | 0.24 |
| 3. The lecturers ridicule the students* | 2.02 (1.14) | 0.81 (0.91) | 2.20 (1.40) | 1.65 (0.99) | 1.77 (1.16) | 0.00 |
| 4. The lecturers are authoritarian* | 1.49 (0.87) | 1.06 (0.93) | 1.80 (1.24) | 1.23 (0.82) | 1.39 (0.95) | 0.02 |
| 5. Lecturers have good communication skills with patience | 2.43 (0.94) | 2.44 (0.96) | 2.73 (1.20) | 2.76 (0.79) | 2.63 (0.93) | 0.21 |
| 6. The lecturers provide good student feedback | 2.43 (0.94) | 1.13 (0.83) | 2.63 (1.27) | 2.29 (0.97) | 2.29 (1.07) | 0.00 |
| 7. The lecturers provide constructive criticism | 2.26 (0.95) | 1.25 (0.93) | 2.70 (1.12) | 2.49 (0.83) | 2.35 (1.00) | 0.00 |
| 8. The lecturers give clear examples | 2.72 (075) | 2.44 (0.81) | 2.87 (1.14) | 2.53 (0.78) | 2.63 (0.85) | 0.21 |
| 9. The lecturers get angry in the class* | 2.27 (1.05) | 1.56 (1.03) | 2.43 (1.10) | 2.09 (1.06) | 2.15 (1.08) | 0.05 |
| 10. The lecturers are well prepared for their class | 2.69 (8.2) | 2.75 (0.58) | 2.83 (1.02) | 3.00 (0.66) | 2.86 (0.78) | 0.18 |
| 11. The students’ irritate their lecturers* | 2.14 (1.05) | 2.50 (0.97) | 2.57 (1.04) | 1.76 (0.97) | 2.08 (1.05) | 0.00 |
| Total | 26.71 (4.3) | 21.31(5.68) | 29.07 (8.91) | 25.89 (5.78) | 26.23 (6.46) | 0.00 |
| Academic self-perception | |
| 1. Learning strategies which worked before work now | 2.07 (0.94) | 1.87 (0.92) | 2.83 (0.83) | 2.09 (0.98) | 2.21 (0.98) | 0.00 |
| 2. I am confident about my passing this year | 3.20 (0.81) | 2.50 (0.89) | 3.23 (1.01) | 2.96 (0.82) | 3.03 (0.88) | 0.02 |
| 3. I feel I am being well prepared for my profession | 3.00 (1.10) | 2.50 (0.89) | 3.53 (0.68) | 3.12 (0.64) | 3.10 (0.87) | 0.00 |
| 4. Last year’s work has been good preparation for this year | 3.09 (0.76) | 2.69 (0.79) | 3.47 (0.63) | 3.21 (0.69) | 3.17 (0.73) | 0.00 |
| 5. I am able to memorise all I need | 2.38 (1.11) | 1.50 (1.03) | 2.90 (0.10) | 2.15 (1.03) | 2.29 (1.11) | 0.00 |
| 6. I have learnt a lot about empathy in my profession | 3.18 (0.86) | 3.06 (0.77) | 3.37 (0.62) | 3.16 (0.67) | 3.20 (0.73) | 0.51 |
| 7. My problem solving skills are being well developed | 3.30 (0.59) | 2.38 (0.89) | 3.27 (0.79) | 3.15 (0.66) | 3.13 (0.74) | 0.00 |
| 8. Much of what I learn seems relevant to dentistry | 3.38 (0.72) | 2.50 (0.63) | 3.47 (0.57) | 3.25 (0.64) | 3.25 (0.70) | 0.00 |
| Total | 23.49 (3.88) | 18.87 (2.67) | 26.07 (4.07) | 23.09 (3.71) | 23.37 (4.15) | 0.00 |
| Perception of the atmosphere | |
| 1. The atmosphere is relaxed during clinical sessions | 2.56 (0.97) | 0.56 (0.63) | 2.53 (1.38) | 1.78 (1.11) | 2.02 (1.24) | 0.00 |
| 2. The dental school is well time-tabled | 0.51 (1.08) | 0.19 (0.40) | 2.63 (1.33) | 1.99 (1.04) | 1.51 (1.39) | 0.00 |
| 3. Cheating is a problem in this school* | 2.45 (1.09) | 2.06 (1.61) | 1.87 (1.46) | 2.30 (1.12) | 2.24 (1.24) | 0.21 |
| 4. The atmosphere is relaxed during lectures | 2.51 (1.06) | 2.25 (0.86) | 3.00 (0.91) | 2.84 (0.67) | 2.72 (0.88) | 0.00 |
| 5. There are opportunities to develop inter-personal skills | 2.89 (0.61) | 1.63 (1.20) | 3.03 (1.03) | 2.57 (0.84) | 2.65 (0.94) | 0.00 |
| 6. I feel comfortable in class socially | 2.89 (0.80) | 2.69 (0.70) | 3.27 (0.58) | 2.93 (0.77) | 2.96 (0.75) | 0.05 |
| 7. Atmosphere is relaxed during seminars/tutorials | 2.51 (1.06) | 2.00 (0.97) | 3.10 (0.10) | 2.94 (0.69) | 2.75 (0.95) | 0.00 |
| 8. I find the experience disappointing* | 2.53 (0.89) | 0.75 (0.86) | 2.83 (1.15) | 2.43 (0.97) | 2.37 (1.12) | 0.00 |
| 9. I am able to concentrate well | 2.44 (0.89) | 1.44 (0.73) | 3.03 (0.62) | 2.55 (0.80) | 2.50 (0.89) | 0.00 |
| 10. The enjoyment outweighs the stress of studying dentistry | 1.44 (1.10) | 0.73 (1.36) | 2.43 (1.10) | 1.64 (1.26) | 1.66 (1.27) | 0.00 |
| 11. The atmosphere motivates me as a learner | 2.20 (1.00) | 0.75 (0.86) | 3.03 (0.67) | 2.19 (1.00) | 2.21 (1.10) | 0.00 |
| 12. I feel able to ask the questions I want | 2.43 (0.97) | 1.69 (1.20) | 2.87 (0.90) | 2.37 (1.03) | 2.41 (1.04) | 0.00 |
| Total | 27.02 (5.80) | 16.88 (5.73) | 33.63 (6.42) | 28.52 (6.30) | 27.90 (7.50) | 0.00 |
| Social self-perception | |
| 1. There is good support for students who get stressed | 1.98 (1.02) | 0.56 (0.63) | 2.37 (1.16) | 1.84 (1.10) | 1.85 (1.15) | 0.00 |
| 2. I am too tired to enjoy this course* | 1.33 (1.04) | 0.38 (0.62) | 1.93 (1.31) | 1.46 (1.13) | 1.41 (1.17) | 0.00 |
| 3. I am rarely bored with this course | 1.25 (0.89) | 2.25 (1.13) | 2.17 (1.26) | 2.45 (1.03) | 2.04 (1.16) | 0.00 |
| 4. I have good friends in this college | 3.30 (0.77) | 3.00 (1.03) | 2.93 (1.11) | 3.31 (0.78) | 3.20 (0.88) | 0.16 |
| 5. My social life is good | 2.71 (1.14) | 1.31 (1.20) | 3.10 (0.10) | 2.16 (1.41) | 2.41 (1.34) | 0.00 |
| 6. I seldom feel lonely | 2.71 (1.14) | 1.69 (1.08) | 2.53 (1.11) | 2.22 (1.25) | 2.37 (1.21) | 0.02 |
| 7. My accommodation is pleasant | 2.71 (1.14) | 3.25 (0.86) | 3.07 (0.94) | 3.01 (1.08) | 2.96 (1.06) | 0.24 |
| Total | 16.00 (4.06) | 12.44 (2.50) | 18.10 (4.21) | 16.46 (4.62) | 16.24 (4.44) | 0.00 |
| SUM total of DREEM score | 124.00 (16.63) | 91.73 (16.91) | 141.3 (23.23) | 124.45 (21.89) | 124.45 (24.29) | 0.00 |
*These items are negatively worded and were recoded prior to calculating the total and subscale scores
*Values highlighted in green and orange colour represents the mean highest and lowest scores respectively
Courtesy permission: Roff S, McAleer S, Harden RM, Al-Qahtani M, Ahmed AU, Deza H, et al. Development and validation of the Dundee ready education environment measure (DREEM). Med Teach. 1997;19(4):295-99 [8].
Association between gender and age and the mean domain and total scores.
| Domains | Male (n=41) | Female (n=100) | p-value | Age ≤23 (n=85) | Age ≥24 (n=56) | p-value |
|---|
| Perception of learning | 30.9 | 29.9 | 0.43 | 29.8 | 31.0 | 0.31 |
| Perception of lecturers | 25.5 | 26.6 | 0.40 | 26.2 | 26.8 | 0.59 |
| Academic perception | 24.5 | 22.8 | 0.03 | 23.2 | 23.4 | 0.81 |
| Perception of atmosphere | 30.1 | 27.2 | 0.04 | 28.1 | 27.9 | 0.89 |
| Social perception | 17.4 | 15.8 | 0.06 | 16.2 | 16.4 | 0.83 |
| Total Score | 128.5 | 122.4 | 0.18 | 123.5 | 125.5 | 0.64 |
Results from the DREEM questionnaire are presented in three formats
1. Item Scores
The highest (>75%) and lowest (<50%) scoring items are shown in [Table/Fig-3].
Highest and lowest mean scoring items.
1. What I learn seems relevant to dentistry (3.3)
2. Have good friends in this college (3.2)
3. Learnt a lot about empathy in my profession (3.2)
4. Lecturers are knowledgeable (3.2)
5. I feel comfortable in class socially (3.0)
6. Lecturers are authoritarian (1.4)
7. I am too tired to enjoy this course (1.4)
8. Timetabling issues (1.5)
9. Teaching over-emphasizes factual learning (1.5)
10. Enjoyment outweighs stress of studying dentistry (1.7)
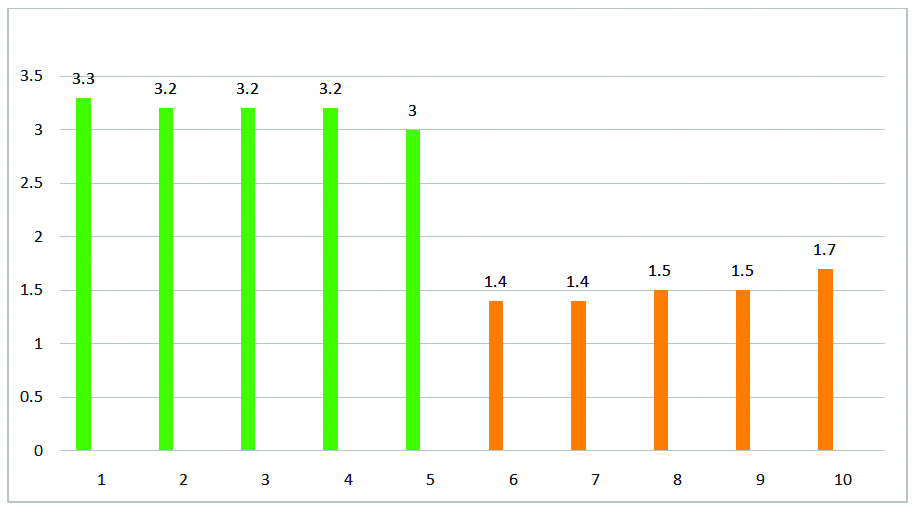
Seven items (14%) had a mean score of less than 2 (50%) which meant that these were problem areas. These items were from different domains but they were all related to the teaching curriculum, authoritarian nature of lecturers, workload and timetabling issues.
2. Domain Scores
There were five domains and these were assessed in [Table/Fig-1].
Perception of Learning: The mean score was 30.3 (with the lowest being 23.0 and the highest 34.4) and this indicated that the respondents had a more positive approach. Although there were significant differences between the dental schools, students generally felt that they were encouraged to participate in class and developed their confidence while learning at the dental school. However, many of them reported that there was too much factual learning in the dental curriculum.
Perception of lecturers: The mean score was 26.2 (ranging between 21.3 and 29.1) which indicated that the institutions were moving in the right direction. Most of the students perceived their lecturers to be knowledgeable and irrespective of their institution, felt that they had good communication skills, dealt with patients in a kind manner and provided clear examples whilst teaching. However, many students also perceived lecturers to be authoritarian. In addition, institution 2 had a mean score of 21.3 and this indicated that the teaching staff may need retraining.
Academic self-perception: The mean score was 23.4 (between 18.9 and 26.1) and this meant that they perceived it to be more on the positive side. The vast majority reported to have learnt about empathy and felt that the content of their lectures was relevant to dentistry.
Perception of the atmosphere: The mean score was 27.9 (16.9 to 33.6) which implied that the atmosphere was more positive than negative. The students however, reported to be under severe stress and felt that the timetabling was a concern. Students seemed to have overcome most social barriers and reported to be comfortable in class. Students at institution 2 had a mean score of 16.9 which meant that there were many issues that needed to be changed.
Social self-perception: The mean score was 16.2 (12.4 to 18.1) which was interpreted as not too bad. Generally all students were pleased with their accommodation and reported to have lots of good friends. However, many felt that they were too tired to enjoy the dentistry course.
3. Overall DREEM Scores
The participants demonstrated a positive perception towards their EE as well as showed a great regard and appreciation for their lecturers. The mean score was 124.5 which indicated that students felt more positive than negative [7]. Only one institution had a mean score below the 50% mark (91.7) and this indicated that there were plenty of problems at that institute [Table/Fig-1]. The rest of the institutions scored above 50% and this meant that that they were more positive than negative.
Discussion
This study sought to elicit student responses to a wide range of variables that had an effect on the learning experience at dental school over a five year period. The tool used was an internationally validated instrument that has successfully been used in a number of different settings in schools from both developed and developing countries [8-14].
The response rate varied between the different schools and this could have been due to the procedure in which the data was collected. Some institutions collected the survey after lectures and if students did not attend, they were excluded. The current study selected only final year students to participate as it was felt that they would be able to provide an overall impression of the EE since they had been in the same institution for almost five years studying dentistry.
The age varies across the institutions and older students seemed to be more stimulated with the lectures than their younger counterparts. Their scores indicated that they were more confident, felt they received good feedback and were aware of support structures that were at the institutions. The reason could be having studied previously at the same institute and possibly were not afraid to ask for feedback compared to younger students. This was similar to other studies which also showed that the more senior students viewed some items more positively than their younger counterparts [10].
Females had significantly lower mean and overall scores compared to males; this implied that they were generally more dissatisfied compared to males and this was similar to other studies carried out in the Middle East and Sri Lanka [4,11]. In the current study, females scored significantly lower on items related to stress, organized time tabling and on having a social life compared to males. This was confirmed by a study done at a dental university in South Africa which reported that female dental students were more stressed out than males [4]. However, females reported to have more close friends compared to males and this could be as a result of the support they garner from each other to help deal with the stress and demands of the dental programme [15].
The highest scoring items, similar to other studies included; “much of what I learn seems relevant to dentistry [9]; I have good friends in this college [9]; I have learnt a lot about empathy in my profession and the lecturers are knowledgeable” [1,9].
The lowest scoring items were similar to other studies and included; the lecturers are authoritarian [1,12,13], the teaching over-emphasises factual learning [1,13] and I am too tired to enjoy this course [1,12].
Perception of Learning
The students felt that the course improved their competence and stimulated participation in class. This could be due to the size of the dental classes and the interactive nature of dental lectures. All of the students, irrespective of their institution, felt that there was too much factual learning in the curriculum; this was also reported by other students in previous studies [14-16]. Dentistry is unique in the sense that students must have a strong theoretical base in order to understand the disease progression, diagnose oral and general diseases and be able to have the clinical skills to treat patients appropriately.
Perception of Lecturers
The students reported that the lecturing staff were knowledgeable, had good communication skills with both students and patients and provided clear examples when teaching. This was similar to other studies and possibly due to the experience of the lecturers and the quality of their training [12]. Similar to other studies, students in SA scored the item regarding the lecturers as being knowledgeable as one of the highest scores and this is important as it confirms that academic lecturers at South African institutions are of a good quality [17,18]. However, most of the students felt that the lecturers were authoritarian and this item scored the lowest from all items in the survey. This was similar to other studies as well where students perceived lecturers to be too authoritarian [16,19]. Students at University 2 reported that their lecturers need retraining and support to improve their skills. This could be due to the fact that academic staff at dental institutions are dentists or dental specialists by profession rather than teachers. Hence, their teaching pedagogy and skills may still need to be developed [20].
Academic Self-perception
All of the students strongly agreed that they felt more empathy and that the content was relevant to dentistry. This could be due to outreach programmes in which students visit rural communities, schools and crèches and offer oral health services. In general, they were more positive about their academic content and problem solving skills.
Perception of the Atmosphere
The majority of students strongly felt that the timetabling and the stress associated with studying dentistry was a problem. This was similar to other studies and confirmed the huge workload and expectations of the students and the limited duration of the dentistry programme [17,21]. This has shown to be a universal problem for dental students who all agree that studying dentistry is a source of severe stress [4,5,22]. On the positive side, students felt acceptable socially and in general had more positive than negative feelings about the atmosphere.
Social Self-perception
The respondents reported that they had good friends and this item scored highly in many other similar studies throughout the world [17,23]. This showed that the bond developed during the five years of study was one of care and assistance together with unity and support. However, they also felt that they were too tired during their years of study and this could be related to the high workload which also impacted on the time tabling of thecourse and the fact that many were under severe stress [17].
Students at Universities 1 and 4 reported similar scores for all items and domains. University 2 continuously scored lower than the other institutions and this could be due to a number of factors including- having the highest number of female students compared to the other institutions and the fact that females tended to have lower scores compared to males. Other reasons could include the fact that it formed part of the general hospital and had severe space shortage and infrastructure challenges. These concerns have been confirmed in the Health Professional Council of South Africa accreditation reports and the quinquennial reports submitted by that dental school. In addition, the students perceived the lecturers to ridicule them and to be authoritarian in nature. This seemed to have created a tense atmosphere making the students unhappy and tired during their course. These could be some of the reasons why students at this particular school perceived the EE to have “lots of problems” according to the interpretation of the DREEM survey.
University 3 consisted of more students who were older and had more males than the other institutions and this could be a reason for their high scores. This dental school is the youngest of the four and possibly well-designed as it probably based its design and lay-out on newly designed dental hospitals.
Overall DREEM Scores
In general students were happy with their institutions and felt more positive than negative about their environment. In comparison to other dental schools outside South Africa, the mean result of 125 obtained in the current study was similar to other studies which ranged between 115 and 124 [13,17,23]. The results from this study revealed that the perception that the EE at dental schools in developing and developed countries is different is not entirely true. The results from this study are similar to those obtained in Europe [9,17,21] and as a result it allows for the opportunity for common consensus to be reached on the following issues:
International norms and standards can be applied to improve and monitor settings throughout the world.
Those items in which there were significant differences were related to logistical, contextual and structural differences rather than educational factors.
This means that from an educational context, solutions that are implemented and proved to be successful in one setting can easily be adopted in all dental settings.
This opens up the opportunity to bench mark tests which focus on the ability to cope with stress and high workload as it is clear, the duration and content cannot be reduced or dramatically changed.
Recommendation
The content of the dental curriculum and the way in which it is being taught must be constantly monitored and evaluated to improve students’ perceptions of their institutions. It must also be compared to and benchmarked between international dental schools to identify and then rectify universal issues related to the training and teaching of dentists.
Lecturers need to be evaluated and reviewed both by students and peers on a regular basis to ensure that their presentation skills are relevant and appropriate for the students.
The timetabling of the lectures and clinical sessions needs to be reviewed and modified so as to create a more enjoyable learning experience.
Since many respondents felt that they were under stress, universities should introduce support for these students to help cope with the stress and its effects.
Academics and management from the four dental schools should meet regularly to discuss the curriculum, teaching strategies, issues related to the timetabling and other common problems.
Limitation
These results were done on all of the South African dental schools but they cannot be generalised to the rest of Africa or other developing countries. More studies should be done in other countries to benchmark and compare the students’ perceptions of their EE.
Conclusion
Overall students perceived their EE to be more positive than negative with older students and males being more satisfied compared to their counterparts. On the domain scores, students also felt more positive than negative. The content of the dental curriculum and the way in which it was being taught must be constantly monitored and evaluated in order to make the course more enjoyable, to reduce the workload and to make it less stressful for the students.
*These items are negatively worded and were recoded prior to calculating the total and subscale scores
*Values highlighted in green and orange colour represents the mean highest and lowest scores respectively
Courtesy permission: Roff S, McAleer S, Harden RM, Al-Qahtani M, Ahmed AU, Deza H, et al. Development and validation of the Dundee ready education environment measure (DREEM). Med Teach. 1997;19(4):295-99 [8].